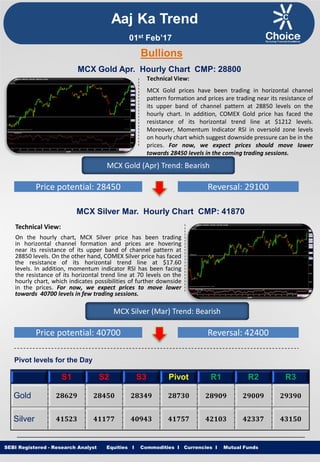
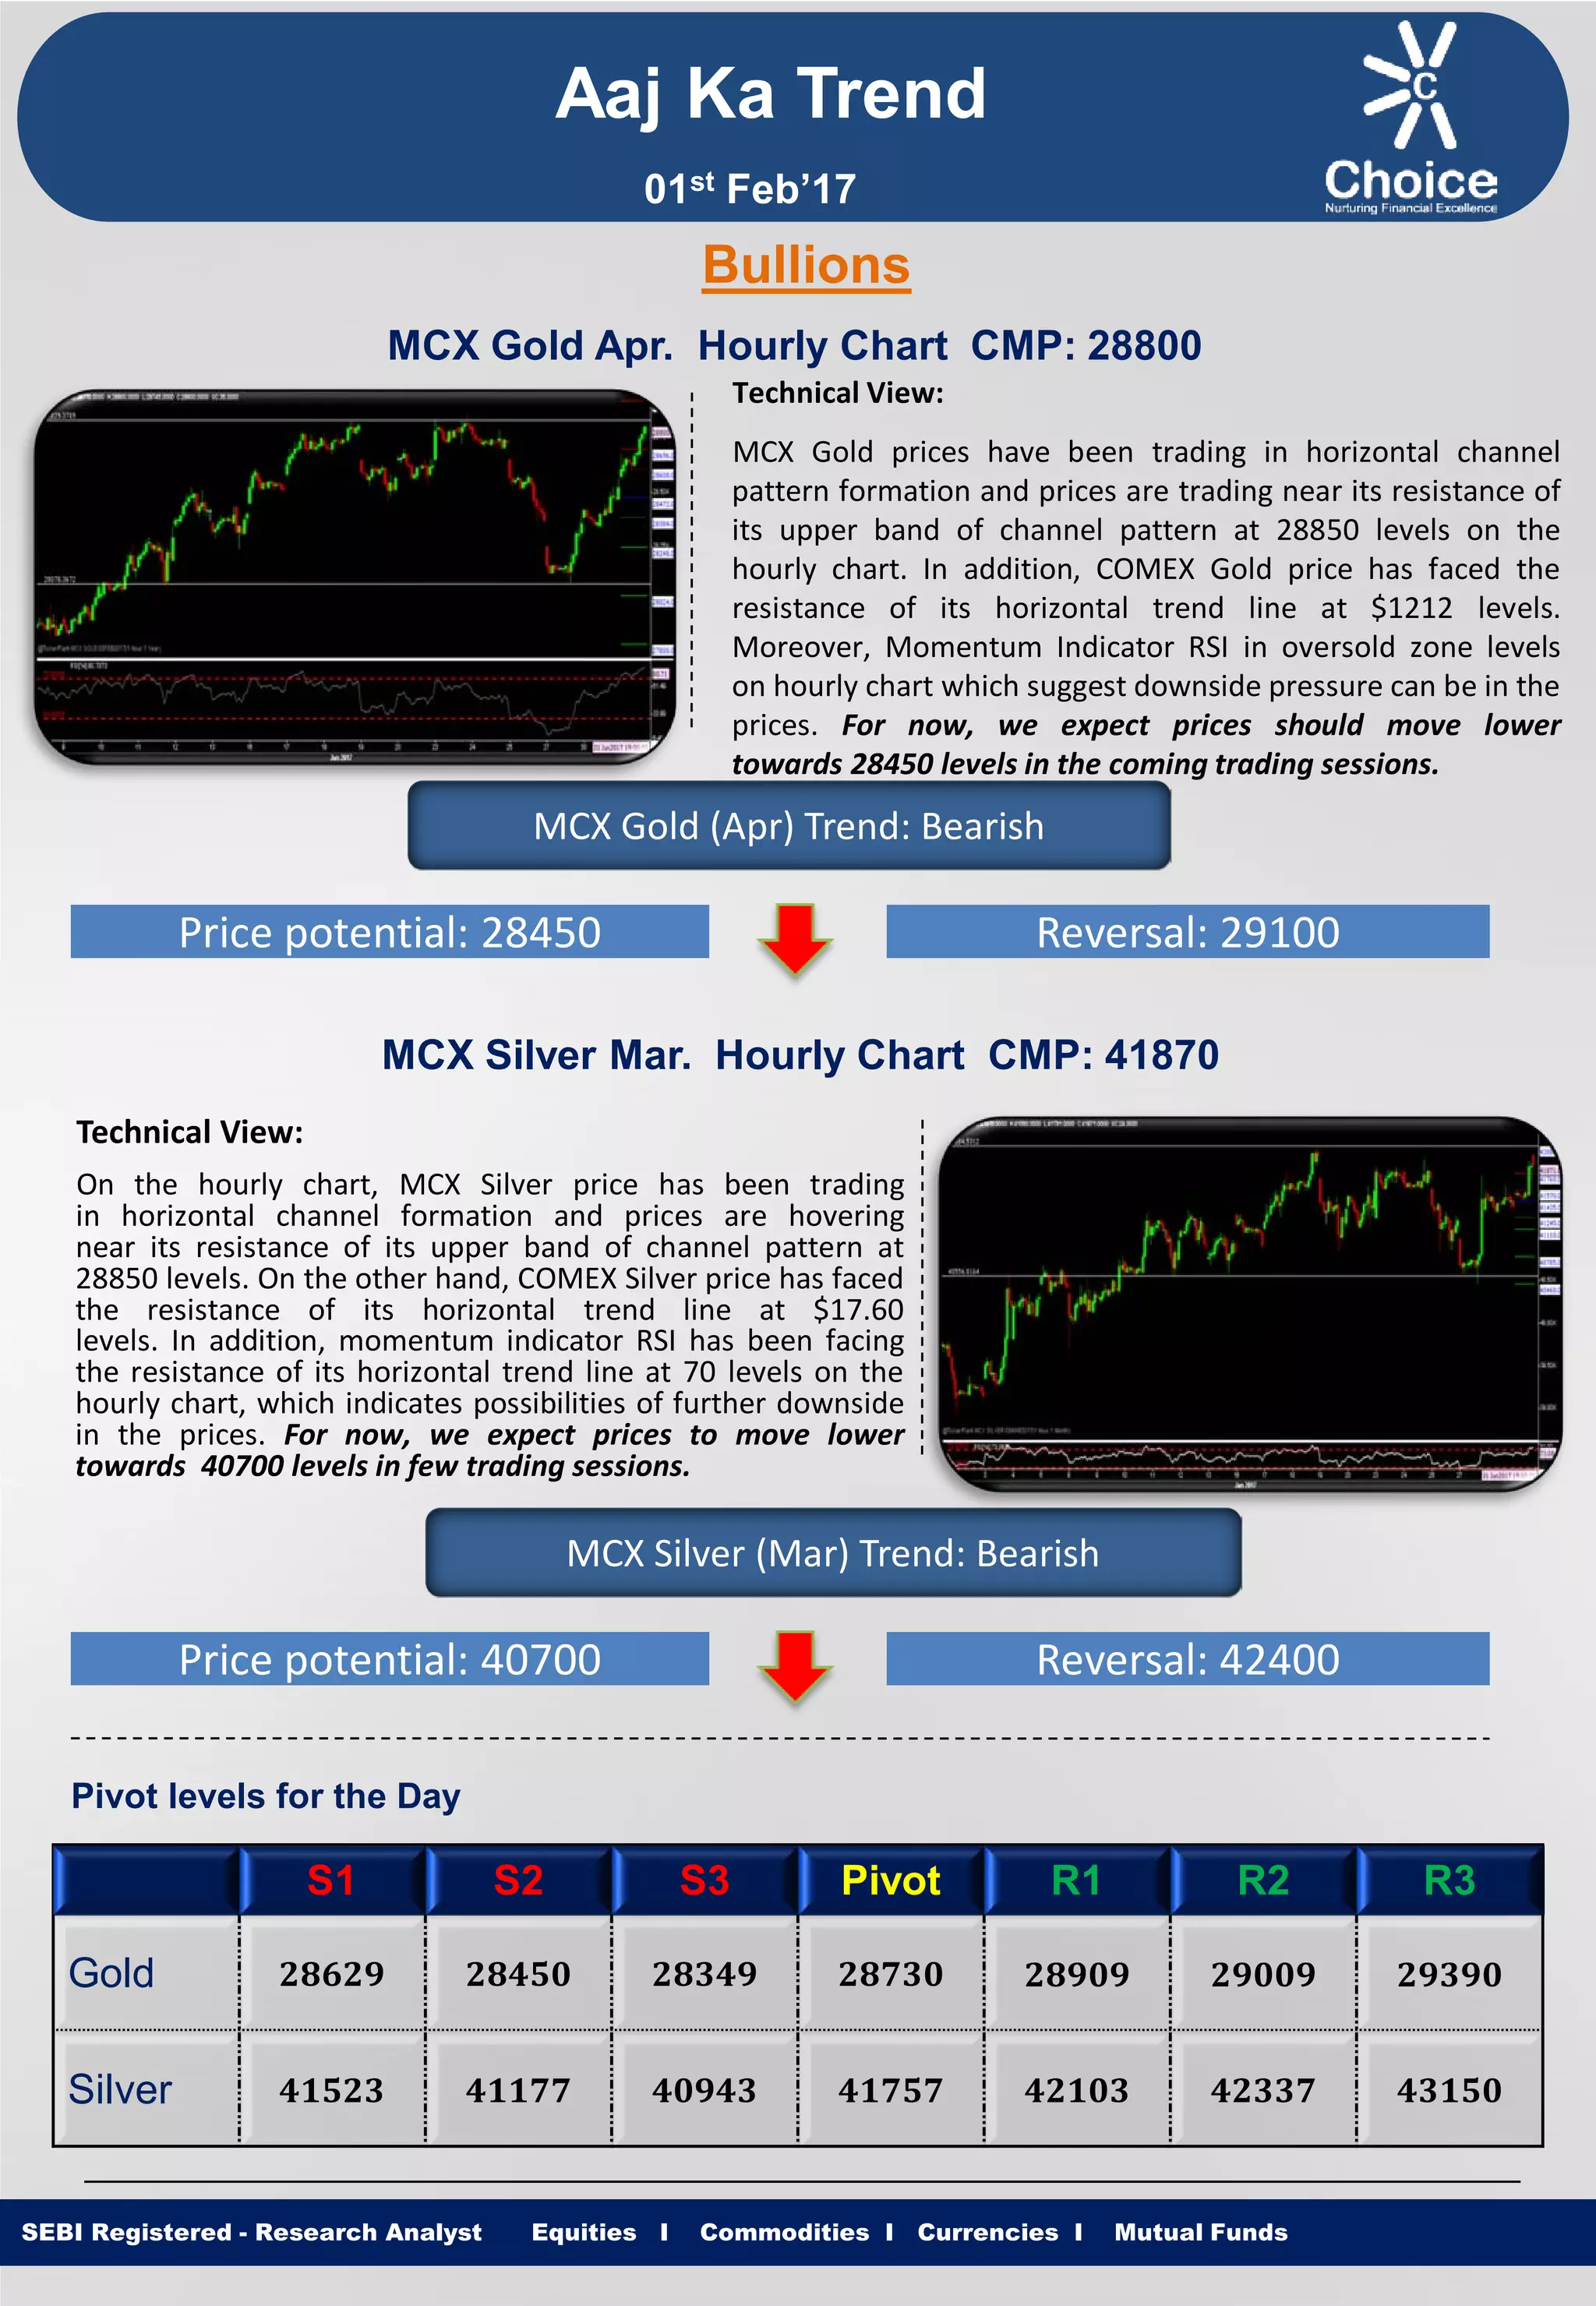
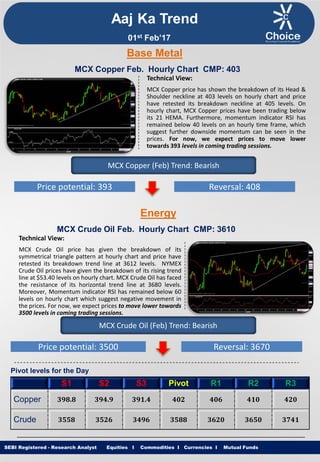
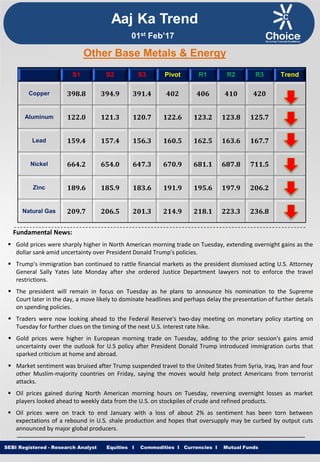
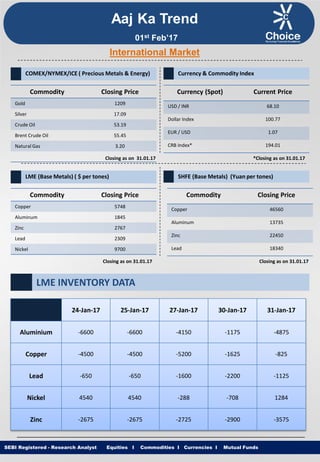
1. Equities I Commodities I Currencies I Mutual Funds
Aaj Ka Trend
Technical View:
MCX Gold prices have been trading in horizontal channel
pattern formation and prices are trading near its resistance of
its upper band of channel pattern at 28850 levels on the
hourly chart. In addition, COMEX Gold price has faced the
resistance of its horizontal trend line at $1212 levels.
Moreover, Momentum Indicator RSI in oversold zone levels
on hourly chart which suggest downside pressure can be in the
prices. For now, we expect prices should move lower
towards 28450 levels in the coming trading sessions.
SEBI Registered - Research Analyst Equities I Commodities I Currencies I Mutual Funds
Bullions
MCX Gold Apr. Hourly Chart CMP: 28800
MCX Gold (Apr) Trend: Bearish
Price potential: 28450 Reversal: 29100
MCX Silver Mar. Hourly Chart CMP: 41870
Technical View:
On the hourly chart, MCX Silver price has been trading
in horizontal channel formation and prices are hovering
near its resistance of its upper band of channel pattern at
28850 levels. On the other hand, COMEX Silver price has faced
the resistance of its horizontal trend line at $17.60
levels. In addition, momentum indicator RSI has been facing
the resistance of its horizontal trend line at 70 levels on the
hourly chart, which indicates possibilities of further downside
in the prices. For now, we expect prices to move lower
towards 40700 levels in few trading sessions.
MCX Silver (Mar) Trend: Bearish
Price potential: 40700 Reversal: 42400
Pivot levels for the Day
S1 S2 S3 Pivot R1 R2 R3
Gold 28629 28450 28349 28730 28909 29009 29390
Silver 41523 41177 40943 41757 42103 42337 43150
01st Feb’17
2. Equities I Commodities I Currencies I Mutual Funds
Technical View:
MCX Copper price has shown the breakdown of its Head &
Shoulder neckline at 403 levels on hourly chart and price
have retested its breakdown neckline at 405 levels. On
hourly chart, MCX Copper prices have been trading below
its 21 HEMA. Furthermore, momentum indicator RSI has
remained below 40 levels on an hourly time frame, which
suggest further downside momentum can be seen in the
prices. For now, we expect prices to move lower
towards 393 levels in coming trading sessions.
SEBI Registered - Research Analyst Equities I Commodities I Currencies I Mutual Funds
MCX Copper Feb. Hourly Chart CMP: 403
MCX Copper (Feb) Trend: Bearish
Price potential: 393 Reversal: 408
MCX Crude Oil Feb. Hourly Chart CMP: 3610
Technical View:
MCX Crude Oil price has given the breakdown of its
symmetrical triangle pattern at hourly chart and price have
retested its breakdown trend line at 3612 levels. NYMEX
Crude Oil prices have given the breakdown of its rising trend
line at $53.40 levels on hourly chart. MCX Crude Oil has faced
the resistance of its horizontal trend line at 3680 levels.
Moreover, Momentum indicator RSI has remained below 60
levels on hourly chart which suggest negative movement in
the prices. For now, we expect prices to move lower towards
3500 levels in coming trading sessions.
MCX Crude Oil (Feb) Trend: Bearish
Price potential: 3500 Reversal: 3670
Pivot levels for the Day
S1 S2 S3 Pivot R1 R2 R3
Copper 398.8 394.9 391.4 402 406 410 420
Crude 3558 3526 3496 3588 3620 3650 3741
Base Metal
Energy
Aaj Ka Trend
01st Feb’17
3. Equities I Commodities I Currencies I Mutual FundsSEBI Registered - Research Analyst Equities I Commodities I Currencies I Mutual Funds
Other Base Metals & Energy
S1 S2 S3 Pivot R1 R2 R3 Trend
Copper 398.8 394.9 391.4 402 406 410 420
Aluminum 122.0 121.3 120.7 122.6 123.2 123.8 125.7
Lead 159.4 157.4 156.3 160.5 162.5 163.6 167.7
Nickel 664.2 654.0 647.3 670.9 681.1 687.8 711.5
Zinc 189.6 185.9 183.6 191.9 195.6 197.9 206.2
Natural Gas 209.7 206.5 201.3 214.9 218.1 223.3 236.8
Fundamental News:
Gold prices were sharply higher in North American morning trade on Tuesday, extending overnight gains as the
dollar sank amid uncertainty over President Donald Trump's policies.
Trump's immigration ban continued to rattle financial markets as the president dismissed acting U.S. Attorney
General Sally Yates late Monday after she ordered Justice Department lawyers not to enforce the travel
restrictions.
The president will remain in focus on Tuesday as he plans to announce his nomination to the Supreme
Court later in the day, a move likely to dominate headlines and perhaps delay the presentation of further details
on spending policies.
Traders were now looking ahead to the Federal Reserve's two-day meeting on monetary policy starting on
Tuesday for further clues on the timing of the next U.S. interest rate hike.
Gold prices were higher in European morning trade on Tuesday, adding to the prior session's gains amid
uncertainty over the outlook for U.S policy after President Donald Trump introduced immigration curbs that
sparked criticism at home and abroad.
Market sentiment was bruised after Trump suspended travel to the United States from Syria, Iraq, Iran and four
other Muslim-majority countries on Friday, saying the moves would help protect Americans from terrorist
attacks.
Oil prices gained during North American morning hours on Tuesday, reversing overnight losses as market
players looked ahead to weekly data from the U.S. on stockpiles of crude and refined products.
Oil prices were on track to end January with a loss of about 2% as sentiment has been torn between
expectations of a rebound in U.S. shale production and hopes that oversupply may be curbed by output cuts
announced by major global producers.
Aaj Ka Trend
01st Feb’17
4. Equities I Commodities I Currencies I Mutual FundsSEBI Registered - Research Analyst Equities I Commodities I Currencies I Mutual Funds
International Market
Commodity Closing Price
Gold 1209
Silver 17.09
Crude Oil 53.19
Brent Crude Oil 55.45
Natural Gas 3.20
COMEX/NYMEX/ICE ( Precious Metals & Energy) Currency & Commodity Index
Currency (Spot) Current Price
USD / INR 68.10
Dollar Index 100.77
EUR / USD 1.07
CRB Index* 194.01
Closing as on 31.01.17 *Closing as on 31.01.17
LME (Base Metals) ( $ per tones)
Commodity Closing Price
Copper 5748
Aluminum 1845
Zinc 2767
Lead 2309
Nickel 9700
SHFE (Base Metals) (Yuan per tones)
Commodity Closing Price
Copper 46560
Aluminum 13735
Zinc 22450
Lead 18340
Closing as on 31.01.17 Closing as on 31.01.17
LME INVENTORY DATA
Aaj Ka Trend
24-Jan-17 25-Jan-17 27-Jan-17 30-Jan-17 31-Jan-17
Aluminium -6600 -6600 -4150 -1175 -4875
Copper -4500 -4500 -5200 -1625 -825
Lead -650 -650 -1600 -2200 -1125
Nickel 4540 4540 -288 -708 1284
Zinc -2675 -2675 -2725 -2900 -3575
01st Feb’17
5. Equities I Commodities I Currencies I Mutual Funds
This is solely for information of clients of Choice Broking and does not construe to be an investment advice. It is also not intended as an offer or solicitation
for the purchase and sale of any financial instruments. Any action taken by you on the basis of the information contained herein is your responsibility alone
and Choice Broking its subsidiaries or its employees or associates will not be liable in any manner for the consequences of such action taken by you. We
have exercised due diligence in checking the correctness and authenticity of the information contained in this recommendation, but Choice Broking or any of
its subsidiaries or associates or employees shall not be in any way responsible for any loss or damage that may arise to any person from any inadvertent
error in the information contained in this recommendation or any action taken on basis of this information. Technical analysis studies market psychology,
price patterns and volume levels. It is used to forecast future price and market movements. Technical analysis is complementary to fundamental analysis
and news sources. The recommendations issued herewith might be contrary to recommendations issued by Choice Broking in the company research
undertaken as the recommendations stated in this report is derived purely from technical analysis. Choice Broking has based this document on information
obtained from sources it believes to be reliable but which it has not independently verified; Choice Broking makes no guarantee, representation or warranty
and accepts no responsibility or liability as to its accuracy or completeness. The opinions contained within the report are based upon publicly available
information at the time of publication and are subject to change without notice. The information and any disclosures provided herein are in summary form
and have been prepared for informational purposes. The recommendations and suggested price levels are intended purely for trading purposes. The
recommendations are valid for the day of the report however trading trends and volumes might vary substantially on an intraday basis and the
recommendations may be subject to change. The information and any disclosures provided herein may be considered confidential. Any use, distribution,
modification, copying, forwarding or disclosure by any person is strictly prohibited. The information and any disclosures provided herein do not constitute a
solicitation or offer to purchase or sell any security or other financial product or instrument. The current performance may be unaudited. Past performance
does not guarantee future returns. There can be no assurance that investments will achieve any targeted rates of return, and there is no guarantee against
the loss of your entire investment.
POTENTIAL CONFLICT OF INTEREST DISCLOSURE (as on date of report) Disclosure of interest statement – • Analyst interest of the stock
/Instrument(s): - No. • Firm interest of the stock / Instrument (s): - No.
Disclaimer
Contact Us
Amit Pathania
Research Associate
amit.pathania@choiceindia.com
www.choicebroking.incustomercare@choiceindia.com
SEBI Registered - Research Analyst Equities I Commodities I Currencies I Mutual Funds
Aaj Ka Trend
01st Feb’17
Neeraj Yadav
Research Advisor
neeraj.yadav@choiceindia.com
Anish Vyas
Senior Research Associate
anish.vyas@choiceindia.com
Kkunal Parar
Digitally signed by Kkunal Parar
DN: cn=Kkunal Parar, o=Choice Equity Broking
Pvt Ltd., ou=Research Dept.,
email=kkunal.parar@choiceindia.com, c=IN
Date: 2017.02.01 09:09:47 +05'30'