
Recommended
More Related Content
What's hot
What's hot (20)
Viewers also liked
Viewers also liked (12)
Similar to Aaj ka trend 26.12.16
Similar to Aaj ka trend 26.12.16 (20)
Recently uploaded
Recently uploaded (20)
Aaj ka trend 26.12.16
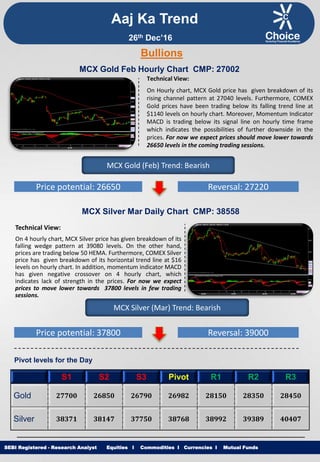
- 1. Equities I Commodities I Currencies I Mutual Funds Aaj Ka Trend Technical View: On Hourly chart, MCX Gold price has given breakdown of its rising channel pattern at 27040 levels. Furthermore, COMEX Gold prices have been trading below its falling trend line at $1140 levels on hourly chart. Moreover, Momentum Indicator MACD is trading below its signal line on hourly time frame which indicates the possibilities of further downside in the prices. For now we expect prices should move lower towards 26650 levels in the coming trading sessions. SEBI Registered - Research Analyst Equities I Commodities I Currencies I Mutual Funds Bullions MCX Gold Feb Hourly Chart CMP: 27002 MCX Gold (Feb) Trend: Bearish Price potential: 26650 Reversal: 27220 MCX Silver Mar Daily Chart CMP: 38558 Technical View: On 4 hourly chart, MCX Silver price has given breakdown of its falling wedge pattern at 39080 levels. On the other hand, prices are trading below 50 HEMA. Furthermore, COMEX Silver price has given breakdown of its horizontal trend line at $16 levels on hourly chart. In addition, momentum indicator MACD has given negative crossover on 4 hourly chart, which indicates lack of strength in the prices. For now we expect prices to move lower towards 37800 levels in few trading sessions. MCX Silver (Mar) Trend: Bearish Price potential: 37800 Reversal: 39000 Pivot levels for the Day S1 S2 S3 Pivot R1 R2 R3 Gold 27700 26850 26790 26982 28150 28350 28450 Silver 38371 38147 37750 38768 38992 39389 40407 26th Dec’16
- 2. Equities I Commodities I Currencies I Mutual Funds Technical View: MCX Copper price has shown breakdown of its descending triangle pattern at 383 levels on daily chart. Moreover, COMEX Copper prices are trading in falling channel pattern. In addition MCX Copper prices are trading below its 21 HEMA. Furthermore, momentum indicator MACD has shown negative crossover on daily time frame, which suggest further weakness in the momentum can be seen. For now we expect prices to move lower towards 364 levels in coming trading sessions. SEBI Registered - Research Analyst Equities I Commodities I Currencies I Mutual Funds MCX Copper Feb hourly Chart CMP: 372.95 MCX Copper (Feb) Trend: Bearish Price potential: 364 Reversal: 377.50 MCX Crude Oil Jan. Hourly Chart CMP: 3595 Technical View: MCX Crude Oil prices has been trading in rising wedge pattern and taking support of its lower band of wedge pattern at 3550 levels on hourly chart. MCX Crude Oil is trading above its 100 HEMA on hourly chart. On the other hand, NYMEX WTI Crude oil price has taken support of its rising trend line at $52.40 levels. Moreover, Momentum indicator RSI is trading above 50 levels on hourly chart which suggest the positive movement in the prices. For now we expect prices to move higher towards 3700 levels in coming trading sessions. MCX Crude Oil (Jan) Trend: Bullish Price potential: 3700 Reversal: 3535 Pivot levels for the Day S1 S2 S3 Pivot R1 R2 R3 Copper 371.1 369.2 366.0 374.3 376.2 379.4 387.8 Crude 3564 3532 3509 3587 3619 3642 3720 Base Metal Energy Aaj Ka Trend 26th Dec’16
- 3. Equities I Commodities I Currencies I Mutual FundsSEBI Registered - Research Analyst Equities I Commodities I Currencies I Mutual Funds Other Base Metals & Energy S1 S2 S3 Pivot R1 R2 R3 Trend Copper 371.1 369.2 366.0 374.3 376.2 379.4 387.8 Aluminum 117.4 117.0 116.8 117.6 118.0 118.2 119.1 Lead 136.5 134.4 130.4 140.5 142.7 146.7 156.8 Nickel 696.6 687.2 672.1 711.7 721.1 736.2 775.8 Zinc 172.3 170.8 168.2 174.9 176.4 179.0 185.7 Natural Gas 241.3 235.0 229.8 246.5 252.8 258.0 274.6 Fundamental News: The dollar held steady against the other majors currencies on Friday, after the release of positive U.S. data supported optimism over the strength of the U.S. economy. The U.S. Census Bureau said new home sales rose 5.2% to 592.000 units in November, beating expectations for a 2.1% increase to 575.000. In addition, the University of Michigan said its consumer sentiment index hit 98.2 this month, up from a previous estimate of 98.0. Analysts had expected the index to remain unchanged in December. The greenback has also remained broadly supported since the Federal Reserve concluded its policy meeting last week by raising interest rates by 25 basis points and projected three more rate hikes for 2017. Earlier Friday, the U.K. Office for National Statistics said gross domestic product grew at a rate of 0.6% in the third quarter, up from a previous estimate of 0.5% and above expectations for a growth rate of 0.5% U.S. natural gas futures rose to a two-week high on Thursday morning, after data showed that natural gas supplies in storage in the U.S. fell much more than the five-year average for this time of year last week. The U.S. Energy Information Administration said in its weekly report that natural gas storage in the U.S. declined by 209 billion cubic feet in the week ended December 16, exceeding market expectations for a drop of 201 billion cubic feet. Total natural gas in storage currently stands at 3.597 trillion cubic feet, according to the U.S. Energy Information Administration, 5.9% lower than levels at this time a year ago and 2.1% above the five-year average for this time of year. Aaj Ka Trend 26th Dec’16
- 4. Equities I Commodities I Currencies I Mutual FundsSEBI Registered - Research Analyst Equities I Commodities I Currencies I Mutual Funds International Market Commodity Closing Price Gold 1134 Silver 15.77 Crude Oil 53.23 Brent Crude Oil 55.08 Natural Gas 3.67 COMEX/NYMEX/ICE ( Precious Metals & Energy) Currency & Commodity Index Currency (Spot) Current Price USD / INR 67.84 Dollar Index 102.95 EUR / USD 1.04 CRB Index* 190.52 Closing as on 23.12.16 *Closing as on 23.12.16 LME (Base Metals) ( $ per tones) Commodity Closing Price Copper 5469 Aluminum 1719 Zinc 2577 Lead 2073 Nickel 10410 SHFE (Base Metals) (Yuan per tones) Commodity Closing Price Copper 44710 Aluminum 12665 Zinc 20880 Lead 18160 Closing as on 23.12.16 Closing as on 23.12.16 LME INVENTORY DATA Aaj Ka Trend 19-Dec-16 20-Dec-16 21-Dec-16 22-Dec-16 23-Dec-16 Aluminium -5224 -2826 25101 5025 10450 Copper 38399 -1451 -4400 -3825 -1275 Lead -549 215 25 11700 50 Nickel 115 -2300 95 95 -144 Zinc -1301 -574 -25 -175 -200 26th Dec’16
- 5. Equities I Commodities I Currencies I Mutual Funds This is solely for information of clients of Choice Broking and does not construe to be an investment advice. It is also not intended as an offer or solicitation for the purchase and sale of any financial instruments. Any action taken by you on the basis of the information contained herein is your responsibility alone and Choice Broking its subsidiaries or its employees or associates will not be liable in any manner for the consequences of such action taken by you. We have exercised due diligence in checking the correctness and authenticity of the information contained in this recommendation, but Choice Broking or any of its subsidiaries or associates or employees shall not be in any way responsible for any loss or damage that may arise to any person from any inadvertent error in the information contained in this recommendation or any action taken on basis of this information. Technical analysis studies market psychology, price patterns and volume levels. It is used to forecast future price and market movements. Technical analysis is complementary to fundamental analysis and news sources. The recommendations issued herewith might be contrary to recommendations issued by Choice Broking in the company research undertaken as the recommendations stated in this report is derived purely from technical analysis. Choice Broking has based this document on information obtained from sources it believes to be reliable but which it has not independently verified; Choice Broking makes no guarantee, representation or warranty and accepts no responsibility or liability as to its accuracy or completeness. The opinions contained within the report are based upon publicly available information at the time of publication and are subject to change without notice. The information and any disclosures provided herein are in summary form and have been prepared for informational purposes. The recommendations and suggested price levels are intended purely for trading purposes. The recommendations are valid for the day of the report however trading trends and volumes might vary substantially on an intraday basis and the recommendations may be subject to change. The information and any disclosures provided herein may be considered confidential. Any use, distribution, modification, copying, forwarding or disclosure by any person is strictly prohibited. The information and any disclosures provided herein do not constitute a solicitation or offer to purchase or sell any security or other financial product or instrument. The current performance may be unaudited. Past performance does not guarantee future returns. There can be no assurance that investments will achieve any targeted rates of return, and there is no guarantee against the loss of your entire investment. POTENTIAL CONFLICT OF INTEREST DISCLOSURE (as on date of report) Disclosure of interest statement – • Analyst interest of the stock /Instrument(s): - No. • Firm interest of the stock / Instrument (s): - No. Disclaimer Contact Us Amit Pathania Research Associate amit.pathania@choiceindia.com www.choicebroking.incustomercare@choiceindia.com SEBI Registered - Research Analyst Equities I Commodities I Currencies I Mutual Funds Aaj Ka Trend 26th Dec’16 Neeraj Yadav Research Advisor neeraj.yadav@choiceindia.com Anish Vyas Senior Research Associate anish.vyas@choiceindia.com Amit Pathania Digitally signed by Amit Pathania DN: cn=Amit Pathania, o=Choice Equity Broking Pvt. ltd, ou=Research Department, email=amit.pathania@choiceindia.com, c=IN Date: 2016.12.24 14:38:20 +05'30'