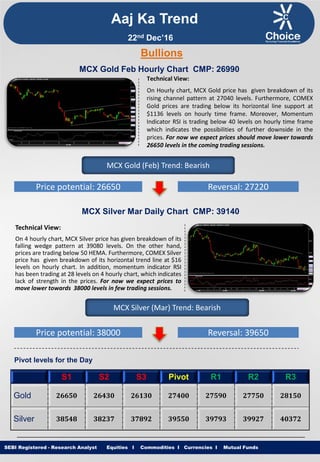
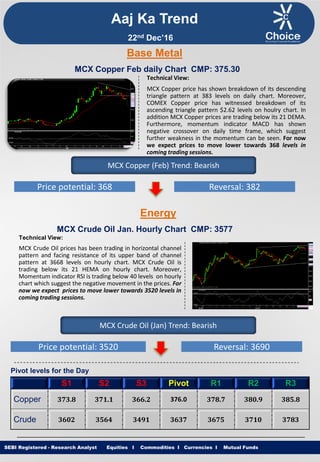
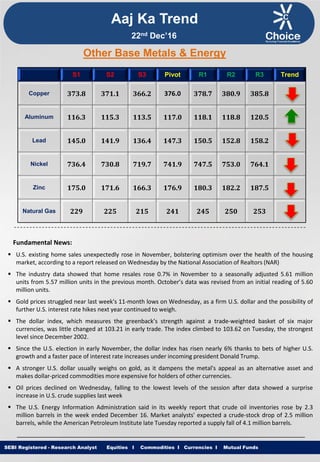
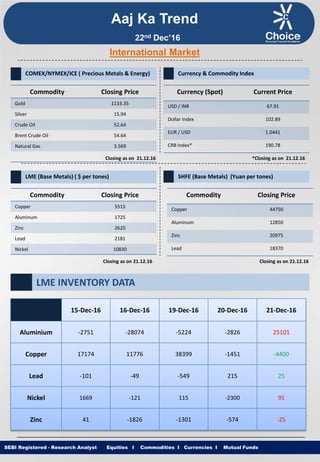
Top Rated Pune Call Girls Viman Nagar ⟟ 6297143586 ⟟ Call Me For Genuine Sex...
Aaj ka trend 22.12.16
1. Equities I Commodities I Currencies I Mutual Funds
Aaj Ka Trend
Technical View:
On Hourly chart, MCX Gold price has given breakdown of its
rising channel pattern at 27040 levels. Furthermore, COMEX
Gold prices are trading below its horizontal line support at
$1136 levels on hourly time frame. Moreover, Momentum
Indicator RSI is trading below 40 levels on hourly time frame
which indicates the possibilities of further downside in the
prices. For now we expect prices should move lower towards
26650 levels in the coming trading sessions.
SEBI Registered - Research Analyst Equities I Commodities I Currencies I Mutual Funds
Bullions
MCX Gold Feb Hourly Chart CMP: 26990
MCX Gold (Feb) Trend: Bearish
Price potential: 26650 Reversal: 27220
MCX Silver Mar Daily Chart CMP: 39140
Technical View:
On 4 hourly chart, MCX Silver price has given breakdown of its
falling wedge pattern at 39080 levels. On the other hand,
prices are trading below 50 HEMA. Furthermore, COMEX Silver
price has given breakdown of its horizontal trend line at $16
levels on hourly chart. In addition, momentum indicator RSI
has been trading at 28 levels on 4 hourly chart, which indicates
lack of strength in the prices. For now we expect prices to
move lower towards 38000 levels in few trading sessions.
MCX Silver (Mar) Trend: Bearish
Price potential: 38000 Reversal: 39650
Pivot levels for the Day
S1 S2 S3 Pivot R1 R2 R3
Gold 26650 26430 26130 27400 27590 27750 28150
Silver 38548 38237 37892 39550 39793 39927 40372
22nd Dec’16
2. Equities I Commodities I Currencies I Mutual Funds
Technical View:
MCX Copper price has shown breakdown of its descending
triangle pattern at 383 levels on daily chart. Moreover,
COMEX Copper price has witnessed breakdown of its
ascending triangle pattern $2.62 levels on houlry chart. In
addition MCX Copper prices are trading below its 21 DEMA.
Furthermore, momentum indicator MACD has shown
negative crossover on daily time frame, which suggest
further weakness in the momentum can be seen. For now
we expect prices to move lower towards 368 levels in
coming trading sessions.
SEBI Registered - Research Analyst Equities I Commodities I Currencies I Mutual Funds
MCX Copper Feb daily Chart CMP: 375.30
MCX Copper (Feb) Trend: Bearish
Price potential: 368 Reversal: 382
MCX Crude Oil Jan. Hourly Chart CMP: 3577
Technical View:
MCX Crude Oil prices has been trading in horizontal channel
pattern and facing resistance of its upper band of channel
pattern at 3668 levels on hourly chart. MCX Crude Oil is
trading below its 21 HEMA on hourly chart. Moreover,
Momentum indicator RSI is trading below 40 levels on hourly
chart which suggest the negative movement in the prices. For
now we expect prices to move lower towards 3520 levels in
coming trading sessions.
MCX Crude Oil (Jan) Trend: Bearish
Price potential: 3520 Reversal: 3690
Pivot levels for the Day
S1 S2 S3 Pivot R1 R2 R3
Copper 373.8 371.1 366.2 376.0 378.7 380.9 385.8
Crude 3602 3564 3491 3637 3675 3710 3783
Base Metal
Energy
Aaj Ka Trend
22nd Dec’16
3. Equities I Commodities I Currencies I Mutual FundsSEBI Registered - Research Analyst Equities I Commodities I Currencies I Mutual Funds
Other Base Metals & Energy
S1 S2 S3 Pivot R1 R2 R3 Trend
Copper 373.8 371.1 366.2 376.0 378.7 380.9 385.8
Aluminum 116.3 115.3 113.5 117.0 118.1 118.8 120.5
Lead 145.0 141.9 136.4 147.3 150.5 152.8 158.2
Nickel 736.4 730.8 719.7 741.9 747.5 753.0 764.1
Zinc 175.0 171.6 166.3 176.9 180.3 182.2 187.5
Natural Gas 229 225 215 241 245 250 253
Fundamental News:
U.S. existing home sales unexpectedly rose in November, bolstering optimism over the health of the housing
market, according to a report released on Wednesday by the National Association of Realtors (NAR)
The industry data showed that home resales rose 0.7% in November to a seasonally adjusted 5.61 million
units from 5.57 million units in the previous month. October’s data was revised from an initial reading of 5.60
million units.
Gold prices struggled near last week's 11-month lows on Wednesday, as a firm U.S. dollar and the possibility of
further U.S. interest rate hikes next year continued to weigh.
The dollar index, which measures the greenback’s strength against a trade-weighted basket of six major
currencies, was little changed at 103.21 in early trade. The index climbed to 103.62 on Tuesday, the strongest
level since December 2002.
Since the U.S. election in early November, the dollar index has risen nearly 6% thanks to bets of higher U.S.
growth and a faster pace of interest rate increases under incoming president Donald Trump.
A stronger U.S. dollar usually weighs on gold, as it dampens the metal's appeal as an alternative asset and
makes dollar-priced commodities more expensive for holders of other currencies.
Oil prices declined on Wednesday, falling to the lowest levels of the session after data showed a surprise
increase in U.S. crude supplies last week
The U.S. Energy Information Administration said in its weekly report that crude oil inventories rose by 2.3
million barrels in the week ended December 16. Market analysts' expected a crude-stock drop of 2.5 million
barrels, while the American Petroleum Institute late Tuesday reported a supply fall of 4.1 million barrels.
Aaj Ka Trend
22nd Dec’16
4. Equities I Commodities I Currencies I Mutual FundsSEBI Registered - Research Analyst Equities I Commodities I Currencies I Mutual Funds
International Market
Commodity Closing Price
Gold 1133.35
Silver 15.94
Crude Oil 52.64
Brent Crude Oil 54.64
Natural Gas 3.569
COMEX/NYMEX/ICE ( Precious Metals & Energy) Currency & Commodity Index
Currency (Spot) Current Price
USD / INR 67.91
Dollar Index 102.89
EUR / USD 1.0441
CRB Index* 190.78
Closing as on 21.12.16 *Closing as on 21.12.16
LME (Base Metals) ( $ per tones)
Commodity Closing Price
Copper 5515
Aluminum 1725
Zinc 2620
Lead 2181
Nickel 10830
SHFE (Base Metals) (Yuan per tones)
Commodity Closing Price
Copper 44750
Aluminum 12850
Zinc 20975
Lead 18370
Closing as on 21.12.16 Closing as on 21.12.16
LME INVENTORY DATA
Aaj Ka Trend
15-Dec-16 16-Dec-16 19-Dec-16 20-Dec-16 21-Dec-16
Aluminium -2751 -28074 -5224 -2826 25101
Copper 17174 11776 38399 -1451 -4400
Lead -101 -49 -549 215 25
Nickel 1669 -121 115 -2300 95
Zinc 41 -1826 -1301 -574 -25
22nd Dec’16
5. Equities I Commodities I Currencies I Mutual Funds
This is solely for information of clients of Choice Broking and does not construe to be an investment advice. It is also not intended as an offer or solicitation
for the purchase and sale of any financial instruments. Any action taken by you on the basis of the information contained herein is your responsibility alone
and Choice Broking its subsidiaries or its employees or associates will not be liable in any manner for the consequences of such action taken by you. We
have exercised due diligence in checking the correctness and authenticity of the information contained in this recommendation, but Choice Broking or any of
its subsidiaries or associates or employees shall not be in any way responsible for any loss or damage that may arise to any person from any inadvertent
error in the information contained in this recommendation or any action taken on basis of this information. Technical analysis studies market psychology,
price patterns and volume levels. It is used to forecast future price and market movements. Technical analysis is complementary to fundamental analysis
and news sources. The recommendations issued herewith might be contrary to recommendations issued by Choice Broking in the company research
undertaken as the recommendations stated in this report is derived purely from technical analysis. Choice Broking has based this document on information
obtained from sources it believes to be reliable but which it has not independently verified; Choice Broking makes no guarantee, representation or warranty
and accepts no responsibility or liability as to its accuracy or completeness. The opinions contained within the report are based upon publicly available
information at the time of publication and are subject to change without notice. The information and any disclosures provided herein are in summary form
and have been prepared for informational purposes. The recommendations and suggested price levels are intended purely for trading purposes. The
recommendations are valid for the day of the report however trading trends and volumes might vary substantially on an intraday basis and the
recommendations may be subject to change. The information and any disclosures provided herein may be considered confidential. Any use, distribution,
modification, copying, forwarding or disclosure by any person is strictly prohibited. The information and any disclosures provided herein do not constitute a
solicitation or offer to purchase or sell any security or other financial product or instrument. The current performance may be unaudited. Past performance
does not guarantee future returns. There can be no assurance that investments will achieve any targeted rates of return, and there is no guarantee against
the loss of your entire investment.
POTENTIAL CONFLICT OF INTEREST DISCLOSURE (as on date of report) Disclosure of interest statement – • Analyst interest of the stock
/Instrument(s): - No. • Firm interest of the stock / Instrument (s): - No.
Disclaimer
Contact Us
Amit Pathania
Research Associate
amit.pathania@choiceindia.com
www.choicebroking.incustomercare@choiceindia.com
SEBI Registered - Research Analyst Equities I Commodities I Currencies I Mutual Funds
Aaj Ka Trend
22nd Dec’16
Neeraj Yadav
Research Advisor
neeraj.yadav@choiceindia.com
Anish Vyas
Senior Research Associate
anish.vyas@choiceindia.com
Anish Vyas
Digitally signed by Anish Vyas
DN: cn=Anish Vyas, o=Choice Merchandise
Broking Pvt. Ltd, ou=Sr. Research Associate,
email=anish.vyas@choiceindia.com, c=IN
Date: 2016.12.22 09:34:34 +05'30'