
Recommended
More Related Content
What's hot
What's hot (20)
Viewers also liked
Viewers also liked (16)
Similar to Aaj ka trend 06.02.17
Similar to Aaj ka trend 06.02.17 (20)
Recently uploaded
Recently uploaded (20)
Aaj ka trend 06.02.17
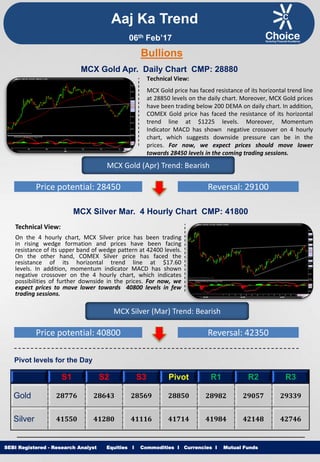
- 1. Equities I Commodities I Currencies I Mutual Funds Aaj Ka Trend Technical View: MCX Gold price has faced resistance of its horizontal trend line at 28850 levels on the daily chart. Moreover, MCX Gold prices have been trading below 200 DEMA on daily chart. In addition, COMEX Gold price has faced the resistance of its horizontal trend line at $1225 levels. Moreover, Momentum Indicator MACD has shown negative crossover on 4 hourly chart, which suggests downside pressure can be in the prices. For now, we expect prices should move lower towards 28450 levels in the coming trading sessions. SEBI Registered - Research Analyst Equities I Commodities I Currencies I Mutual Funds Bullions MCX Gold Apr. Daily Chart CMP: 28880 MCX Gold (Apr) Trend: Bearish Price potential: 28450 Reversal: 29100 MCX Silver Mar. 4 Hourly Chart CMP: 41800 Technical View: On the 4 hourly chart, MCX Silver price has been trading in rising wedge formation and prices have been facing resistance of its upper band of wedge pattern at 42400 levels. On the other hand, COMEX Silver price has faced the resistance of its horizontal trend line at $17.60 levels. In addition, momentum indicator MACD has shown negative crossover on the 4 hourly chart, which indicates possibilities of further downside in the prices. For now, we expect prices to move lower towards 40800 levels in few trading sessions. MCX Silver (Mar) Trend: Bearish Price potential: 40800 Reversal: 42350 Pivot levels for the Day S1 S2 S3 Pivot R1 R2 R3 Gold 28776 28643 28569 28850 28982 29057 29339 Silver 41550 41280 41116 41714 41984 42148 42746 06th Feb’17
- 2. Equities I Commodities I Currencies I Mutual Funds Technical View: MCX Copper price has shown the breakdown of its rising trend line at 396 levels on 4 hourly chart and price have retested its breakdown trend line at 395 levels. On hourly chart, MCX Copper prices have been trading below its 100 HEMA. Furthermore, momentum indicator MACD has shown negative crossover on 4 hourly time frame, which suggest further downside momentum can be seen in the prices. For now, we expect prices to move lower towards 378 levels in coming trading sessions. SEBI Registered - Research Analyst Equities I Commodities I Currencies I Mutual Funds MCX Copper Feb. 4 Hourly Chart CMP: 389 MCX Copper (Feb) Trend: Bearish Price potential: 378 Reversal: 395 MCX Crude Oil Feb. Hourly Chart CMP: 3610 Technical View: MCX Crude Oil prices have been hovering around its falling trend line at 3650 levels on hourly chart. NYMEX Crude Oil prices have given the breakdown of its rising trend line at $54 levels on hourly chart. On hourly chart, MCX Copper prices have been trading below its 21 HEMA. MCX Crude Oil has faced the resistance of its horizontal trend line at 3680 levels. Moreover, Momentum indicator RSI has remained below 60 levels on hourly chart which suggests negative movement in the prices. For now, we expect prices to move lower towards 3500 levels in coming trading sessions. MCX Crude Oil (Feb) Trend: Bearish Price potential: 3500 Reversal: 3670 Pivot levels for the Day S1 S2 S3 Pivot R1 R2 R3 Copper 385.1 382.1 376.7 391 393 399 413 Crude 3586 3561 3531 3616 3641 3671 3755 Base Metal Energy Aaj Ka Trend 06th Feb’17
- 3. Equities I Commodities I Currencies I Mutual FundsSEBI Registered - Research Analyst Equities I Commodities I Currencies I Mutual Funds Other Base Metals & Energy S1 S2 S3 Pivot R1 R2 R3 Trend Copper 385.1 382.1 376.7 391 393 399 413 Aluminum 121.8 121.3 120.8 122.3 122.8 123.3 124.8 Lead 154.2 152.4 151.2 155.4 157.2 158.4 162.7 Nickel 681.7 674.5 667.8 688.4 695.6 702.3 722.8 Zinc 184.9 183.2 180.6 187.5 189.2 191.8 198.7 Natural Gas 202.7 199.2 193.2 208.7 212.2 218.2 233.7 Fundamental News: Gold prices moved lower on Friday, as the U.S. dollar recovered from the previous session’s share losses, but the precious metal remained within close distance of a two-and-a-half month peak amid ongoing U.S. political uncertainty and ahead of a key U.S. jobs report. The U.S. dollar index, which measures the greenback’s strength against a trade-weighted basket of six major currencies, was steady at 99.88, off Thursday’s two-and-a-half month trough of 99.19. Non-farm payrolls (NFP) rose 227,000 in the first month of 2017, compared to the rise of 157,000 in December that was revised from the initial reading of 156,000. The data beat the consensus estimate for the creation of 175,000 jobs. Average hourly earnings rose month-on-month by 0.1%, compared to the prior increase of 0.2%, which was revised from 0.4% advance. Analysts had expected a gain of 0.3%. Oil was higher Friday as geopolitical tensions grew between the U.S. and Iran. Brent crude was up 17 cents, or 0.30%, at $56.73 at 08:15 ET. U.S. crude added 12 cents, or 0.22%, to $53.66. The U.S. could impose fresh sanctions on Iran after Tehran tested a ballistic missile. The market was underpinned by upbeat remarks by Russia on compliance with output cuts. OPEC and non-OPEC producers plan to cut output by some 1.8 million barrels a day in the first half of this year. Government payrolls decreased by 10,000 last month, compared to the destruction of 8,000 public jobs that occurred in December, revised from an initial gain of 12,000 positions. The increase in wages is being closely monitored by the Federal Reserve for evidence of diminishing slack in the labor market and upward pressure on inflation. Aaj Ka Trend 06th Feb’17
- 4. Equities I Commodities I Currencies I Mutual FundsSEBI Registered - Research Analyst Equities I Commodities I Currencies I Mutual Funds International Market Commodity Closing Price Gold 1221.85 Silver 17.51 Crude Oil 53.86 Brent Crude Oil 56.80 Natural Gas 3.05 COMEX/NYMEX/ICE ( Precious Metals & Energy) Currency & Commodity Index Currency (Spot) Current Price USD / INR 67.15 Dollar Index 99.69 EUR / USD 1.07 CRB Index* 193.21 Closing as on 03.01.17 *Closing as on 03.01.17 LME (Base Metals) ( $ per tones) Commodity Closing Price Copper 5748 Aluminum 1827 Zinc 2769 Lead 2319 Nickel 10178 SHFE (Base Metals) (Yuan per tones) Commodity Closing Price Copper 46350 Aluminum 13540 Zinc 22250 Lead 18210 Closing as on 03.01.17 Closing as on 03.01.17 LME INVENTORY DATA Aaj Ka Trend 30-Jan-17 31-Jan-17 01-Feb-17 02-Feb-17 03-Feb-17 Aluminium -1175 -4875 1025 -6875 -7024 Copper -1625 -825 -475 -1350 -2351 Lead -2200 -1125 -400 325 -152 Nickel -708 1284 330 -522 -149 Zinc -2900 -3575 1625 -1625 -1826 06th Feb’17
- 5. Equities I Commodities I Currencies I Mutual Funds This is solely for information of clients of Choice Broking and does not construe to be an investment advice. It is also not intended as an offer or solicitation for the purchase and sale of any financial instruments. Any action taken by you on the basis of the information contained herein is your responsibility alone and Choice Broking its subsidiaries or its employees or associates will not be liable in any manner for the consequences of such action taken by you. We have exercised due diligence in checking the correctness and authenticity of the information contained in this recommendation, but Choice Broking or any of its subsidiaries or associates or employees shall not be in any way responsible for any loss or damage that may arise to any person from any inadvertent error in the information contained in this recommendation or any action taken on basis of this information. Technical analysis studies market psychology, price patterns and volume levels. It is used to forecast future price and market movements. Technical analysis is complementary to fundamental analysis and news sources. The recommendations issued herewith might be contrary to recommendations issued by Choice Broking in the company research undertaken as the recommendations stated in this report is derived purely from technical analysis. Choice Broking has based this document on information obtained from sources it believes to be reliable but which it has not independently verified; Choice Broking makes no guarantee, representation or warranty and accepts no responsibility or liability as to its accuracy or completeness. The opinions contained within the report are based upon publicly available information at the time of publication and are subject to change without notice. The information and any disclosures provided herein are in summary form and have been prepared for informational purposes. The recommendations and suggested price levels are intended purely for trading purposes. The recommendations are valid for the day of the report however trading trends and volumes might vary substantially on an intraday basis and the recommendations may be subject to change. The information and any disclosures provided herein may be considered confidential. Any use, distribution, modification, copying, forwarding or disclosure by any person is strictly prohibited. The information and any disclosures provided herein do not constitute a solicitation or offer to purchase or sell any security or other financial product or instrument. The current performance may be unaudited. Past performance does not guarantee future returns. There can be no assurance that investments will achieve any targeted rates of return, and there is no guarantee against the loss of your entire investment. POTENTIAL CONFLICT OF INTEREST DISCLOSURE (as on date of report) Disclosure of interest statement – • Analyst interest of the stock /Instrument(s): - No. • Firm interest of the stock / Instrument (s): - No. Disclaimer Contact Us Amit Pathania Research Associate amit.pathania@choiceindia.com www.choicebroking.incustomercare@choiceindia.com SEBI Registered - Research Analyst Equities I Commodities I Currencies I Mutual Funds Aaj Ka Trend 06th Feb’17 Neeraj Yadav Research Advisor neeraj.yadav@choiceindia.com Anish Vyas Senior Research Associate anish.vyas@choiceindia.com