Download to read offline
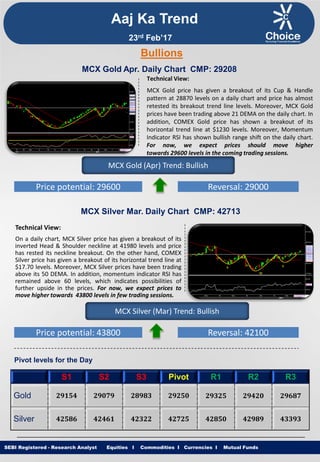
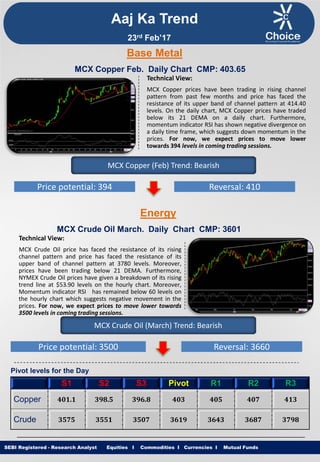
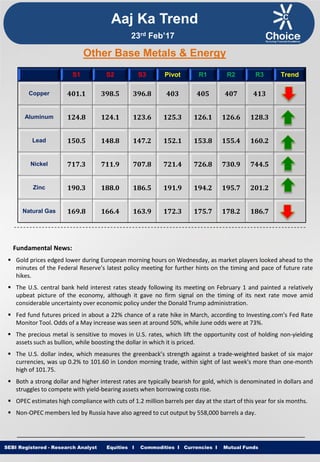
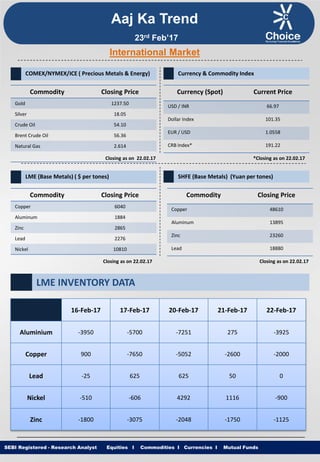

The document provides a technical analysis of commodity markets. It summarizes that MCX gold and silver prices have broken out of patterns and momentum indicators suggest further upside potential. MCX copper and crude oil are expected to fall as they have faced resistance and momentum indicators are negative. Pivot levels are provided for the day's trading. Fundamental news includes that gold prices edged lower on expectations of future US rate hikes from Fed minutes. OPEC estimates high compliance with output cuts. International commodity and currency closing prices are also listed.