
Recommended
More Related Content
What's hot
What's hot (20)
Viewers also liked
Viewers also liked (17)
Similar to Technical Analysis of Gold, Silver and Base Metals
Similar to Technical Analysis of Gold, Silver and Base Metals (20)
Recently uploaded
Recently uploaded (20)
Technical Analysis of Gold, Silver and Base Metals
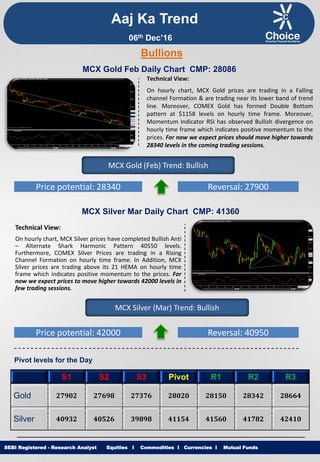
- 1. Equities I Commodities I Currencies I Mutual Funds Aaj Ka Trend Technical View: On hourly chart, MCX Gold prices are trading in a Falling channel Formation & are trading near its lower band of trend line. Moreover, COMEX Gold has formed Double Bottom pattern at $1158 levels on hourly time frame. Moreover, Momentum Indicator RSI has observed Bullish divergence on hourly time frame which indicates positive momentum to the prices. For now we expect prices should move higher towards 28340 levels in the coming trading sessions. SEBI Registered - Research Analyst Equities I Commodities I Currencies I Mutual Funds Bullions MCX Gold Feb Daily Chart CMP: 28086 MCX Gold (Feb) Trend: Bullish Price potential: 28340 Reversal: 27900 MCX Silver Mar Daily Chart CMP: 41360 Technical View: On hourly chart, MCX Silver prices have completed Bullish Anti – Alternate Shark Harmonic Pattern 40550 levels. Furthermore, COMEX Silver Prices are trading in a Rising Channel Formation on hourly time frame. In Addition, MCX Silver prices are trading above its 21 HEMA on hourly time frame which indicates positive momentum to the prices. For now we expect prices to move higher towards 42000 levels in few trading sessions. MCX Silver (Mar) Trend: Bullish Price potential: 42000 Reversal: 40950 Pivot levels for the Day S1 S2 S3 Pivot R1 R2 R3 Gold 27902 27698 27376 28020 28150 28342 28664 Silver 40932 40526 39898 41154 41560 41782 42410 06th Dec’16
- 2. Equities I Commodities I Currencies I Mutual Funds Technical View: On hourly chart, MCX Copper price have witnessed breakout of its Triangle Pattern at 406.50 levels. Moreover, COMEX Copper prices has witnessed breakout of its Ascending triangle pattern at $2.69 levels on hourly chart. In addition MCX Copper prices are trading above its 21 HEMA. Furthermore, momentum indicator RSI is trading above 60 levels on hourly time frame. For now we expect prices to move higher towards 418 levels in coming trading sessions. SEBI Registered - Research Analyst Equities I Commodities I Currencies I Mutual Funds MCX Copper Feb Daily Chart CMP: 406.35 MCX Copper (Feb) Trend: Bullish Price potential: 418 Reversal: 401 MCX Crude Oil Dec. Daily Chart CMP: 3536 Technical View: MCX Crude Oil prices have witnessed breakout of its Channel pattern at 3554 in hourly time frame and is trading above its trend line support. MCX Crude Oil is trading above its 50 HEMA on hourly chart. Moreover, Momentum indicator RSI is trading above 50 levels on hourly chart which suggest the positive movement in the prices. For now we expect prices to move higher 3620 towards levels in coming trading sessions. MCX Crude Oil (Dec) Trend: Bullish Price potential: 3620 Reversal: 3480 Pivot levels for the Day S1 S2 S3 Pivot R1 R2 R3 Copper 394.3 391.8 382.1 401.5 404.0 411.2 420.9 Crude 3464 3427 3333 3521 3558 3615 3709 Base Metal Energy Aaj Ka Trend 06th Dec’16
- 3. Equities I Commodities I Currencies I Mutual FundsSEBI Registered - Research Analyst Equities I Commodities I Currencies I Mutual Funds Other Base Metals & Energy S1 S2 S3 Pivot R1 R2 R3 Trend Copper 394.3 391.8 382.1 401.5 404.0 411.2 420.9 Aluminum 116.6 116.3 115.2 117.4 117.7 118.5 119.6 Lead 153.0 152.4 149.4 155.5 156.0 158.5 161.6 Nickel 777.7 773.8 758.5 789.1 793.0 804.4 819.7 Zinc 183.1 182.0 178.9 185.1 186.2 188.2 191.3 Natural Gas 231.1 228.5 217.8 239.2 241.8 249.9 260.6 Fundamental News: Gold prices held mostly steady in Asia on Monday as investors reacted cautiously to a new round of political turmoil in Italy and potentially the euro zone following a resounding "No" vote on a referendum aimed at political reforms. Gold prices fell almost 1% on Monday as demand for the dollar continued to remain underpinned after Friday’s solid U.S. employment report cemented expectations for a December rate hike by the Federal Reserve. The outlook for gold looks grim on the charts as a Fed December rate hike looms. Iraq's semi-autonomous region of Kurdistan said on Monday it saw no major impact on its crude oil production from OPEC's output cuts, agreed last week, adding it was ready to cooperate with Baghdad. Iran's oil minister Bijan Namdar Zanganeh will attend the meeting between OPEC and non-OPEC members on Dec 10 in Vienna, the ministry's news agency SHANA said on Monday, as the countries try to finalize a global oil output-limiting pact. Brent crude oil prices rose above $55 a barrel on Monday, trading at a fresh 16-month high, on rising prospects of a tightening market after OPEC members agreed on a landmark deal to cut production last week. Oil recovered from early losses to trade higher Monday ahead of the implementation of OPEC's agreement to cut output. The Organization of the Petroleum Exporting Countries expects oil demand in 2017 to be as robust as this year, the group's secretary general told an energy conference on Monday, though recently agreed production cuts could raise prices for buyers. Aaj Ka Trend 06th Dec’16
- 4. Equities I Commodities I Currencies I Mutual FundsSEBI Registered - Research Analyst Equities I Commodities I Currencies I Mutual Funds International Market Commodity Closing Price Gold 1175 Silver 16.90 Crude Oil 51.29 Brent Crude Oil 54.52 Natural Gas 3.61 COMEX/NYMEX/ICE ( Precious Metals & Energy) Currency & Commodity Index Currency (Spot) Current Price USD / INR 68.09 Dollar Index 100.11 EUR / USD 1.07 CRB Index* 193.47 Closing as on 05.12.16 *Closing as on 05.12.16 LME (Base Metals) ( $ per tones) Commodity Closing Price Copper 5902 Aluminum 1721 Zinc 2755 Lead 2308 Nickel 11478 SHFE (Base Metals) (Yuan per tones) Commodity Closing Price Copper 46980 Aluminum 13600 Zinc 22565 Lead 20900 Closing as on 05.12.16 Closing as on 05.12.16 LME INVENTORY DATA Aaj Ka Trend 29-Nov-16 30-Nov-16 01-Dec-16 02-Dec-16 05-Dec-16 Aluminium -3226 -5901 -4301 -5574 -10074 Copper 1224 -648 1848 -2650 -1001 Lead 0 -101 -101 -498 -49 Nickel 44 -218 175 -182 1896 Zinc -175 -249 -402 -502 -124 06th Dec’16
- 5. Equities I Commodities I Currencies I Mutual Funds This is solely for information of clients of Choice Broking and does not construe to be an investment advice. It is also not intended as an offer or solicitation for the purchase and sale of any financial instruments. Any action taken by you on the basis of the information contained herein is your responsibility alone and Choice Broking its subsidiaries or its employees or associates will not be liable in any manner for the consequences of such action taken by you. We have exercised due diligence in checking the correctness and authenticity of the information contained in this recommendation, but Choice Broking or any of its subsidiaries or associates or employees shall not be in any way responsible for any loss or damage that may arise to any person from any inadvertent error in the information contained in this recommendation or any action taken on basis of this information. Technical analysis studies market psychology, price patterns and volume levels. It is used to forecast future price and market movements. Technical analysis is complementary to fundamental analysis and news sources. The recommendations issued herewith might be contrary to recommendations issued by Choice Broking in the company research undertaken as the recommendations stated in this report is derived purely from technical analysis. Choice Broking has based this document on information obtained from sources it believes to be reliable but which it has not independently verified; Choice Broking makes no guarantee, representation or warranty and accepts no responsibility or liability as to its accuracy or completeness. The opinions contained within the report are based upon publicly available information at the time of publication and are subject to change without notice. The information and any disclosures provided herein are in summary form and have been prepared for informational purposes. The recommendations and suggested price levels are intended purely for trading purposes. The recommendations are valid for the day of the report however trading trends and volumes might vary substantially on an intraday basis and the recommendations may be subject to change. The information and any disclosures provided herein may be considered confidential. Any use, distribution, modification, copying, forwarding or disclosure by any person is strictly prohibited. The information and any disclosures provided herein do not constitute a solicitation or offer to purchase or sell any security or other financial product or instrument. The current performance may be unaudited. Past performance does not guarantee future returns. There can be no assurance that investments will achieve any targeted rates of return, and there is no guarantee against the loss of your entire investment. POTENTIAL CONFLICT OF INTEREST DISCLOSURE (as on date of report) Disclosure of interest statement – • Analyst interest of the stock /Instrument(s): - No. • Firm interest of the stock / Instrument (s): - No. Disclaimer Contact Us Amit Pathania Research Associate amit.pathania@choiceindia.com Rohan Patil Research Associate rohan.patil@choiceindia.com www.choicebroking.incustomercare@choiceindia.com SEBI Registered - Research Analyst Equities I Commodities I Currencies I Mutual Funds Aaj Ka Trend 06th Dec’16 Neeraj Yadav Research Advisor neeraj.yadav@choiceindia.com Anish Vyas Senior Research Associate anish.vyas@choiceindia.com Amit Pathania Digitally signed by Amit Pathania DN: cn=Amit Pathania, o=Choice Equity Broking Pvt. ltd, ou=Research Department, email=amit.pathania@choiceindia.com, c=IN Date: 2016.12.06 08:17:41 +05'30'