Downloaded 157 times
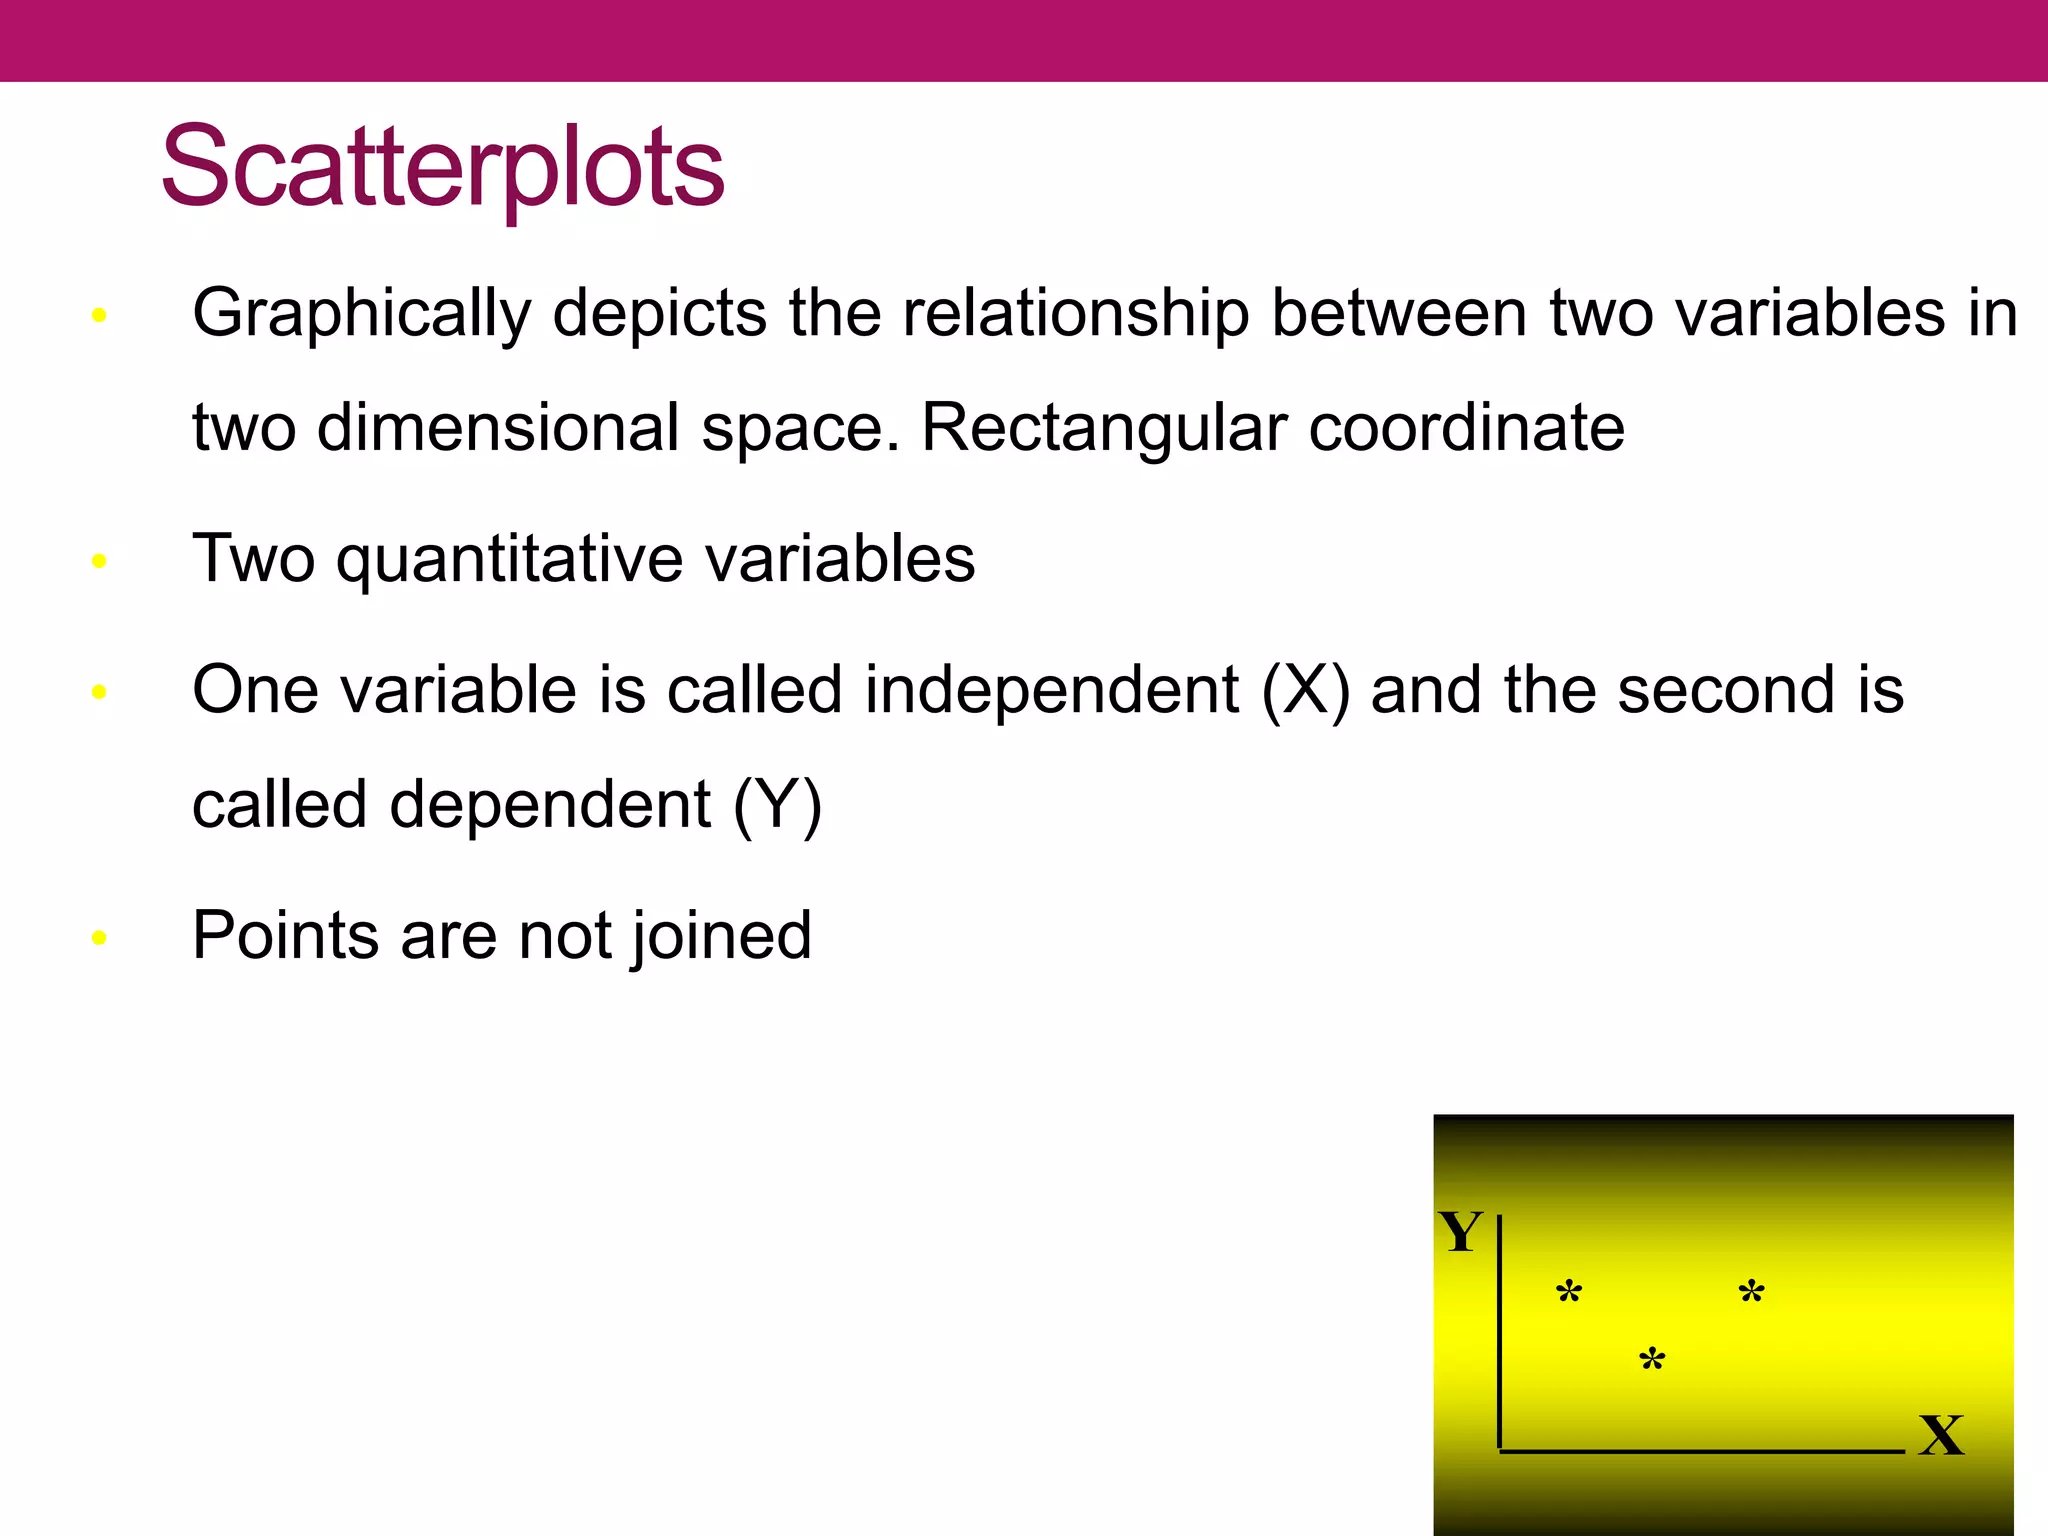
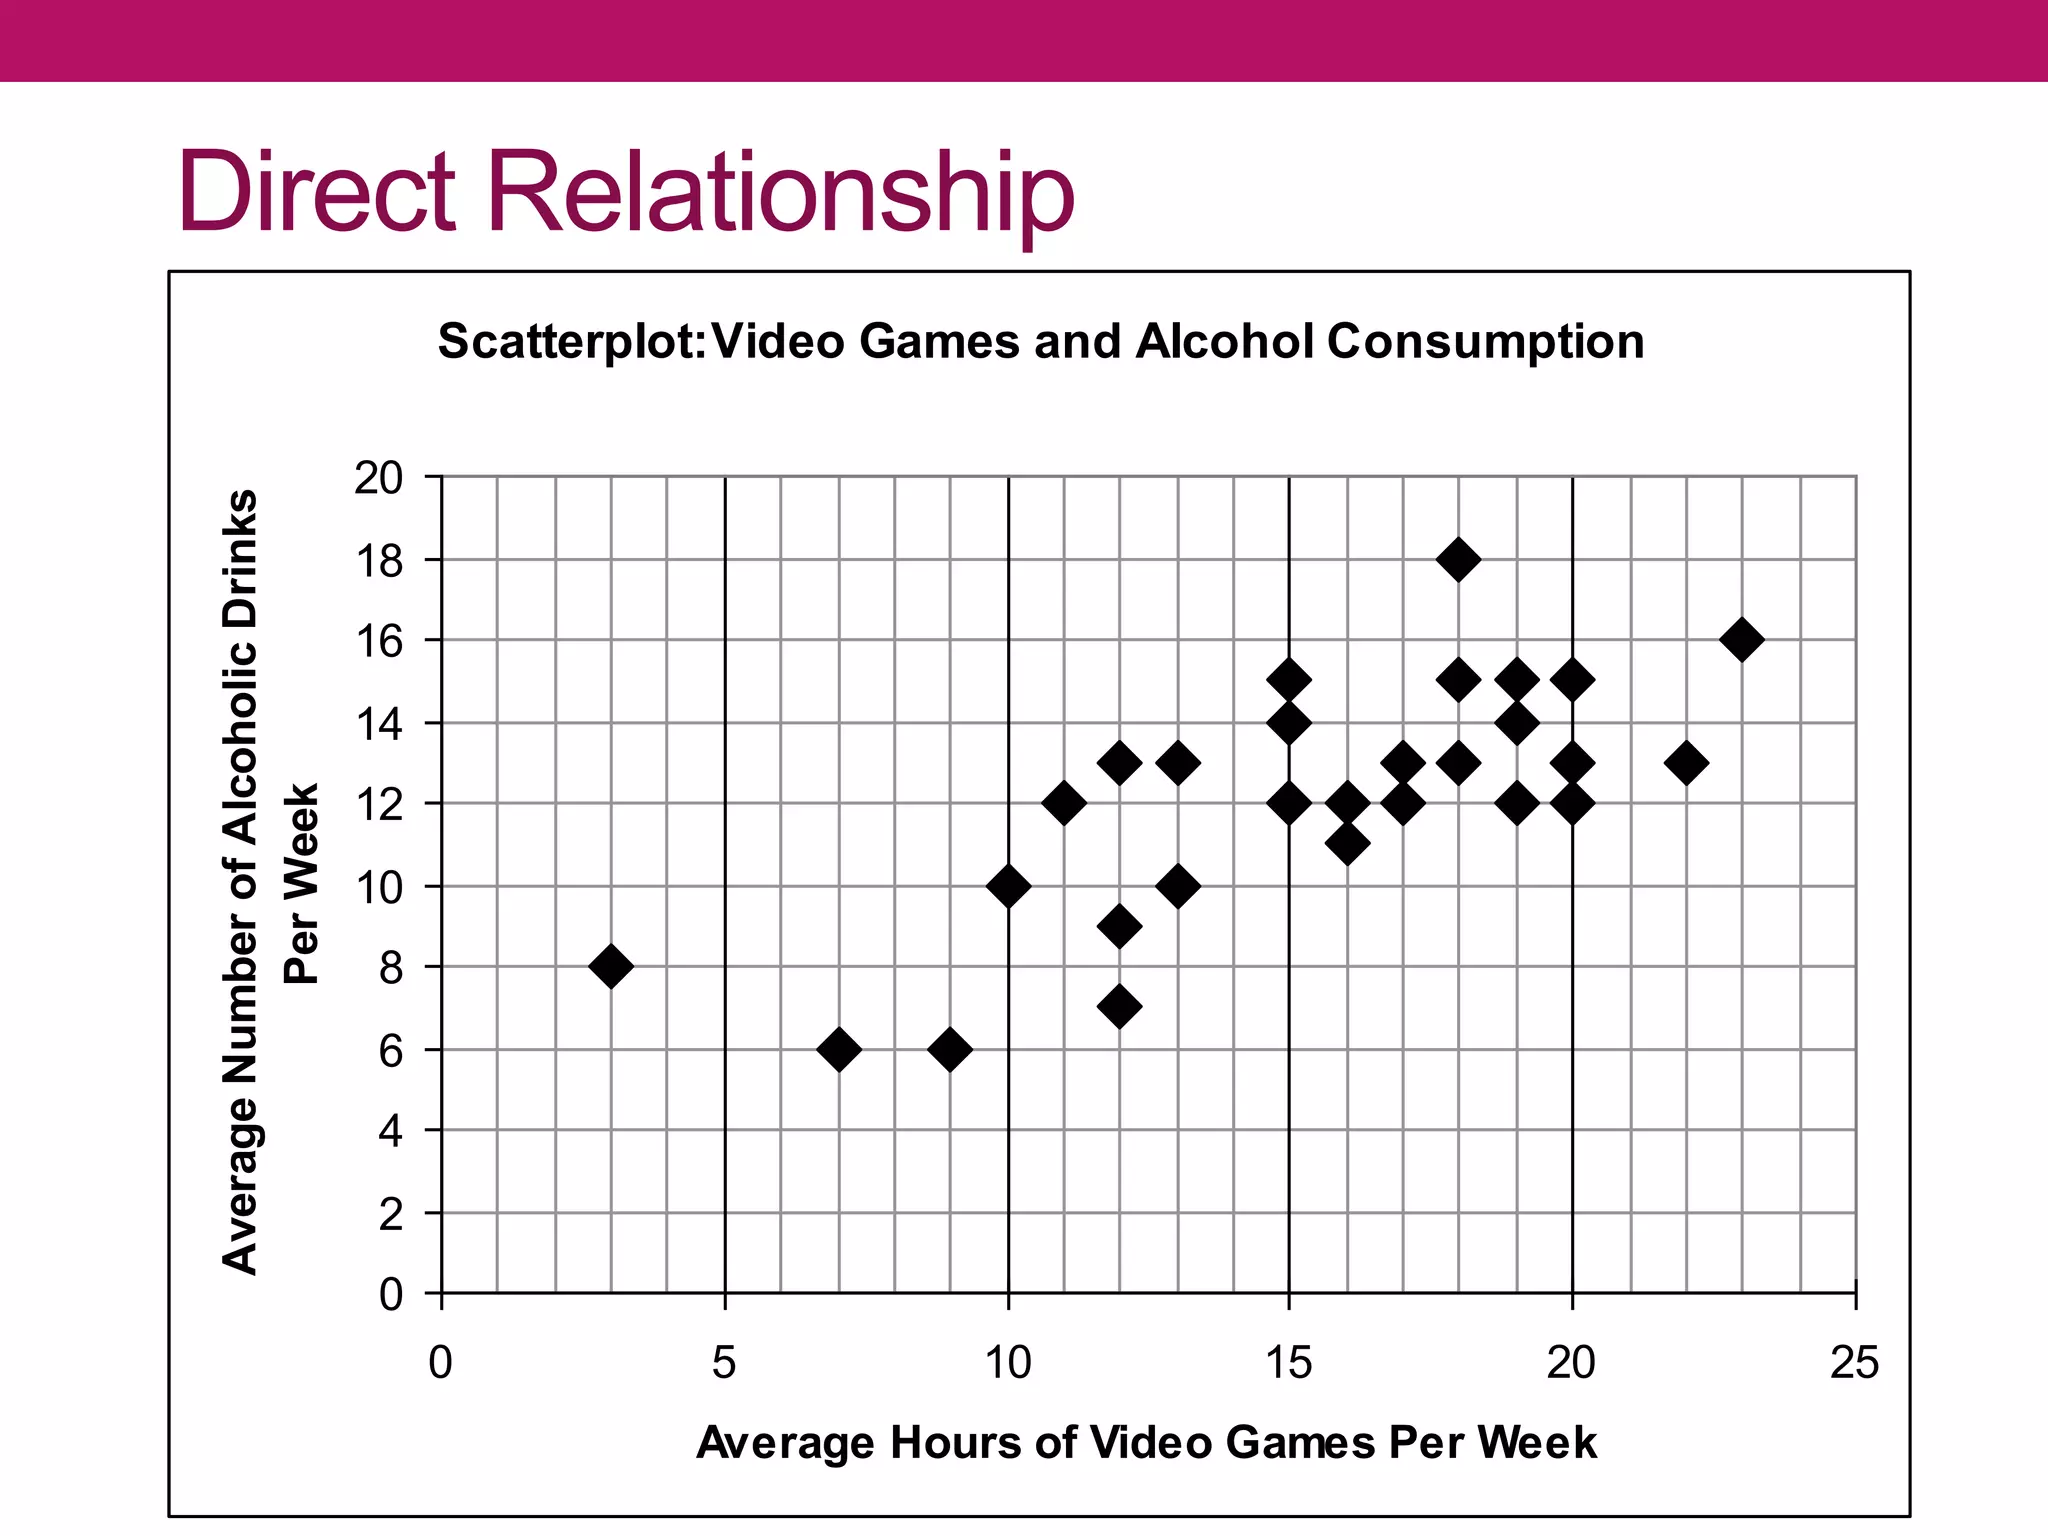
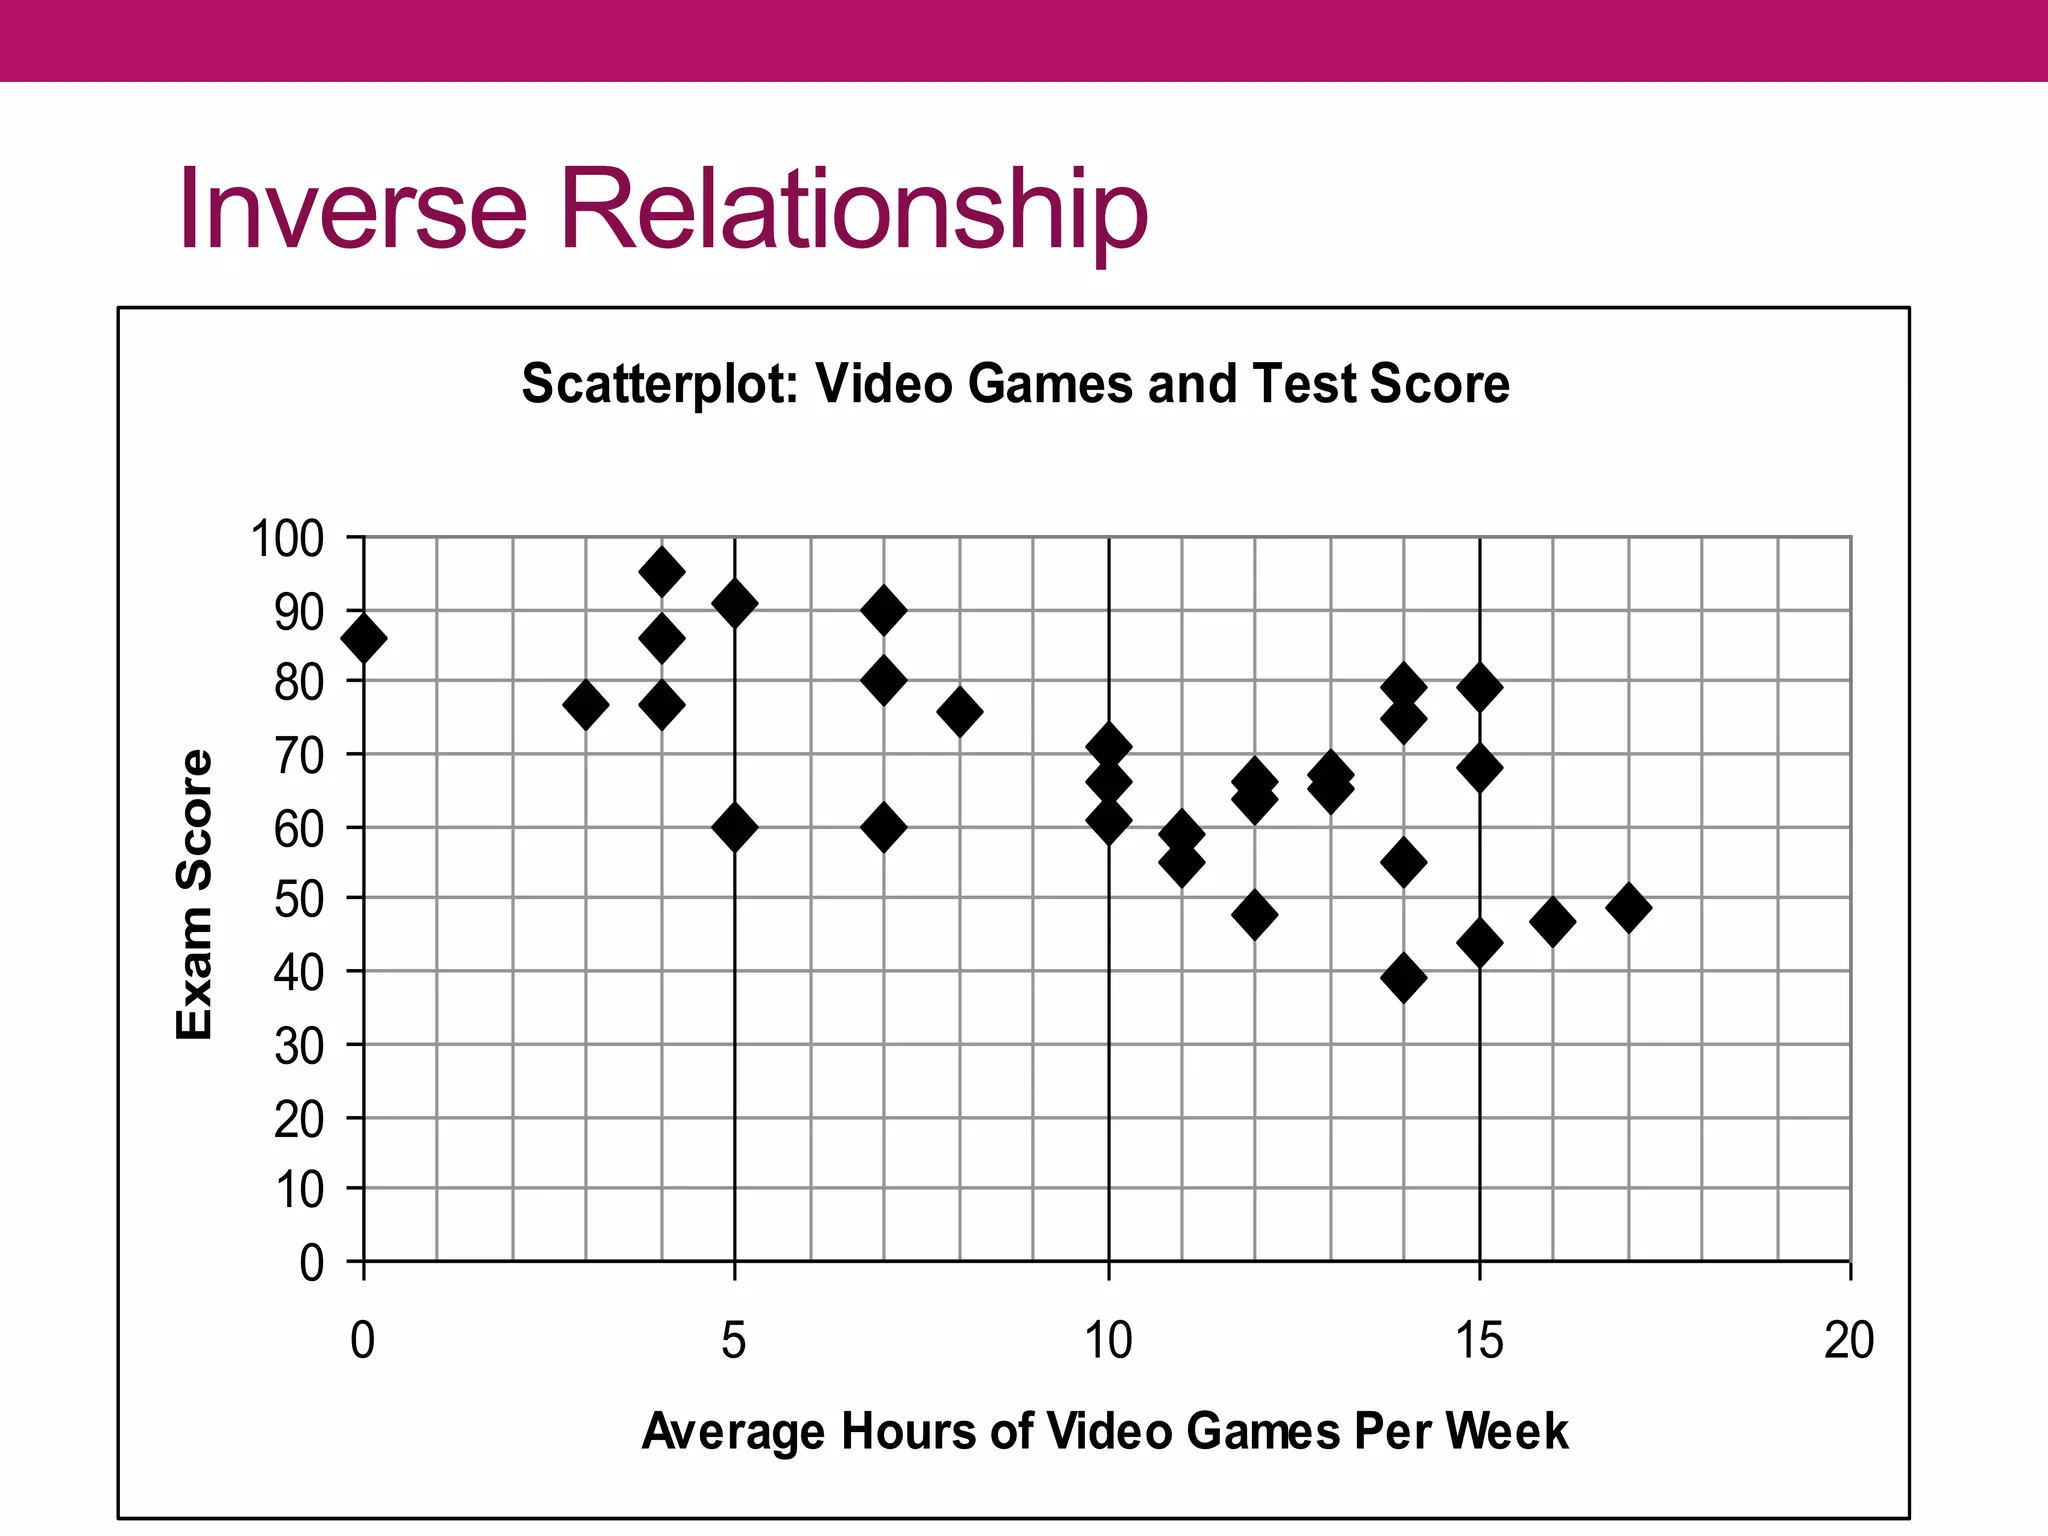
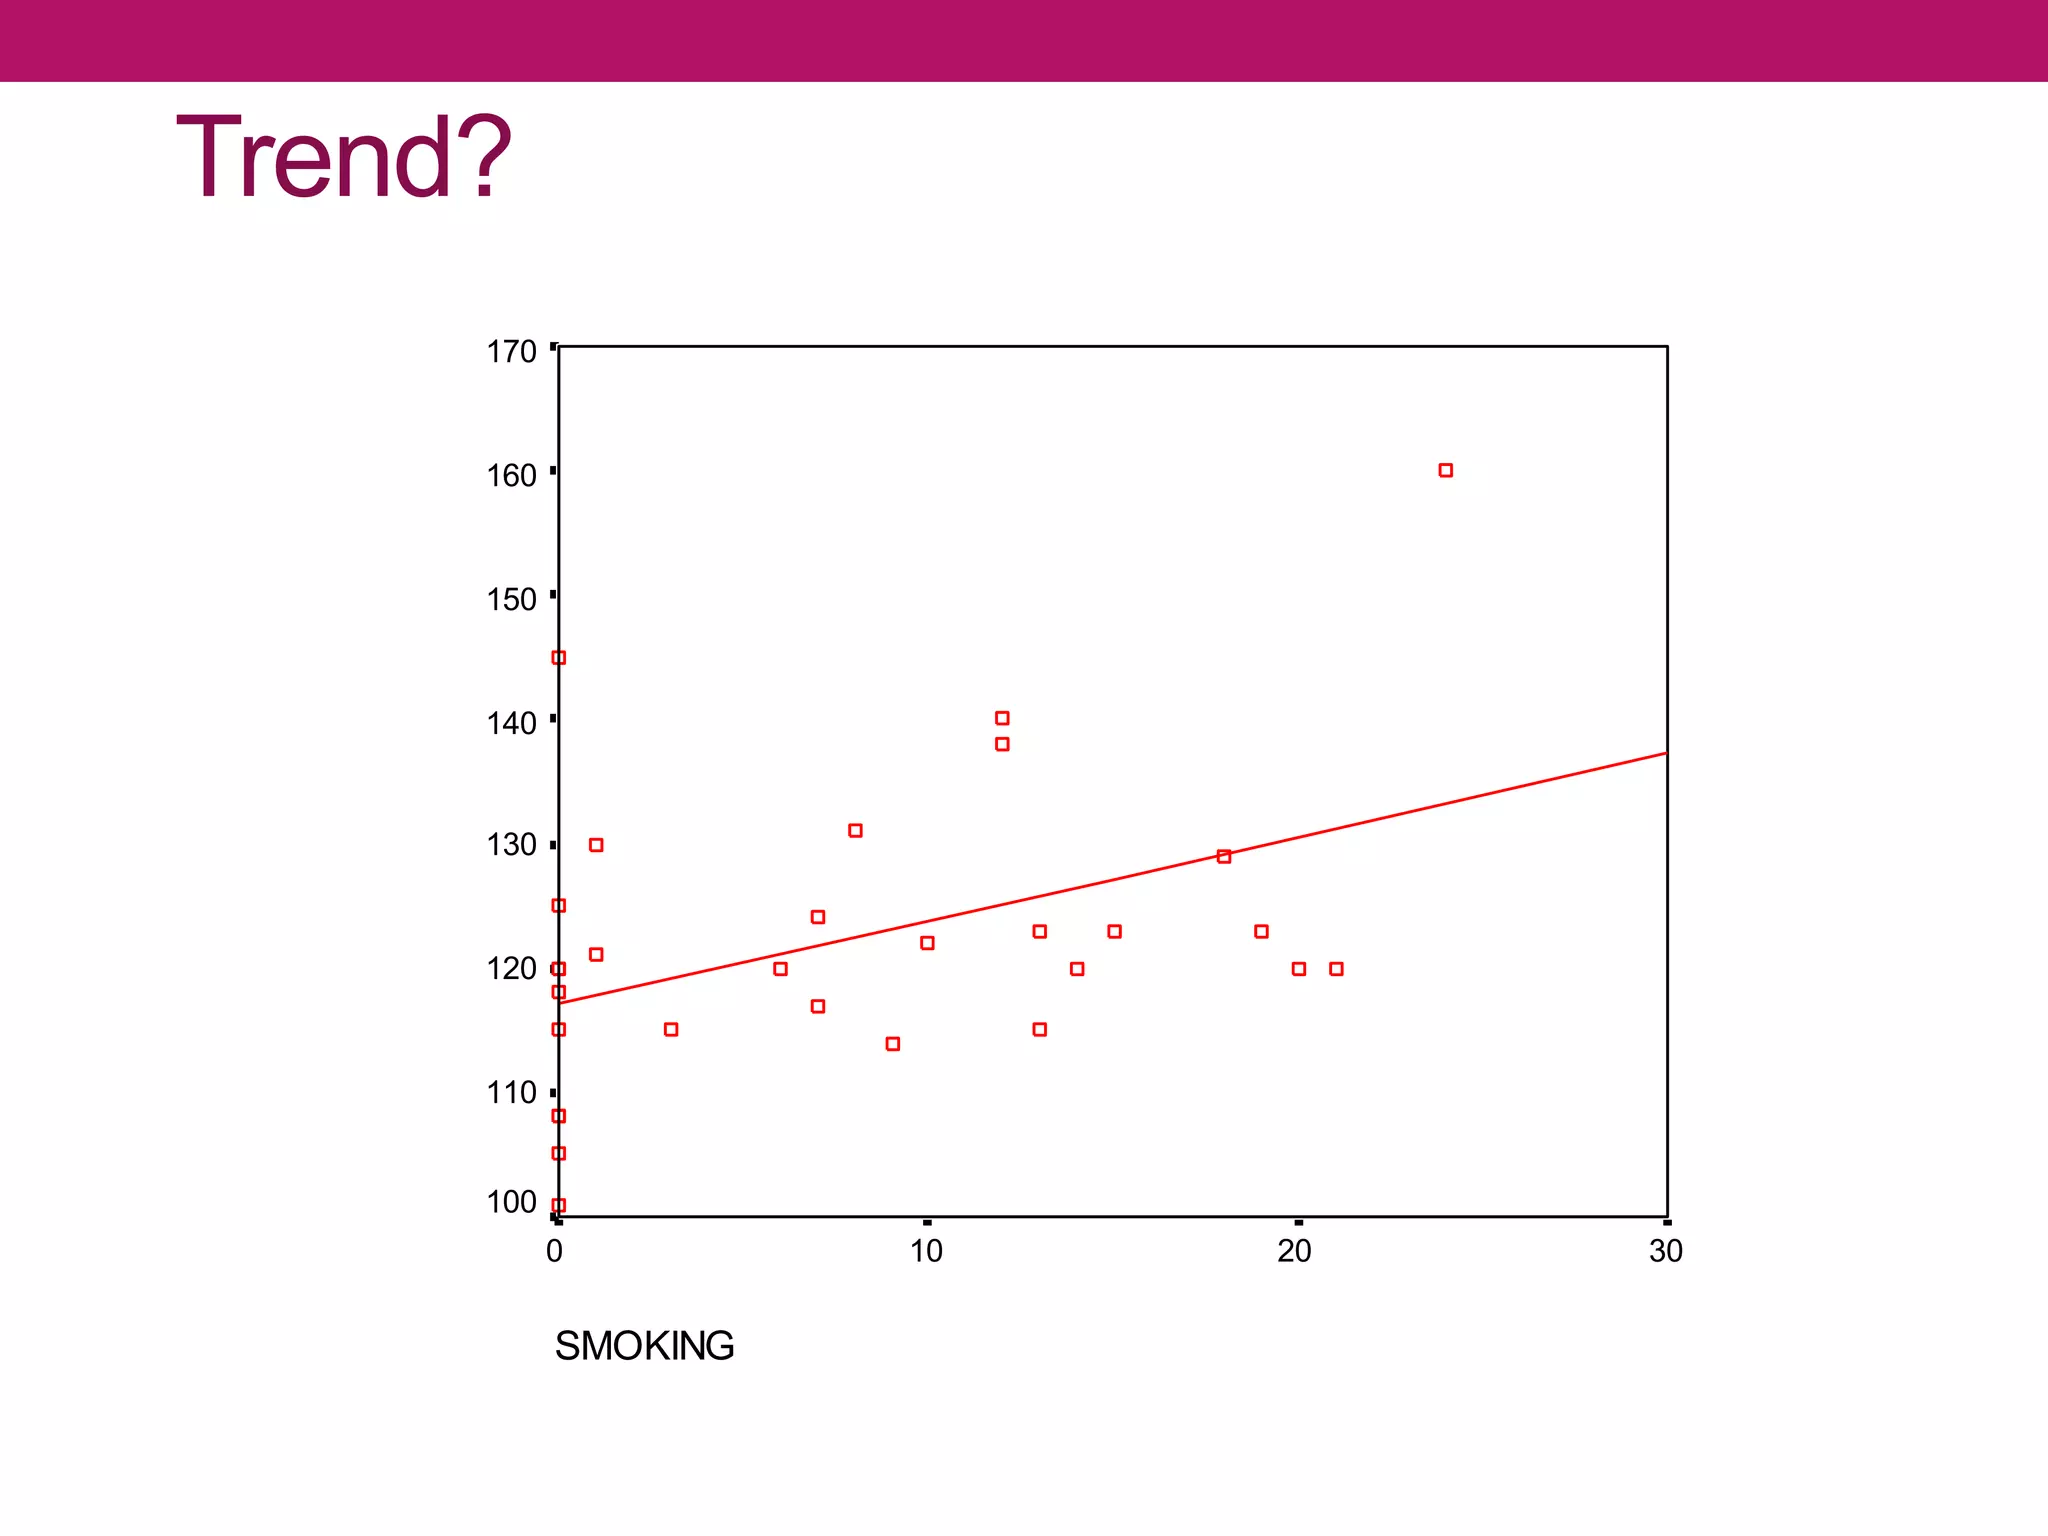
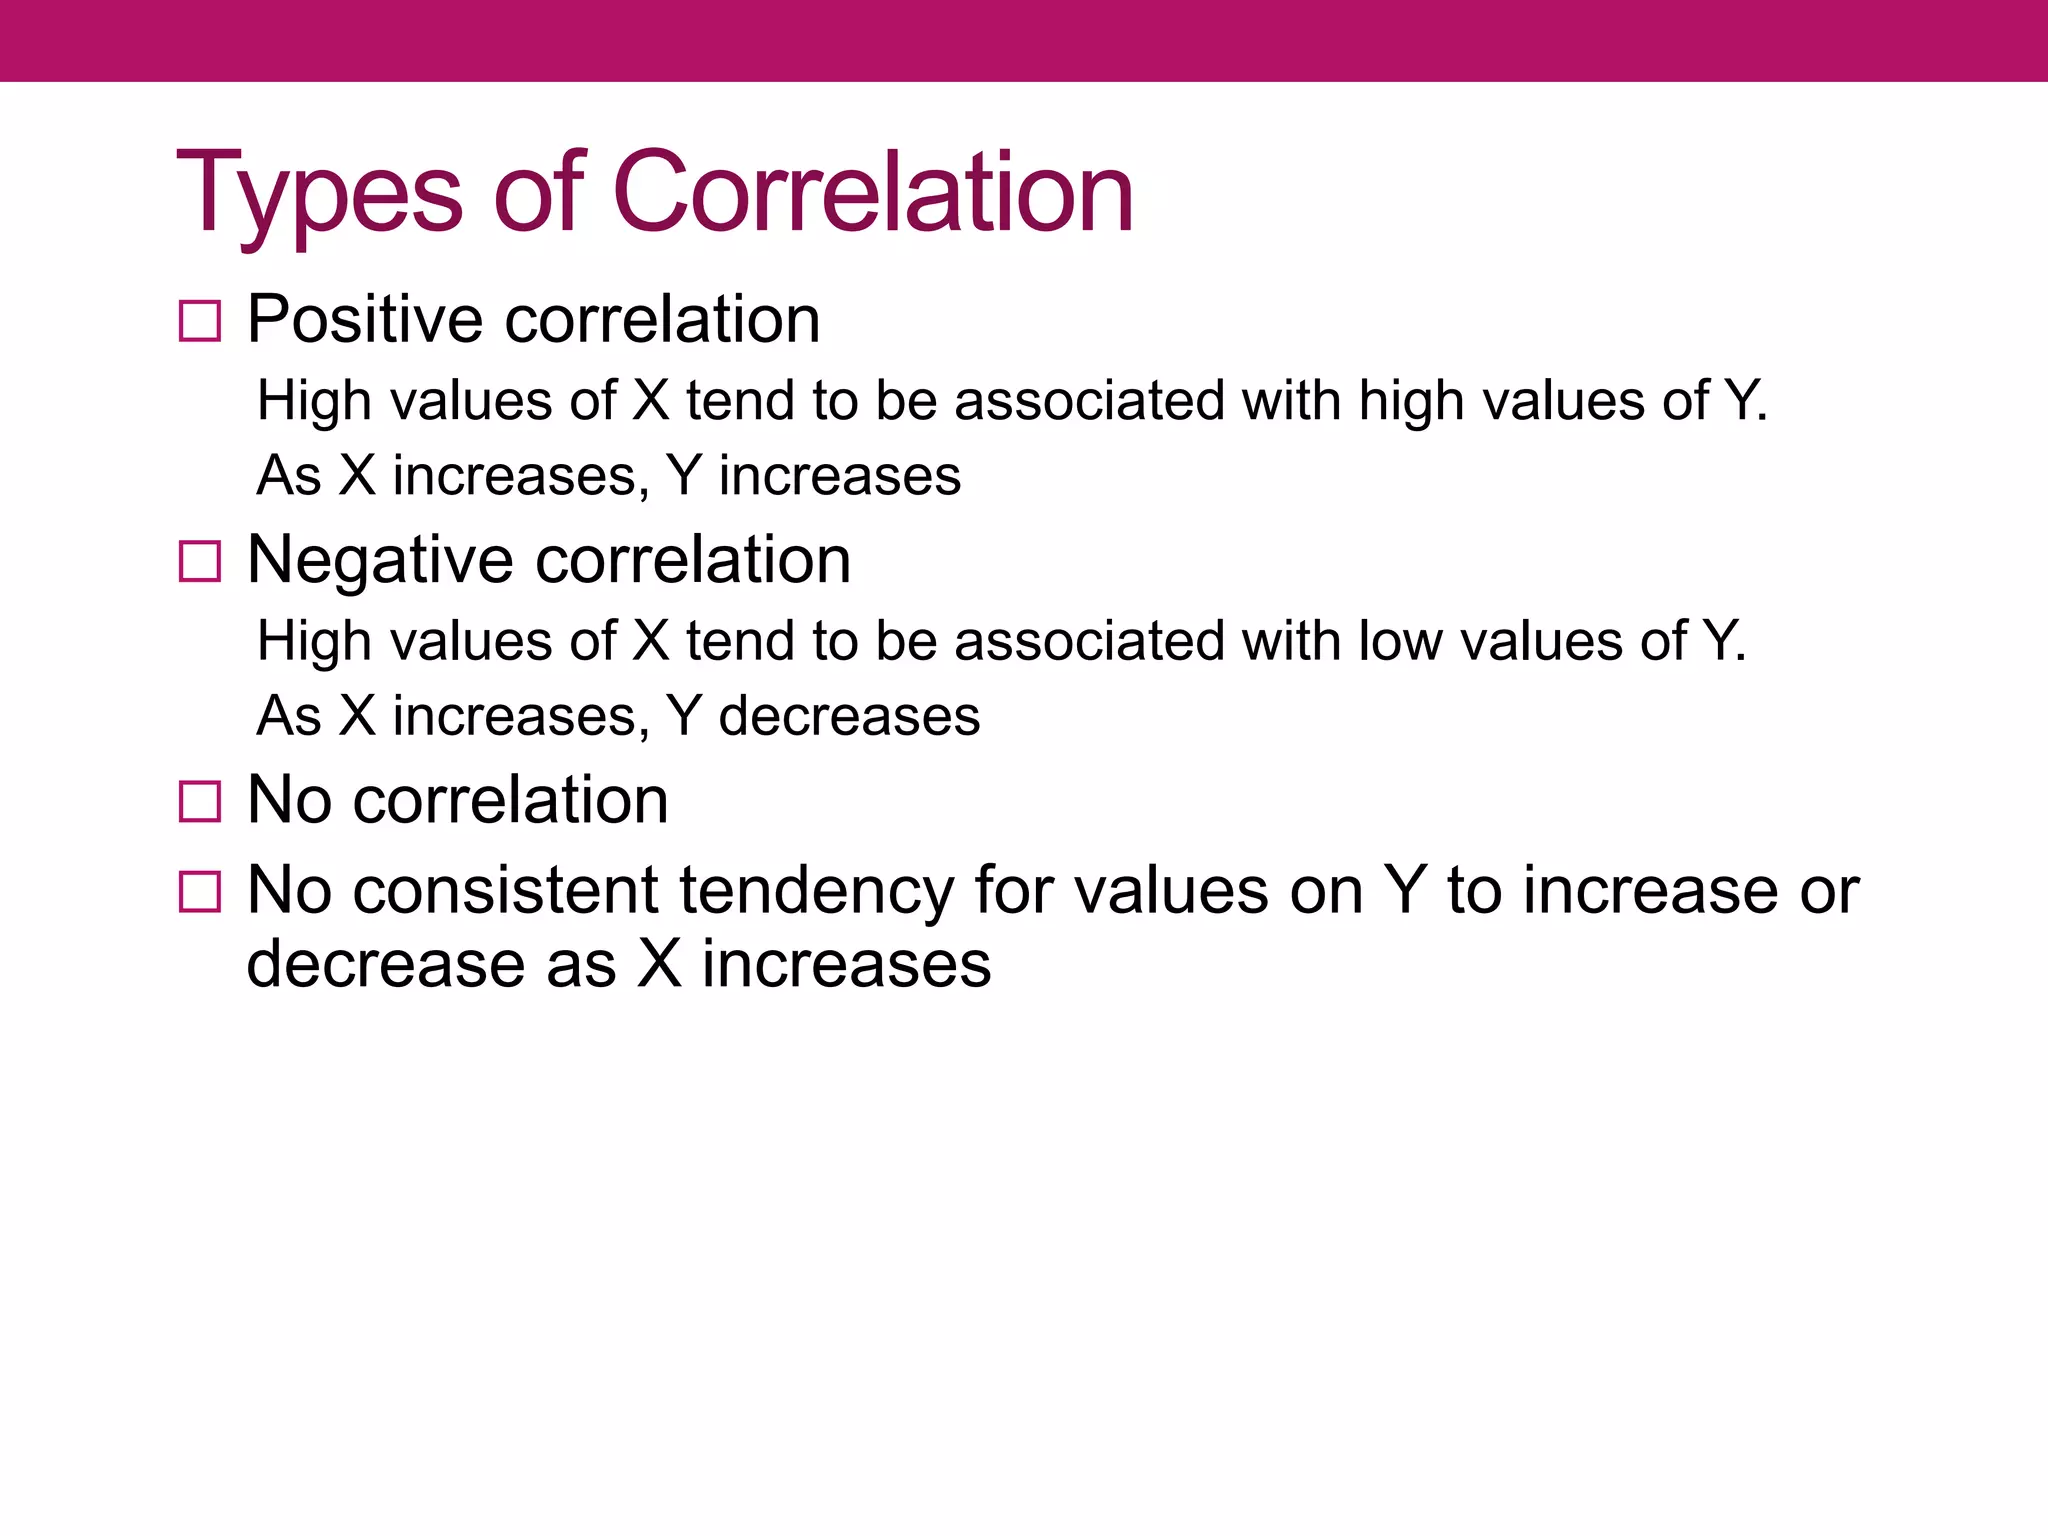

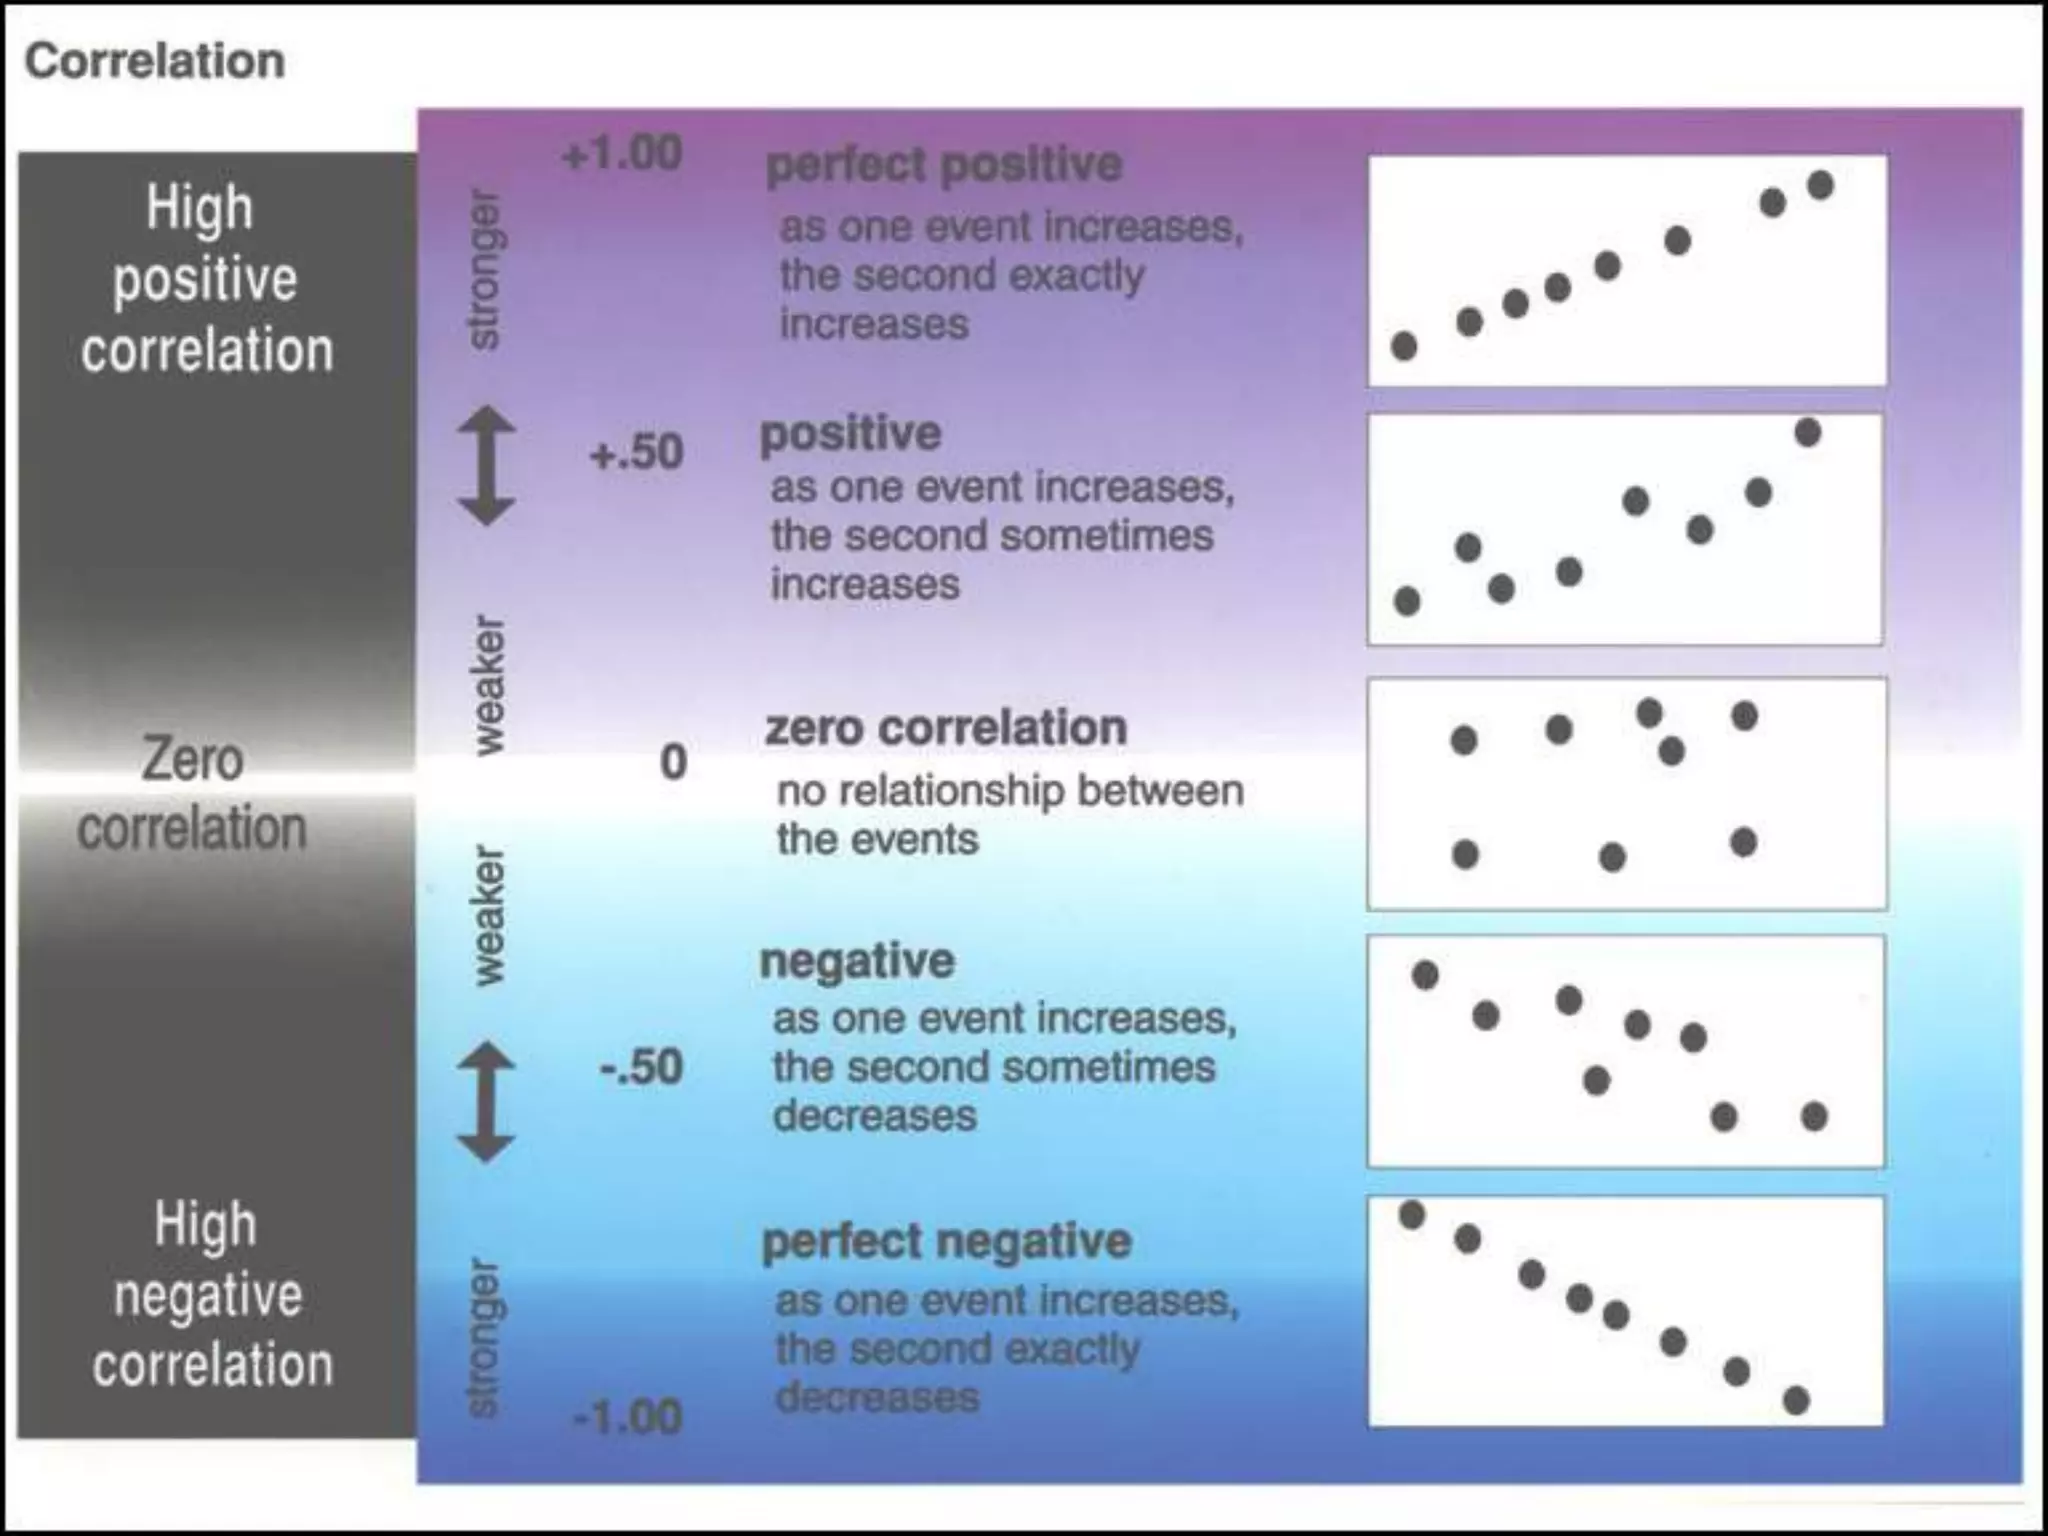


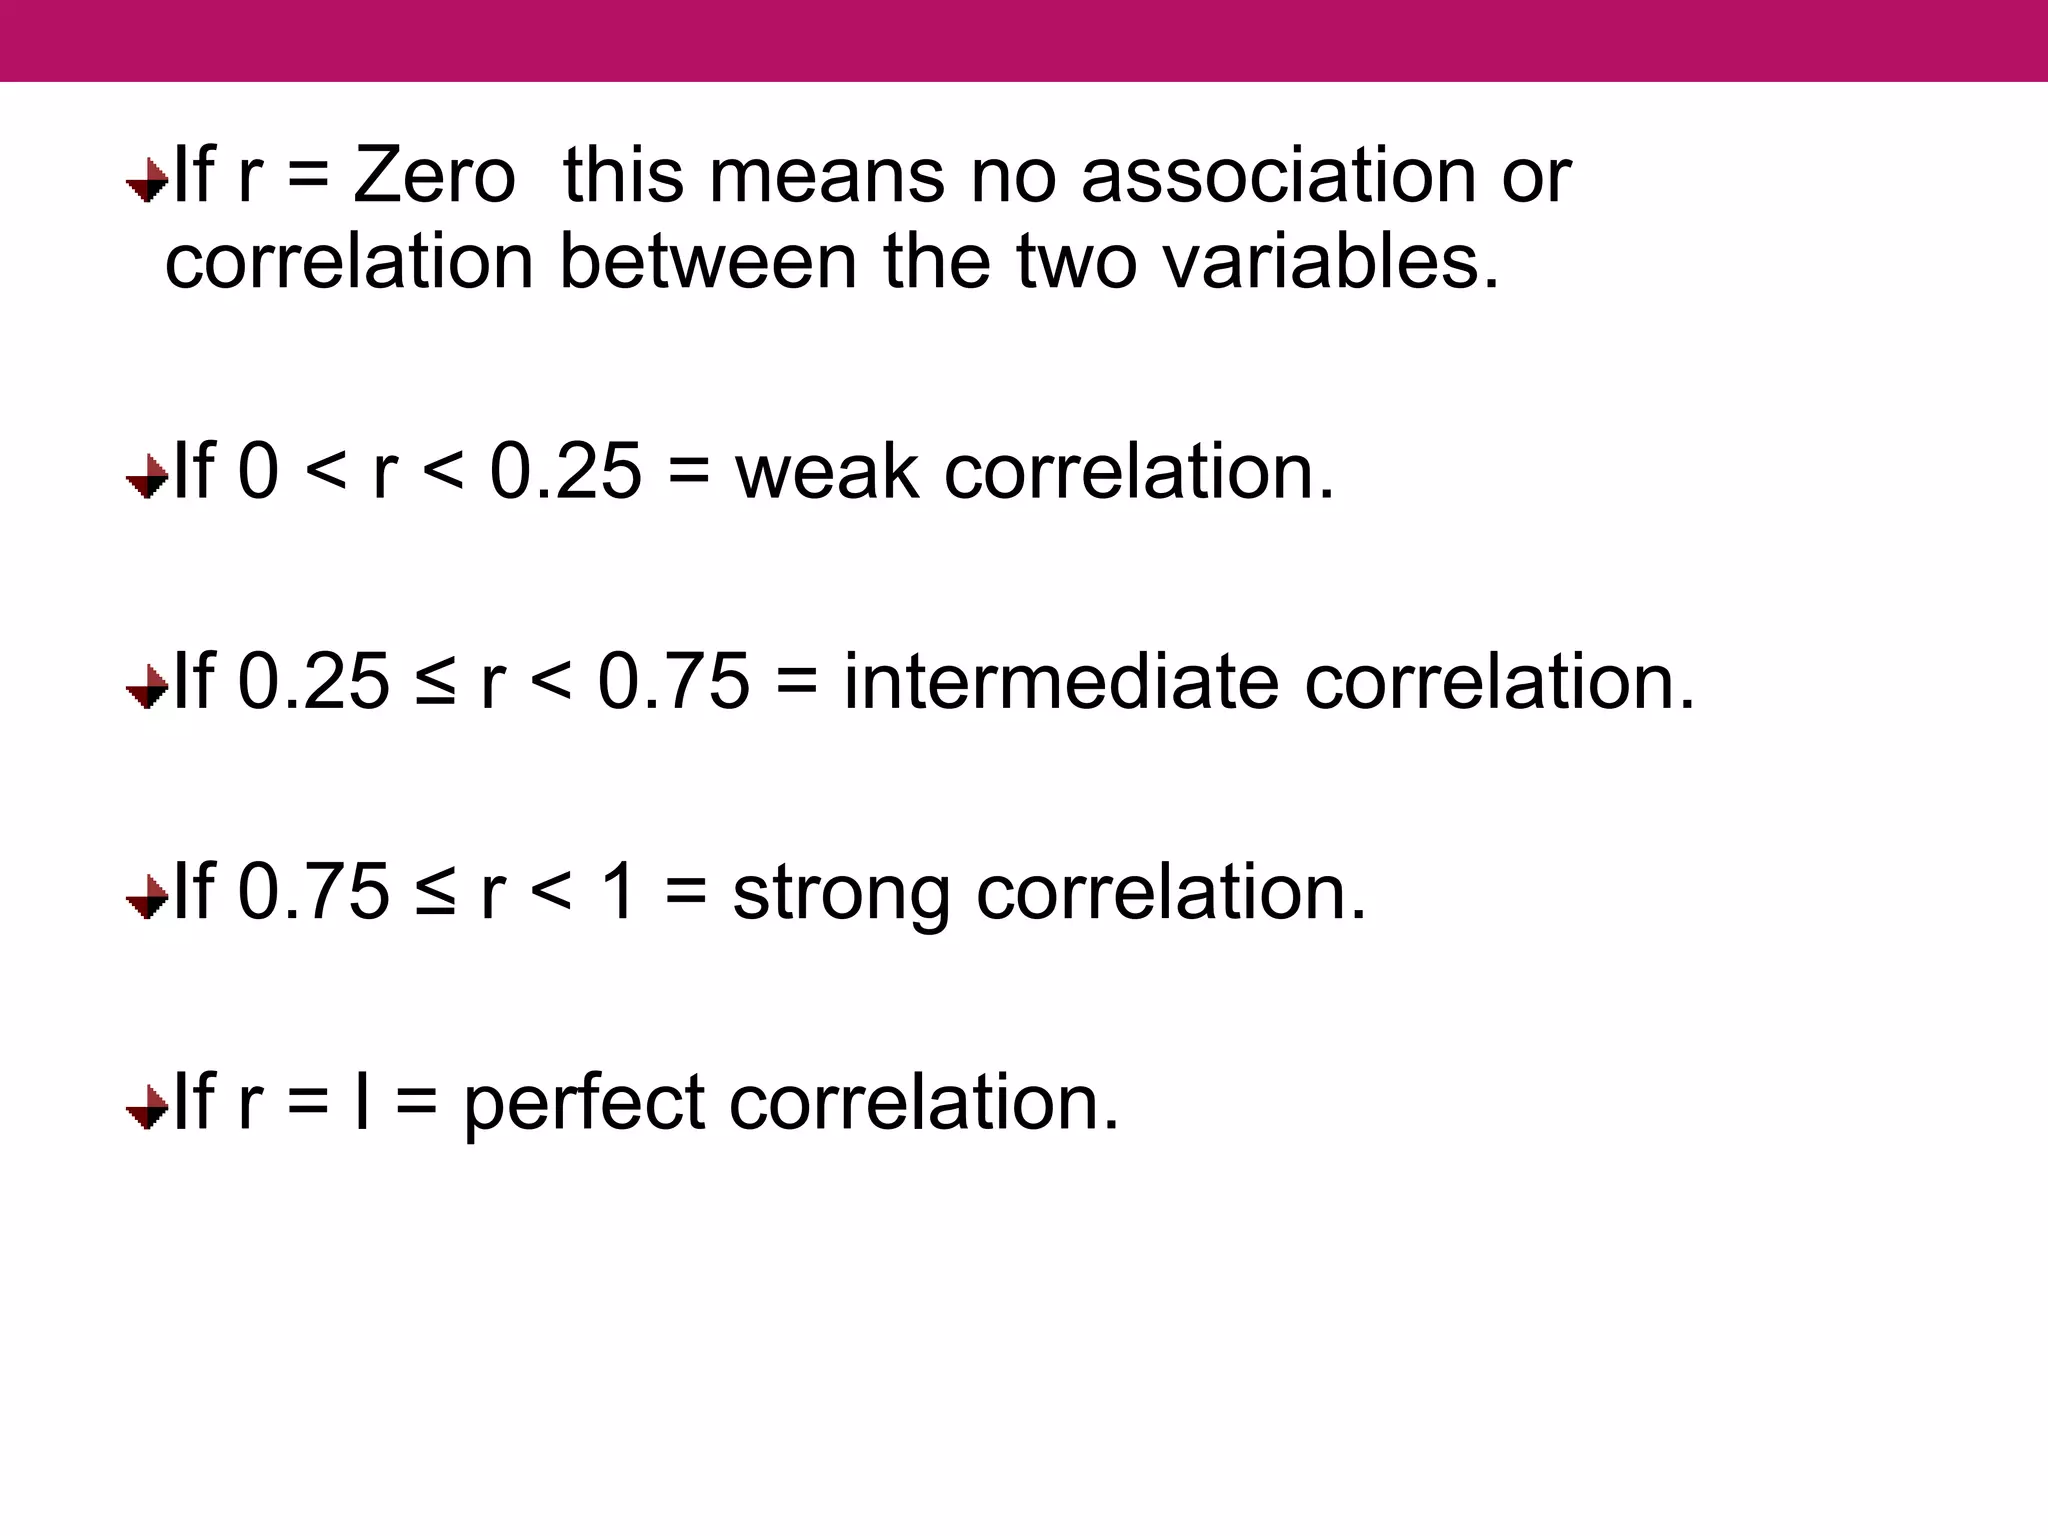

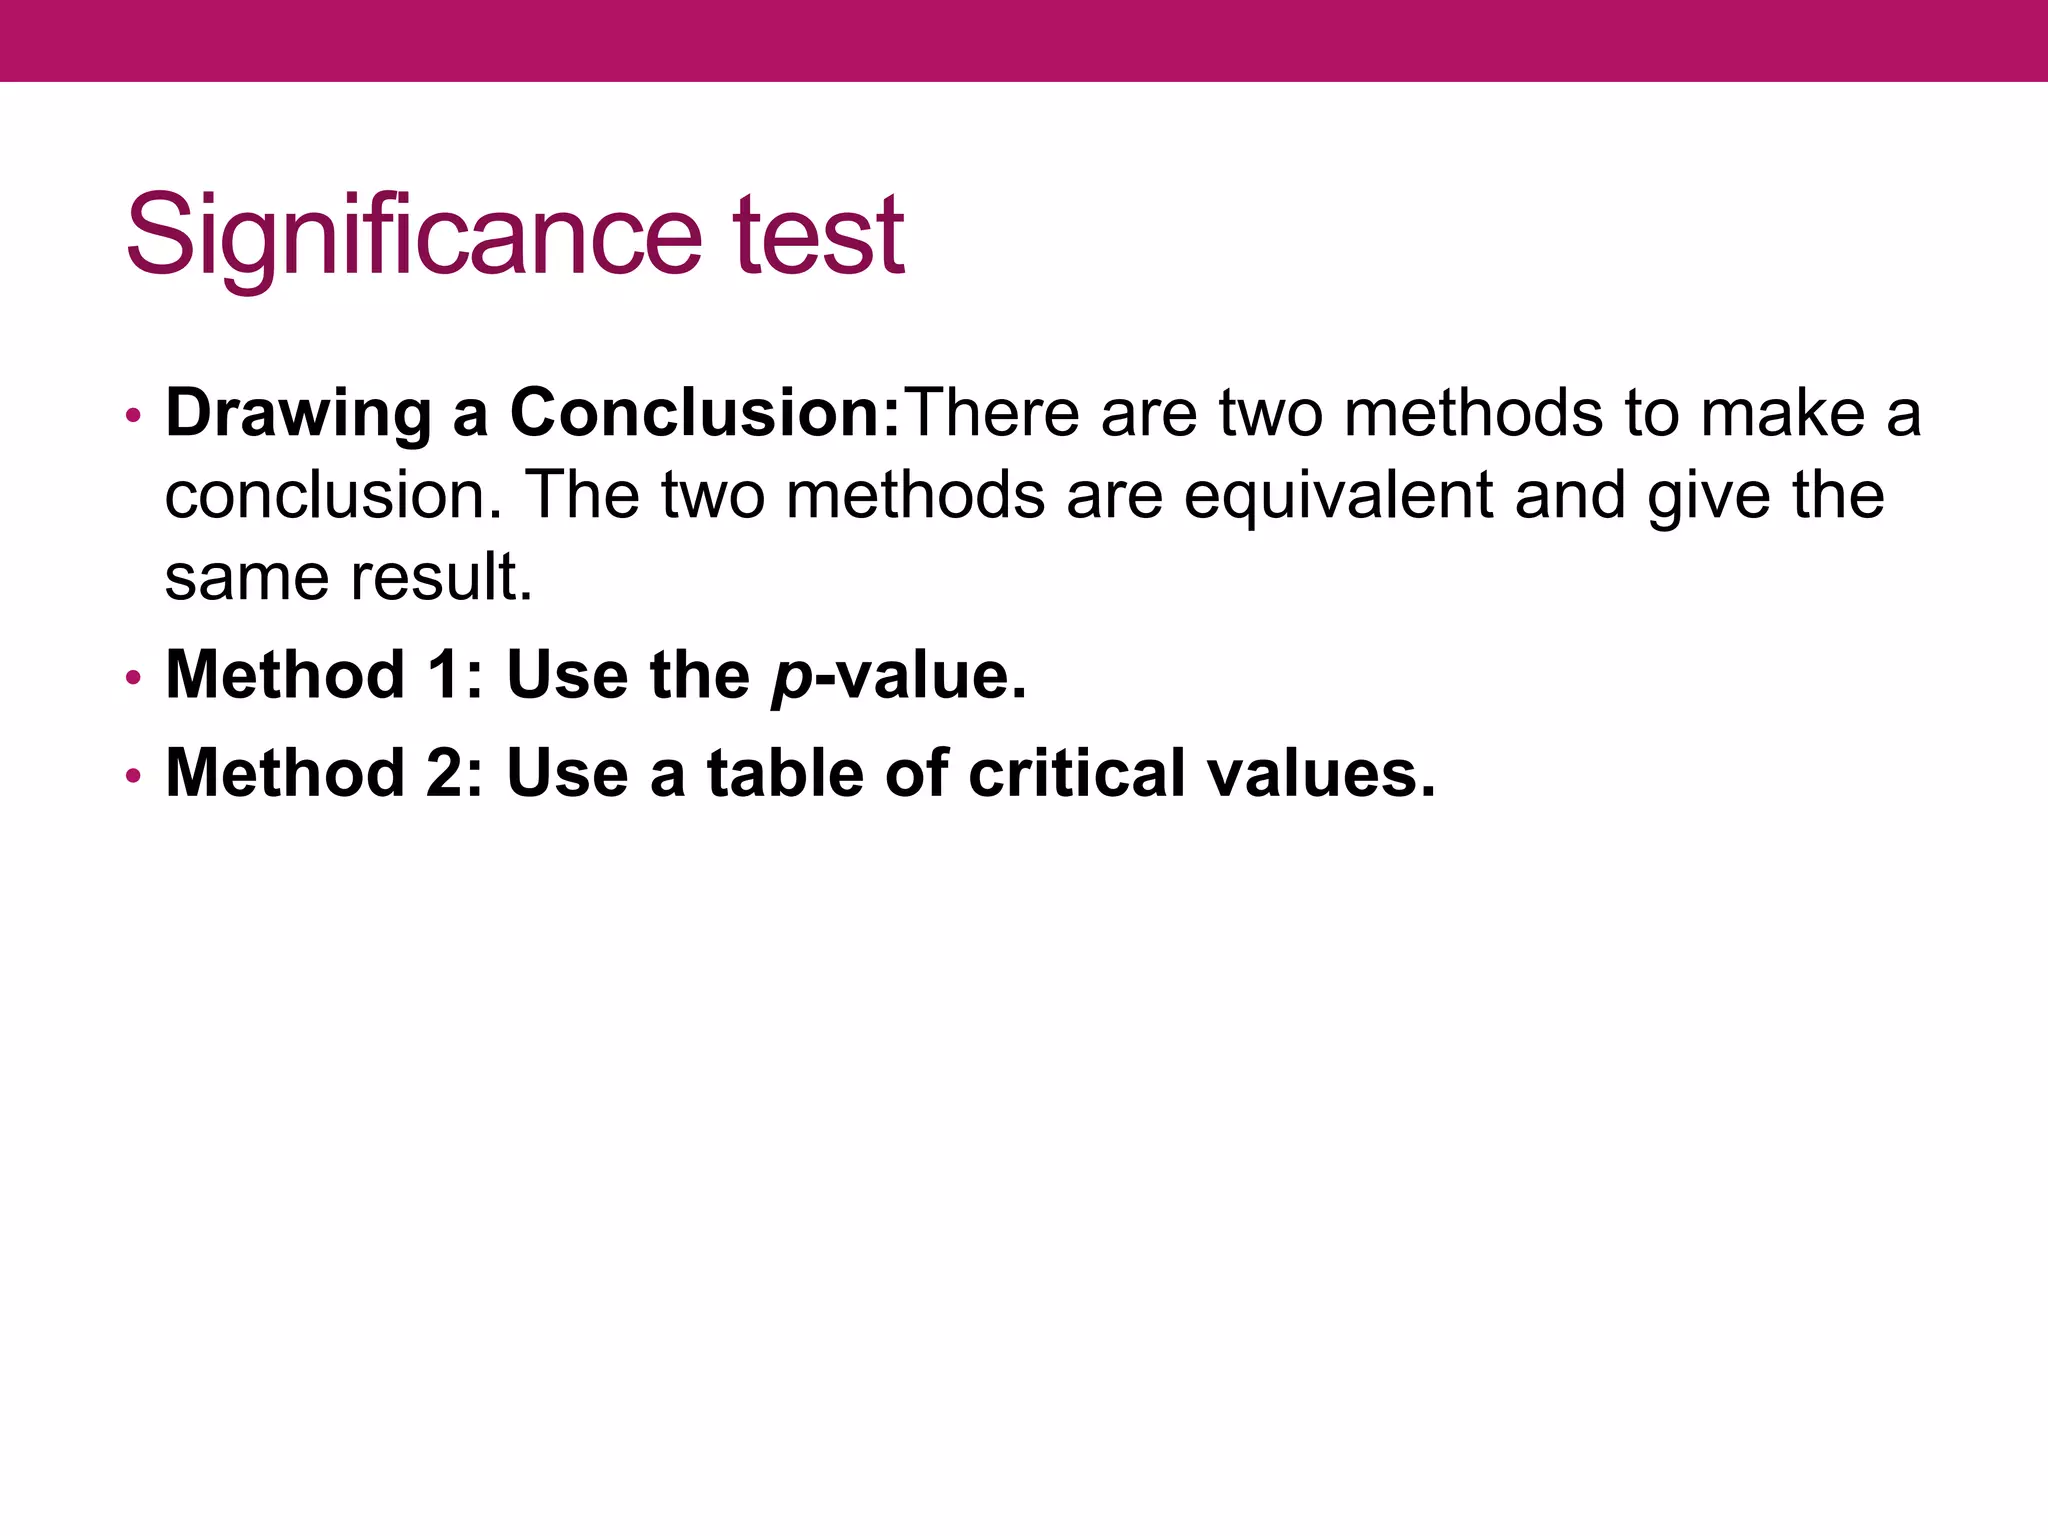
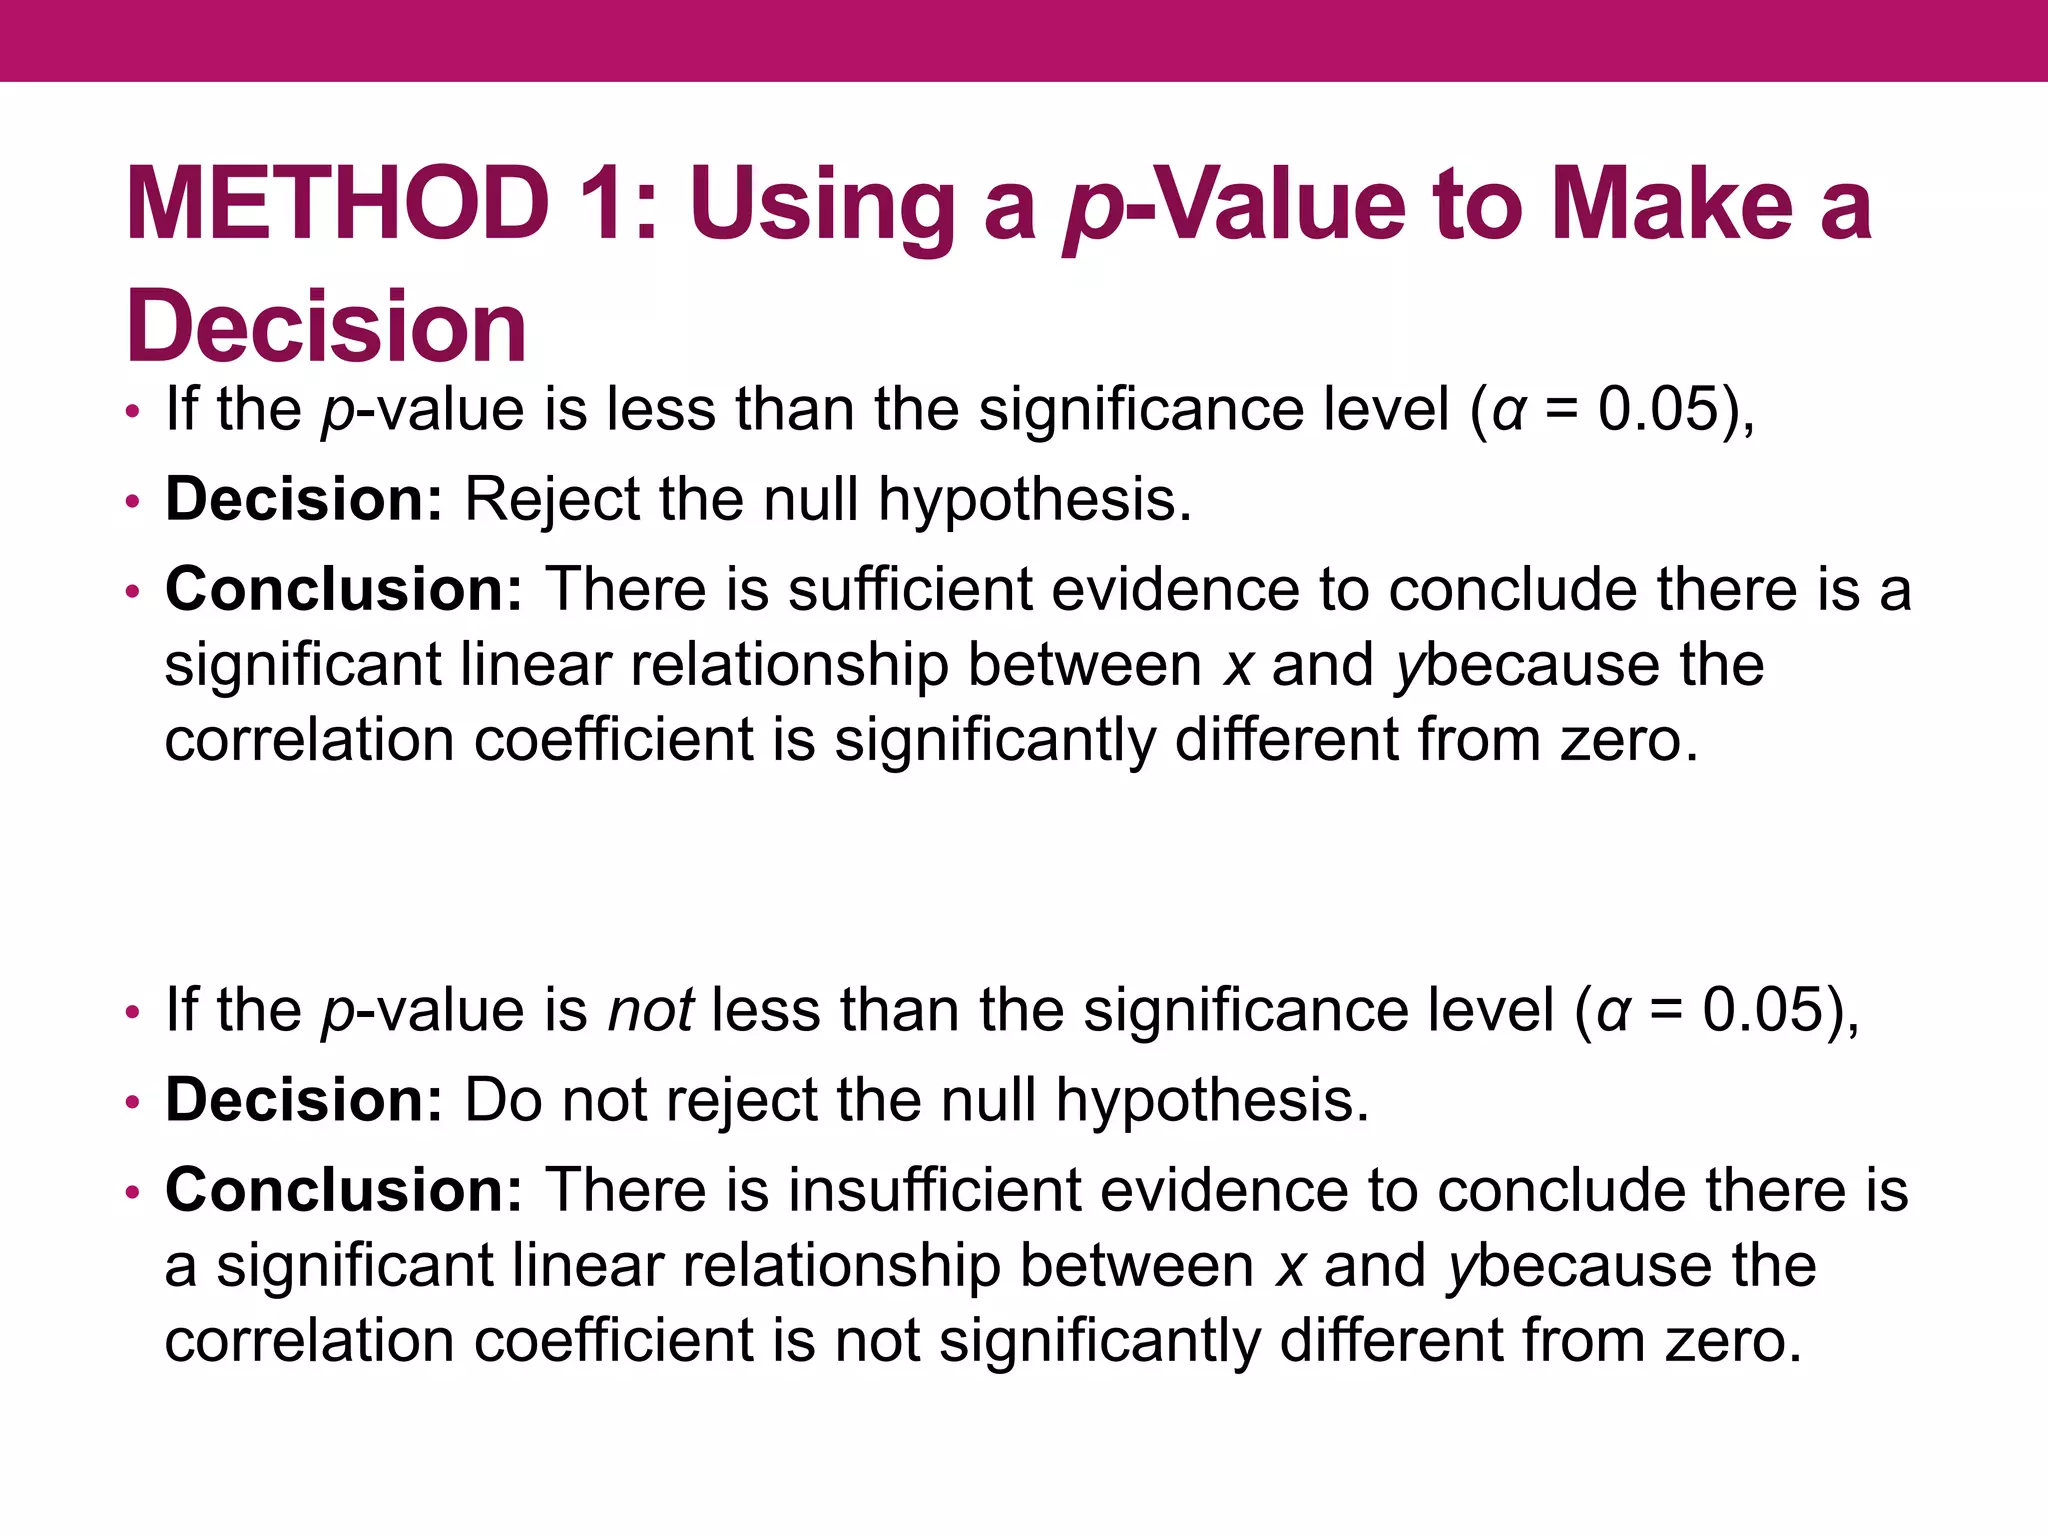
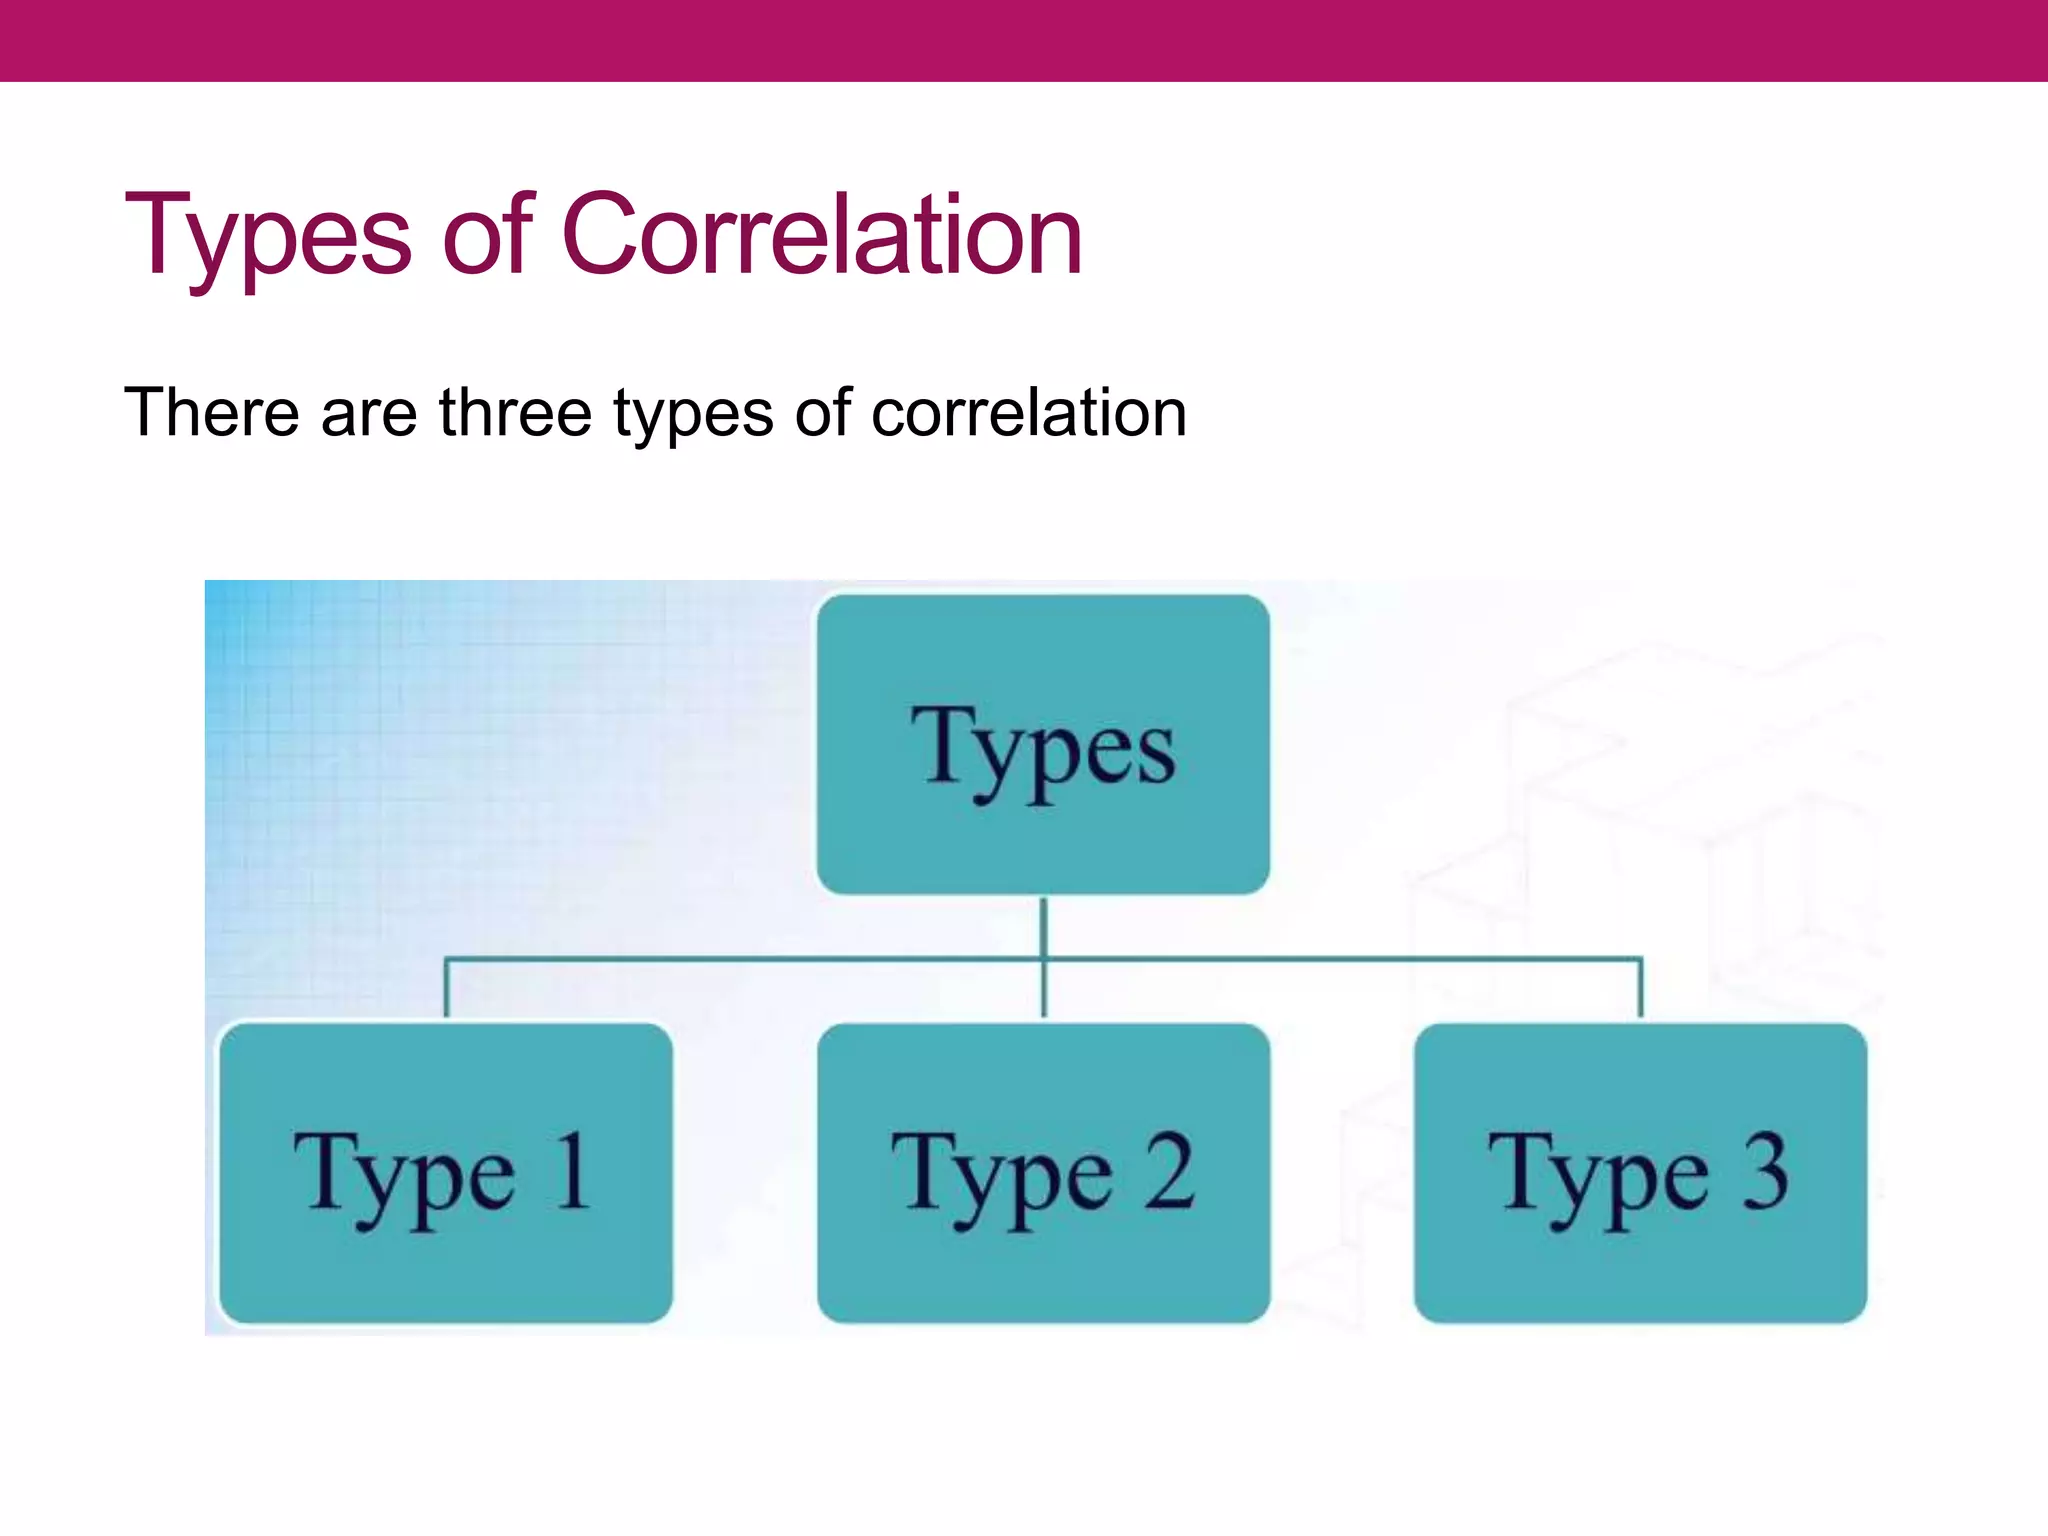
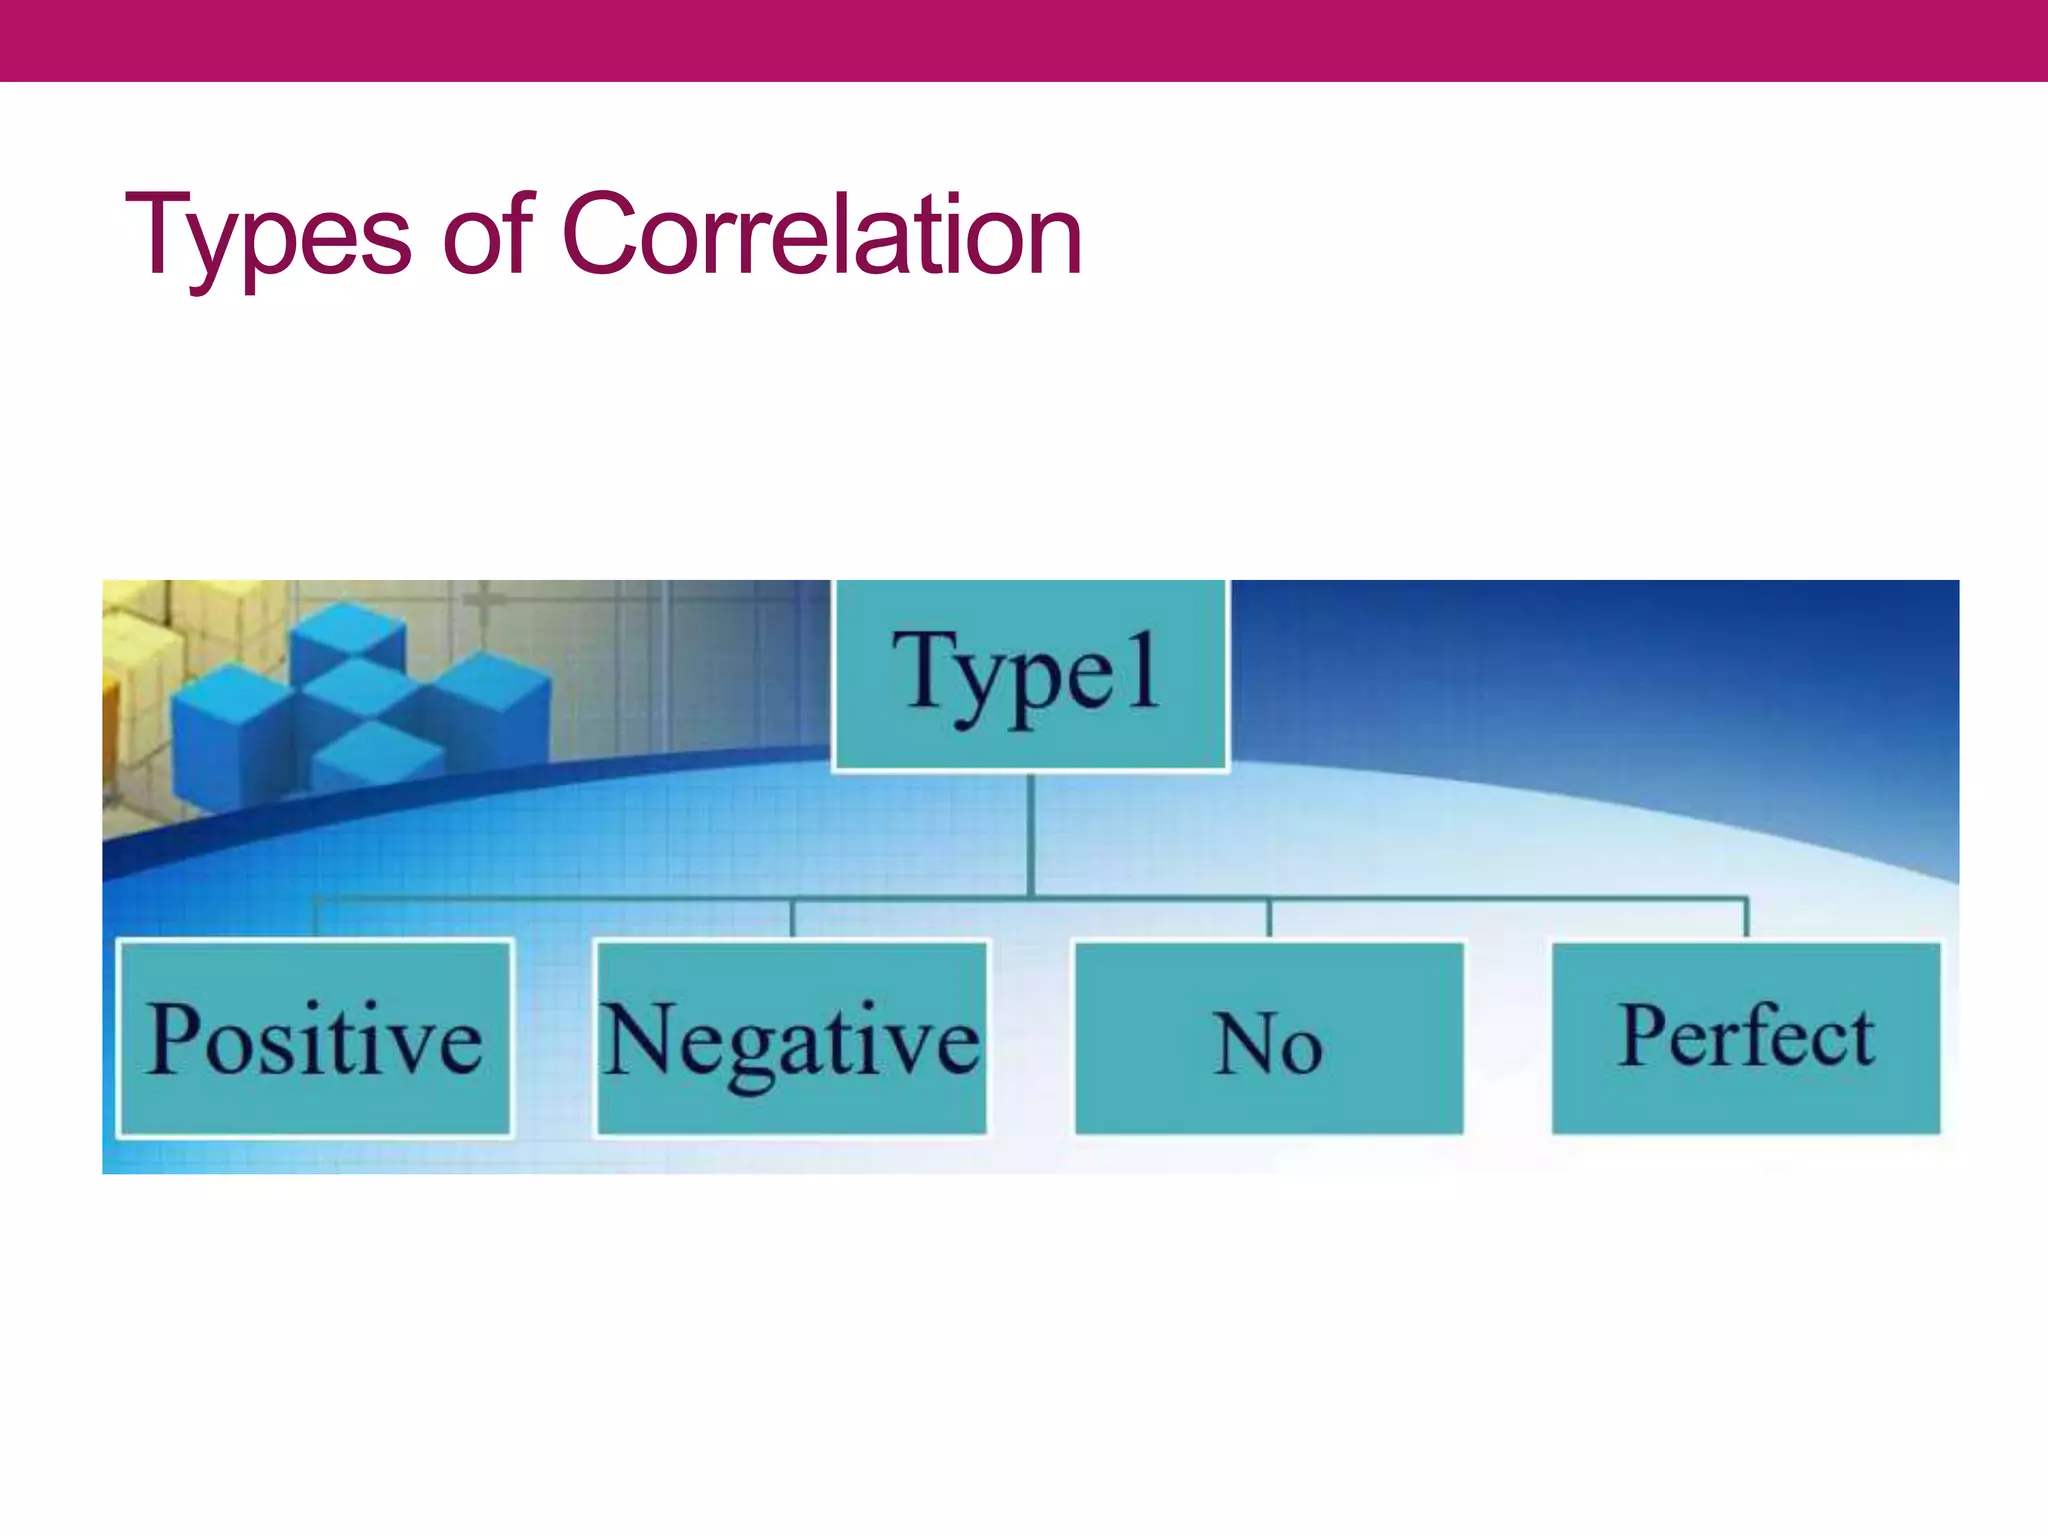
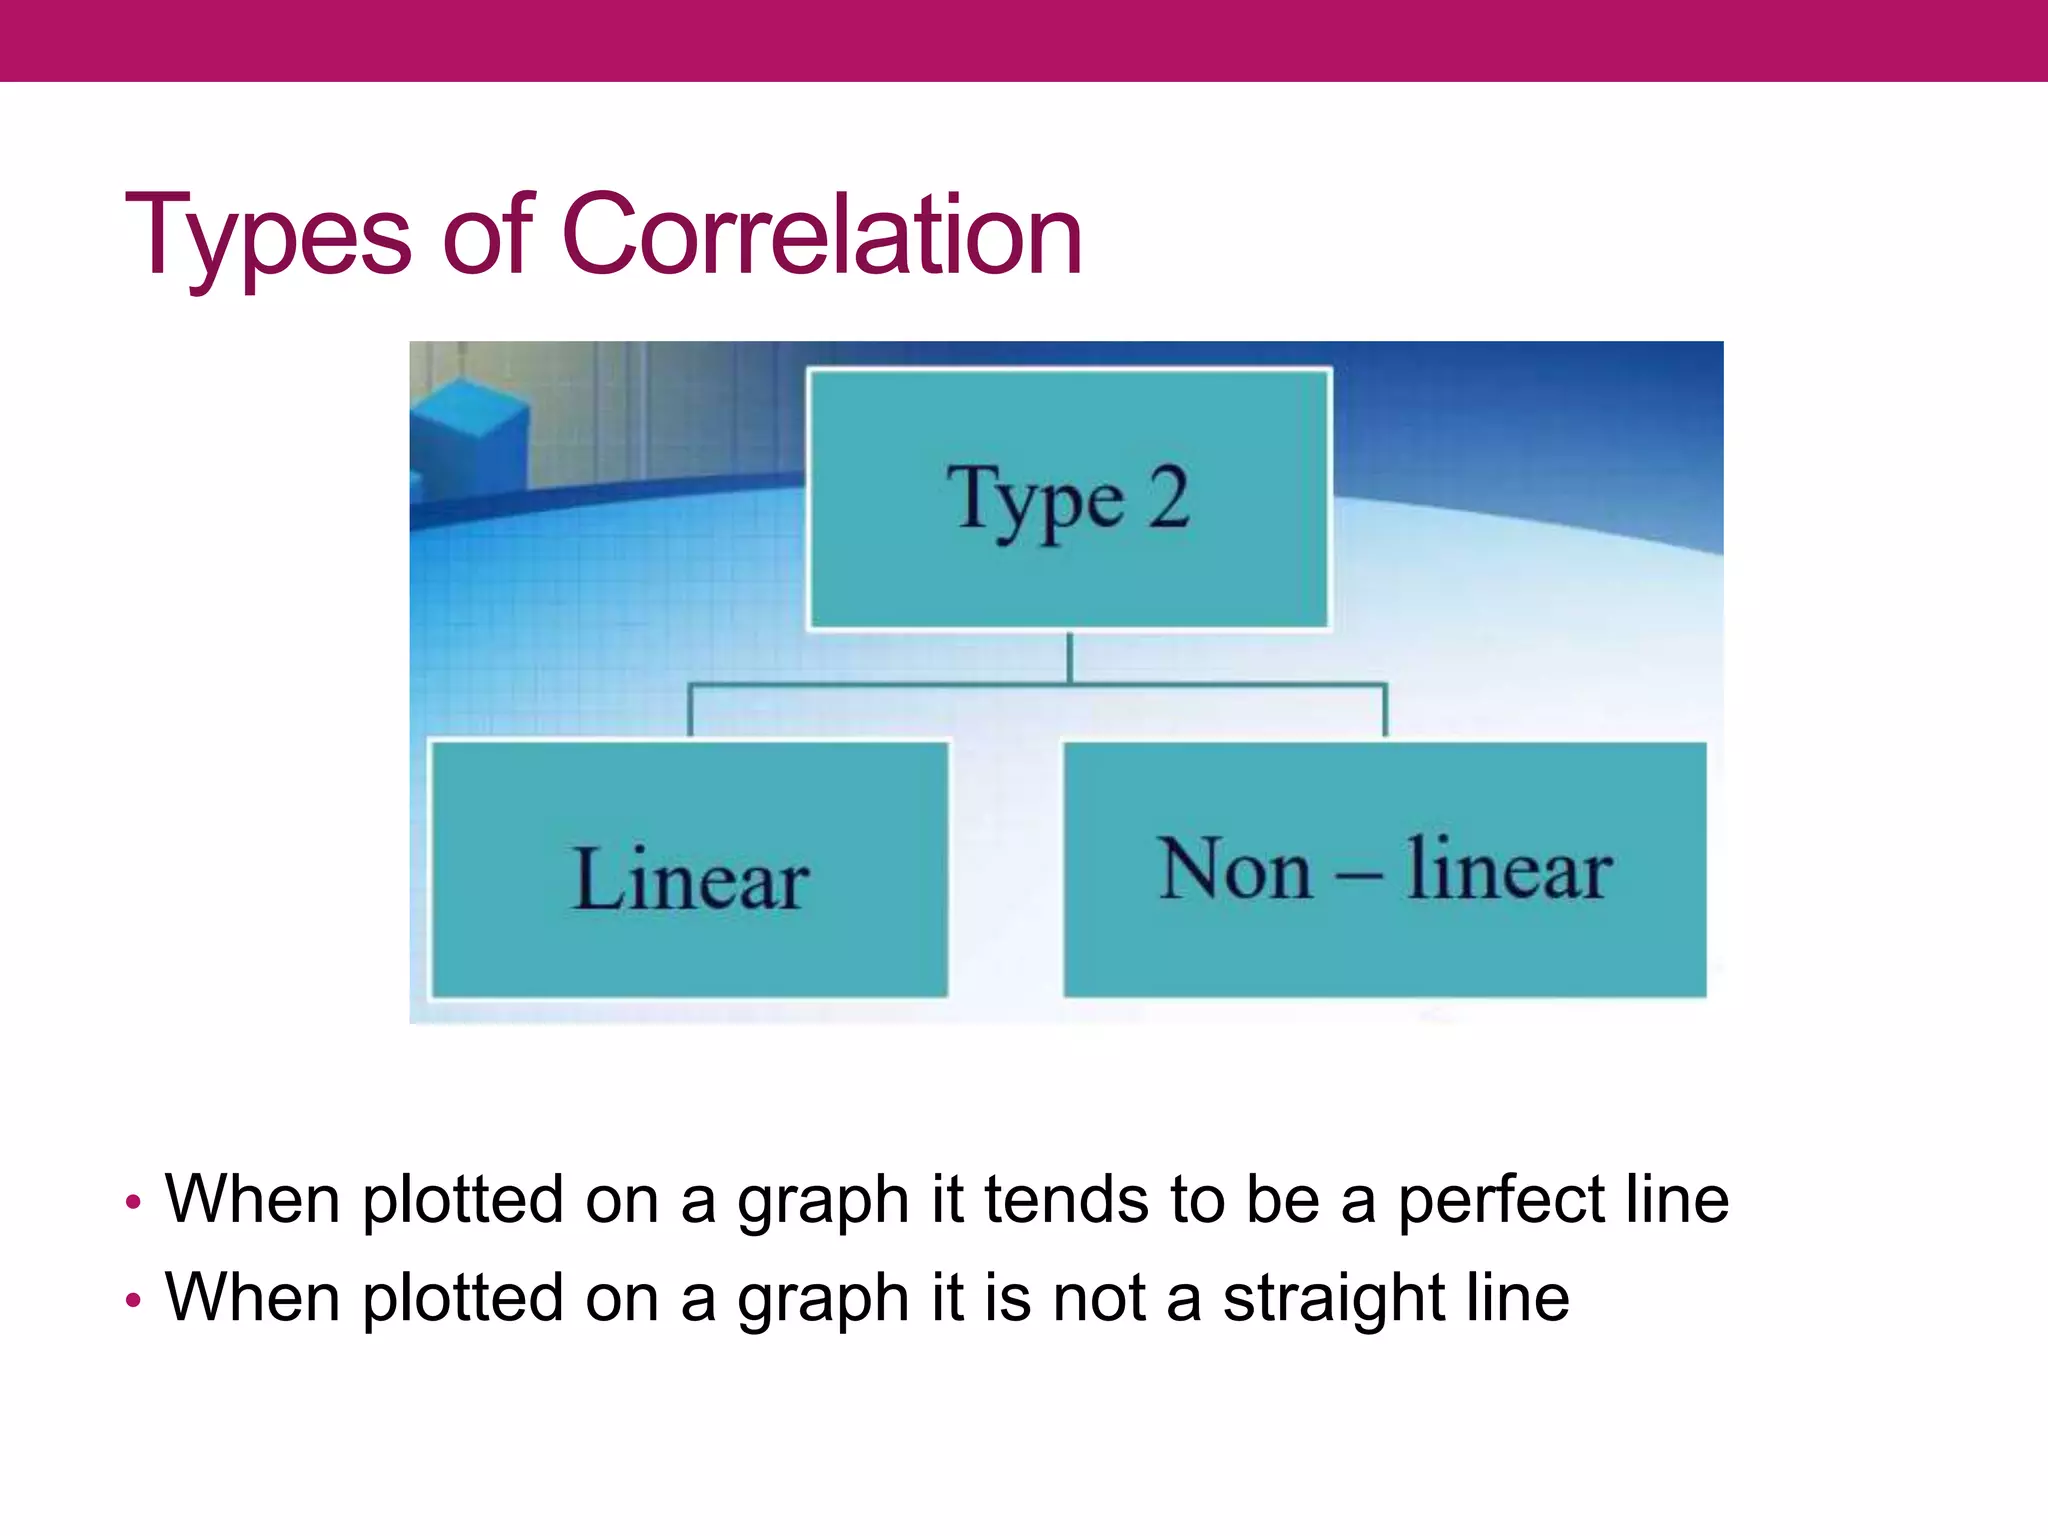
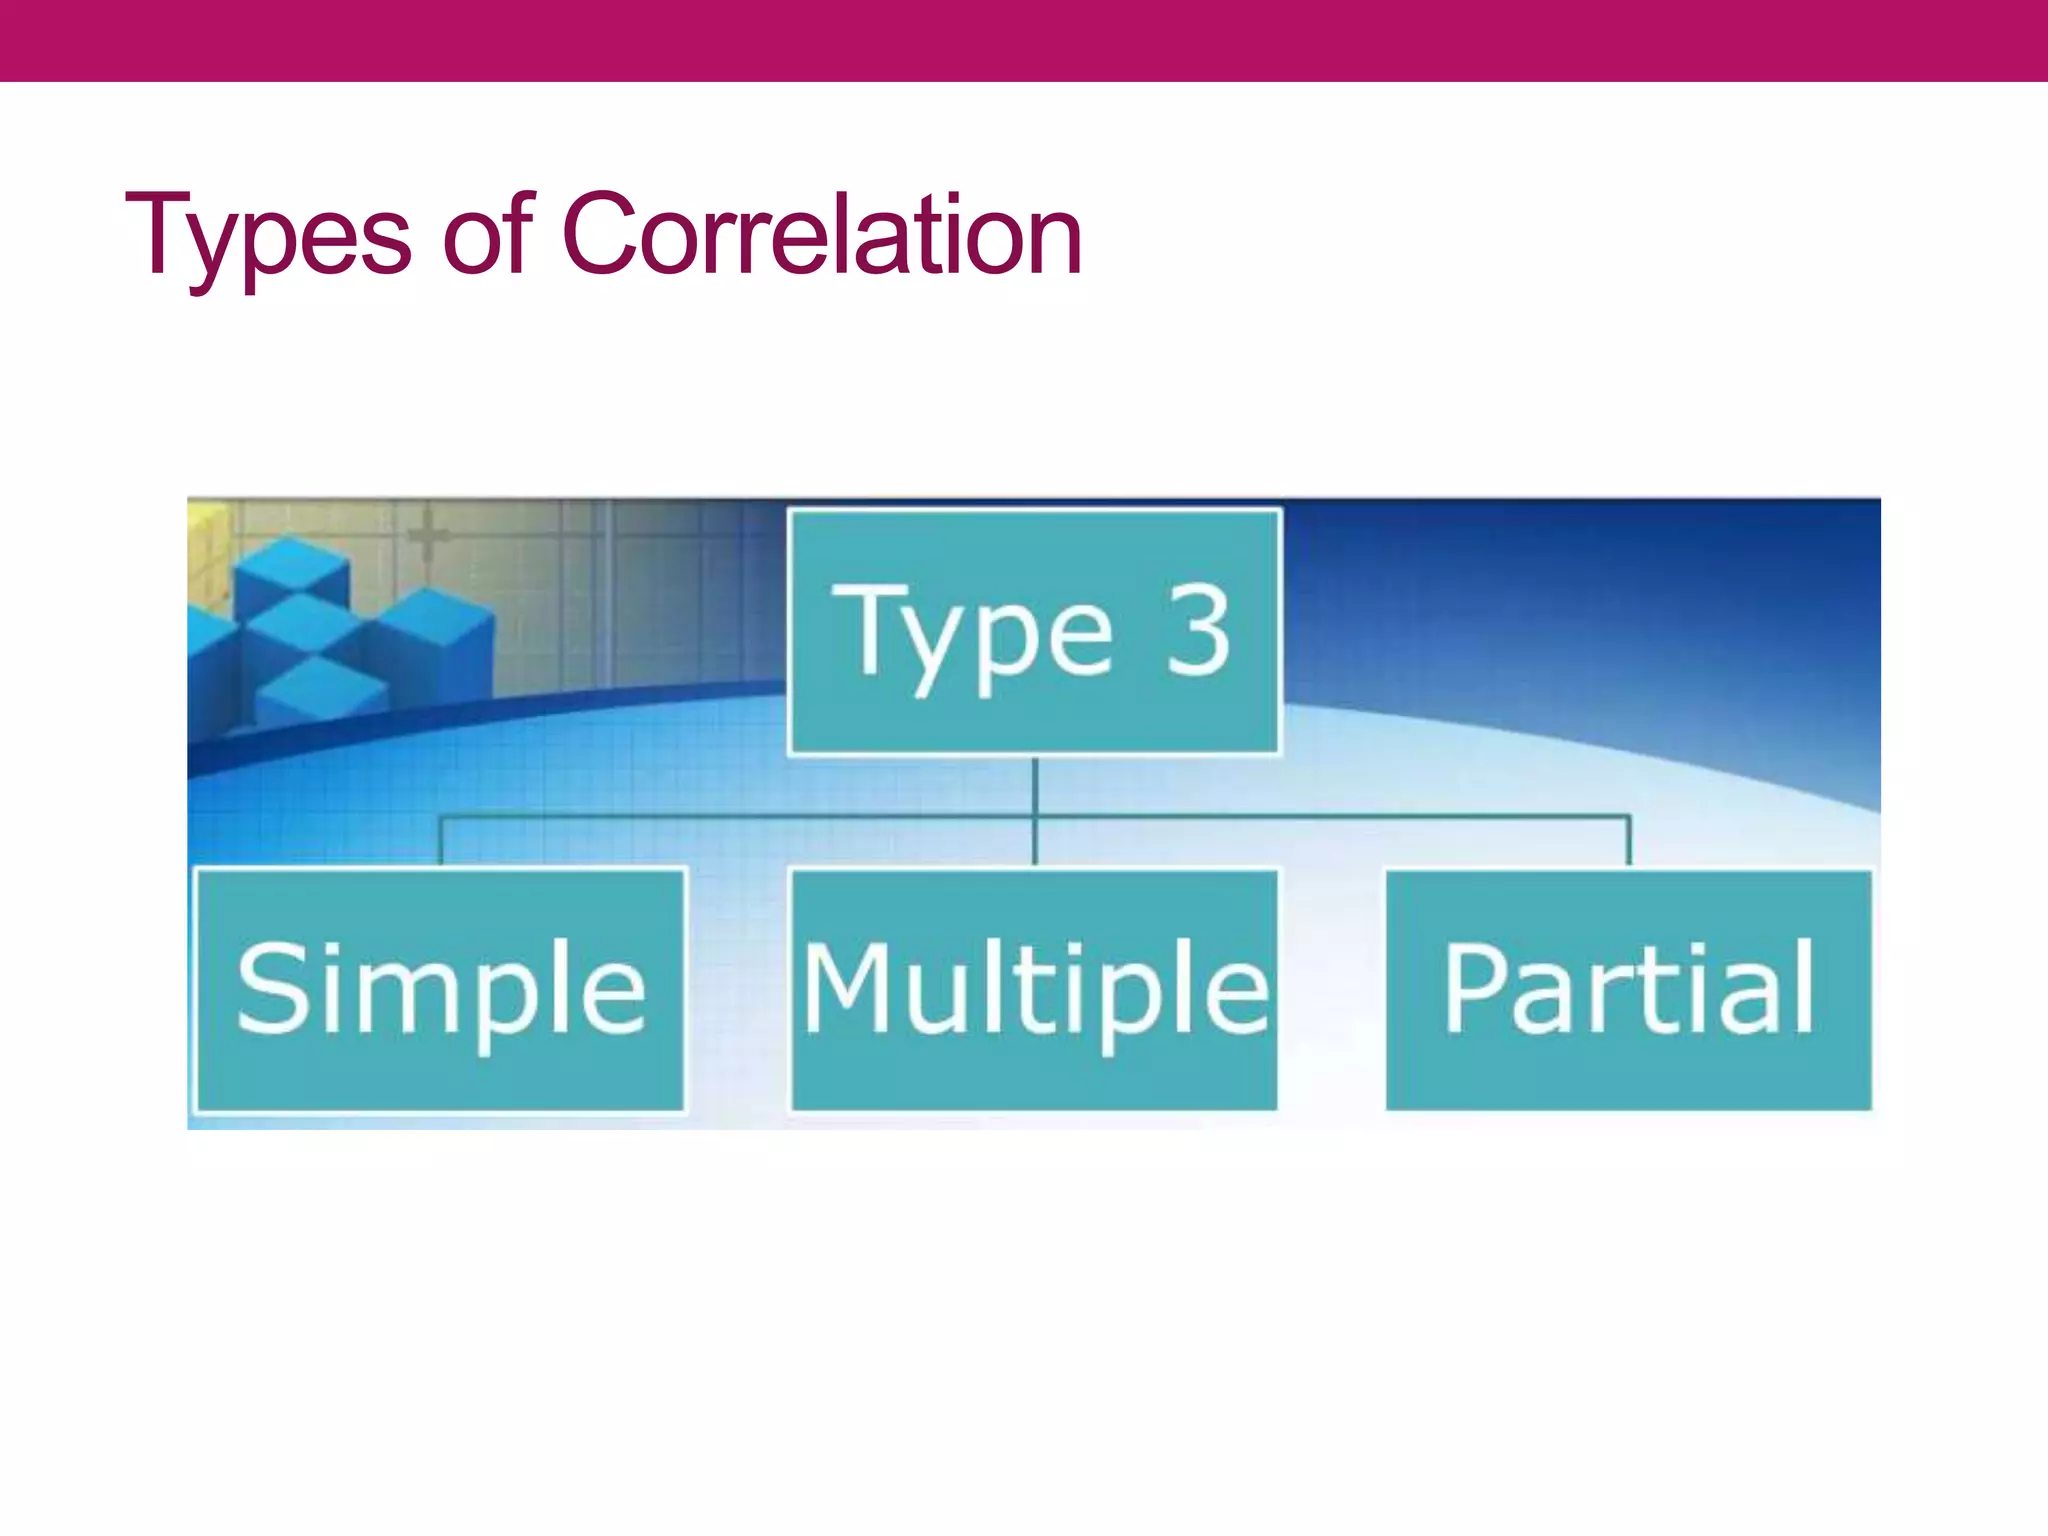
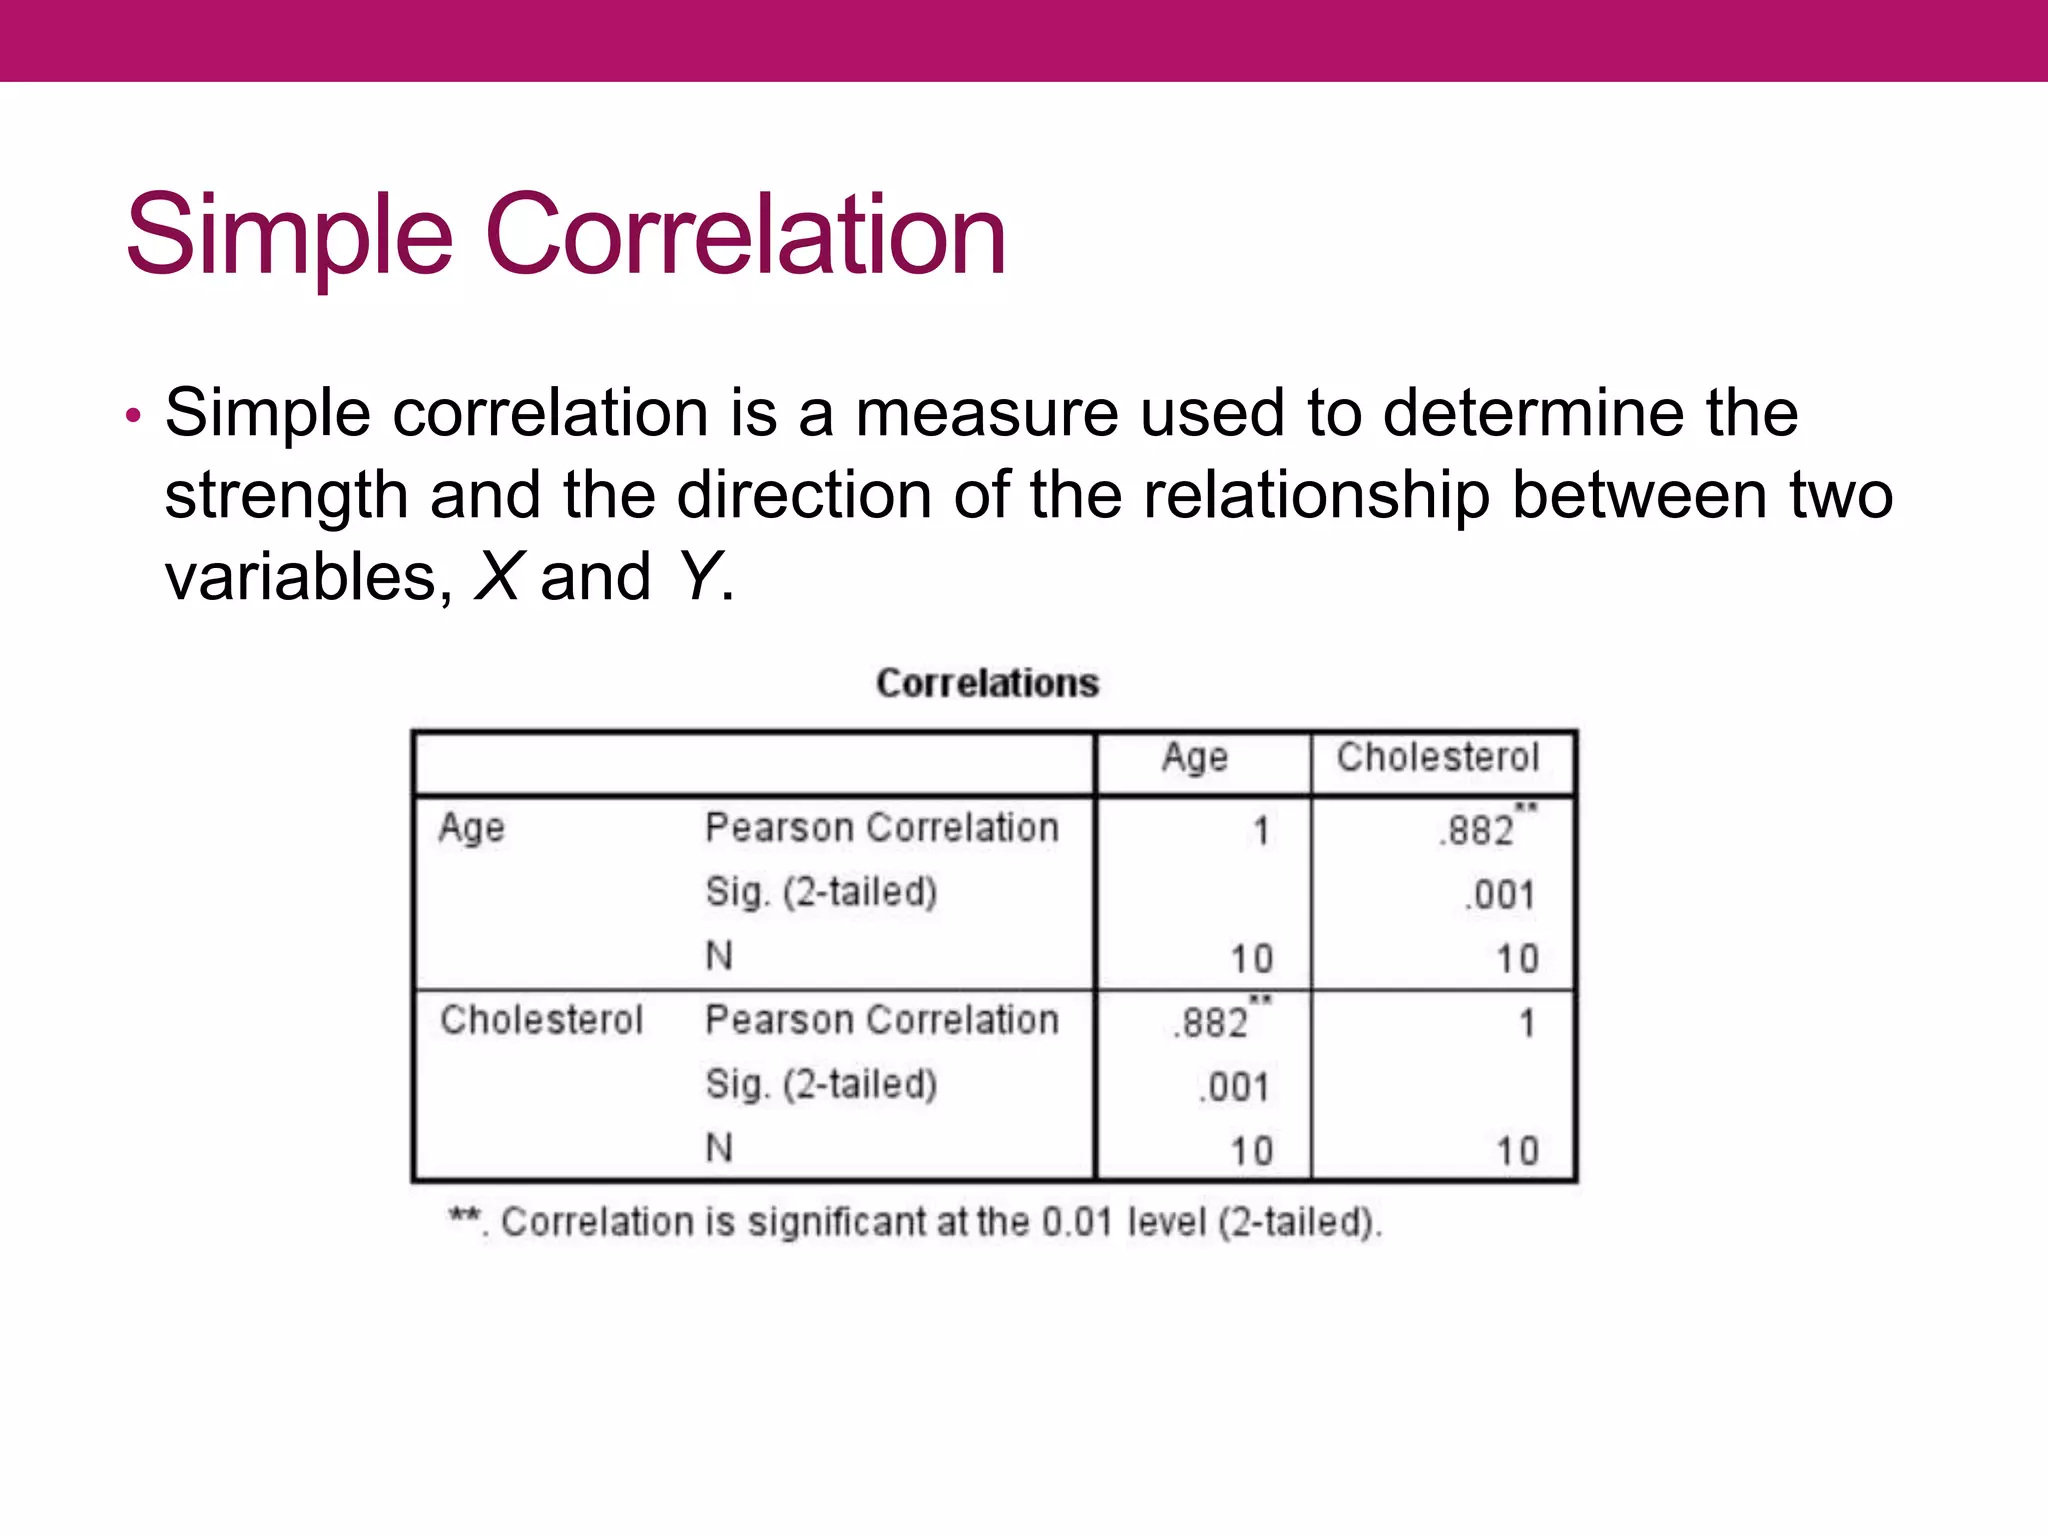
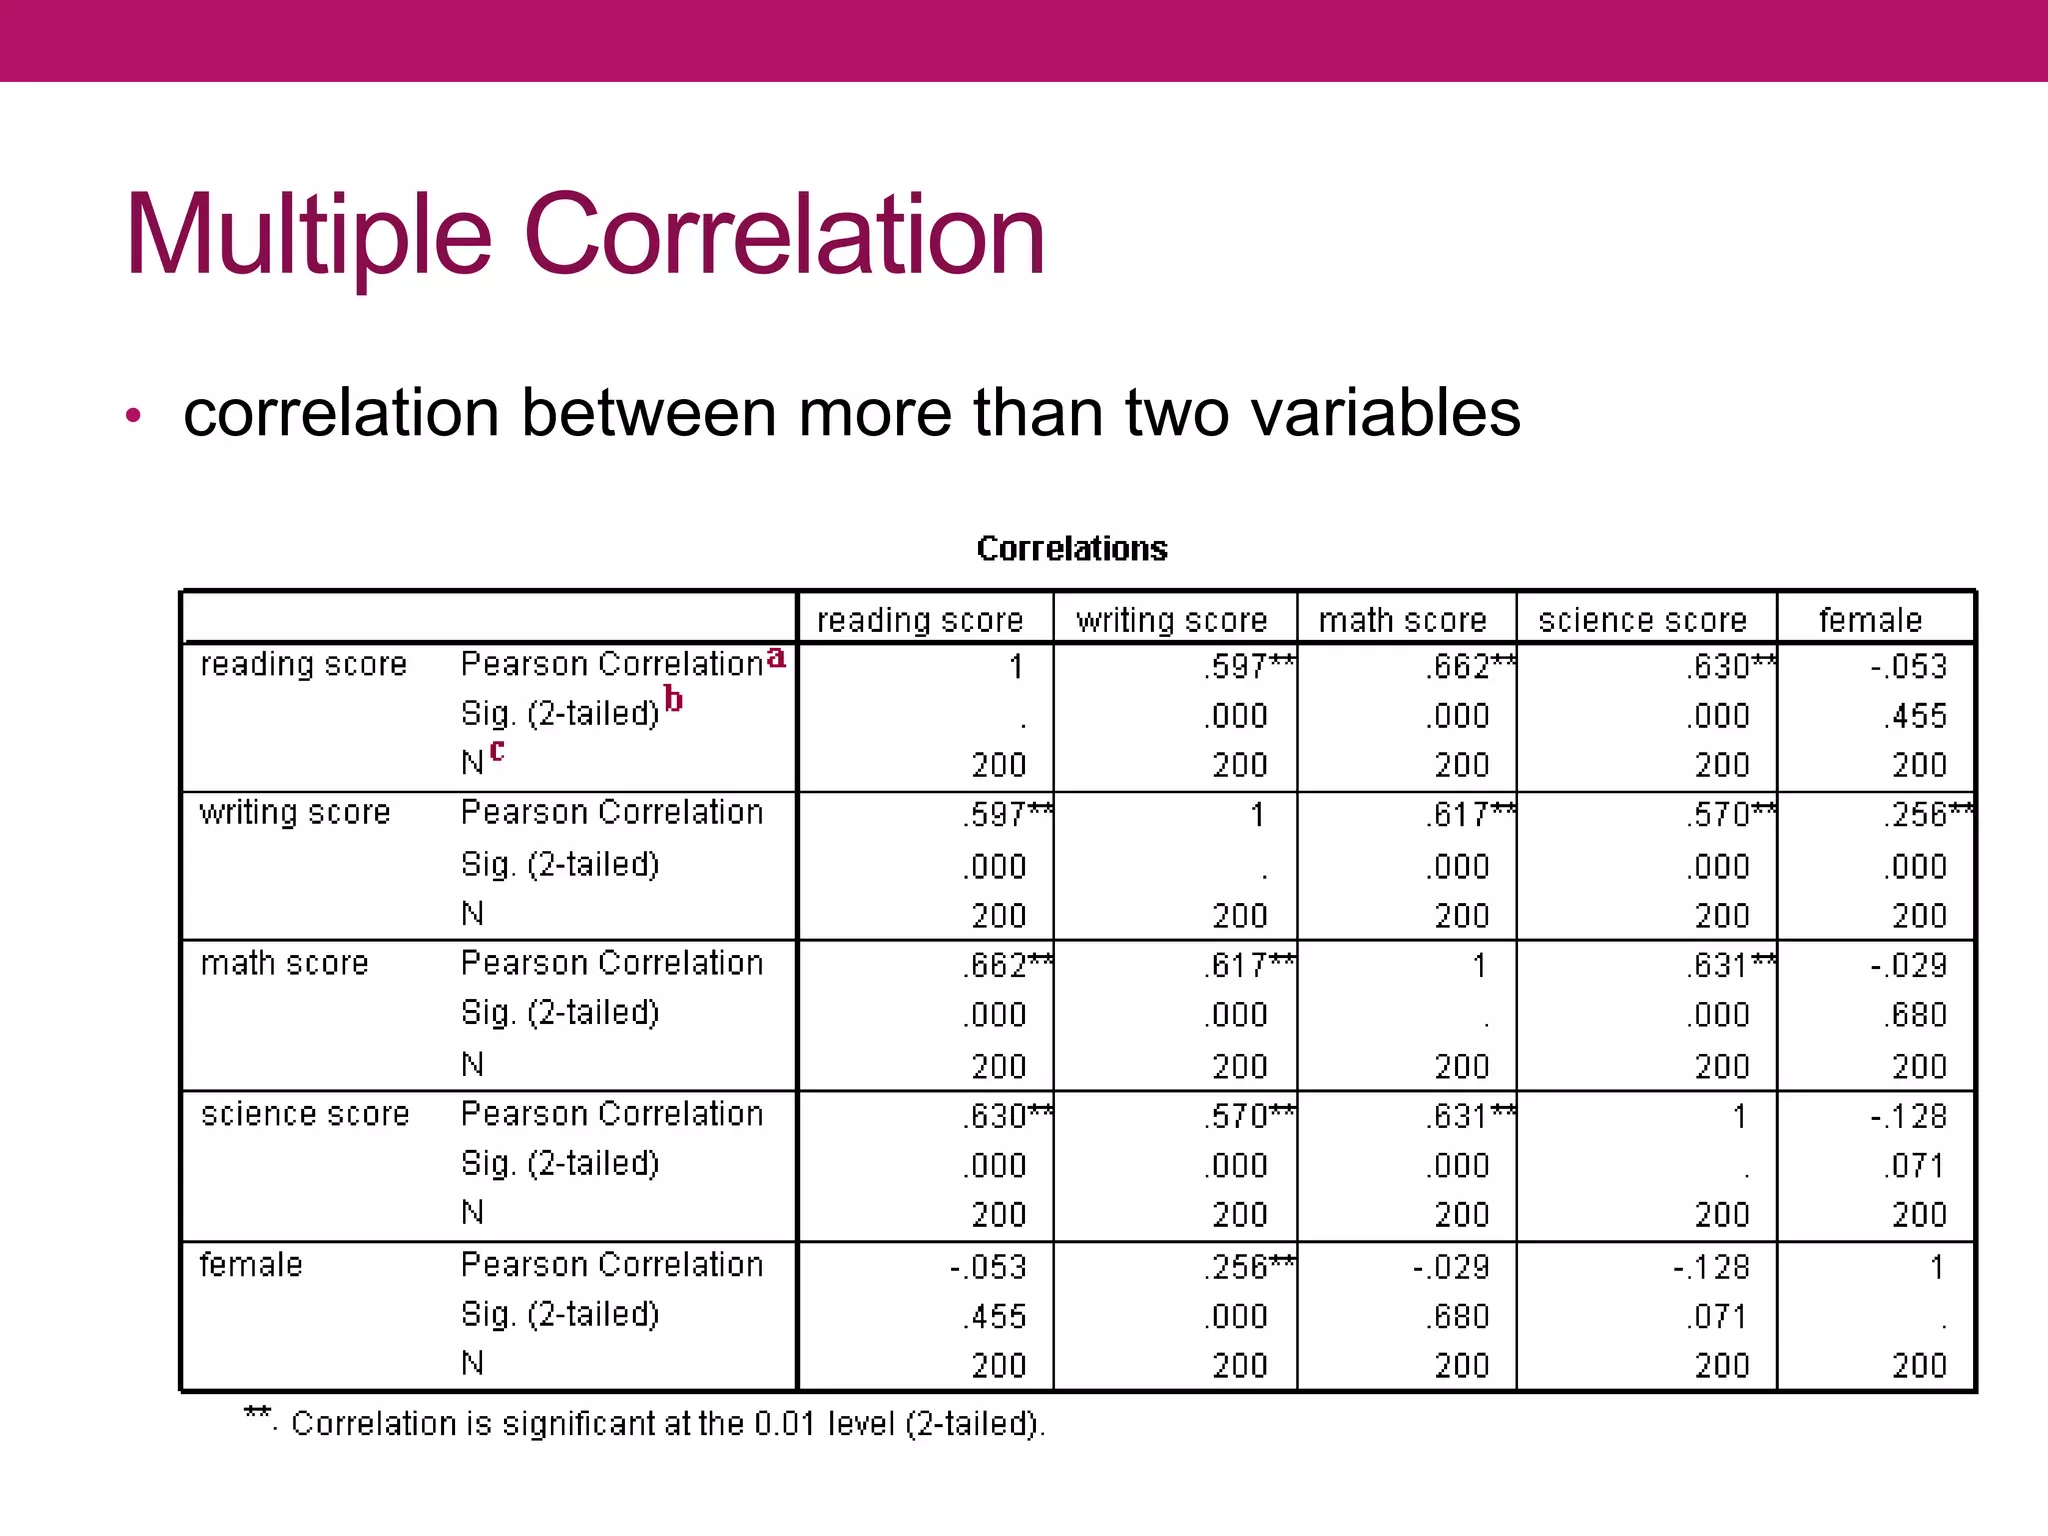
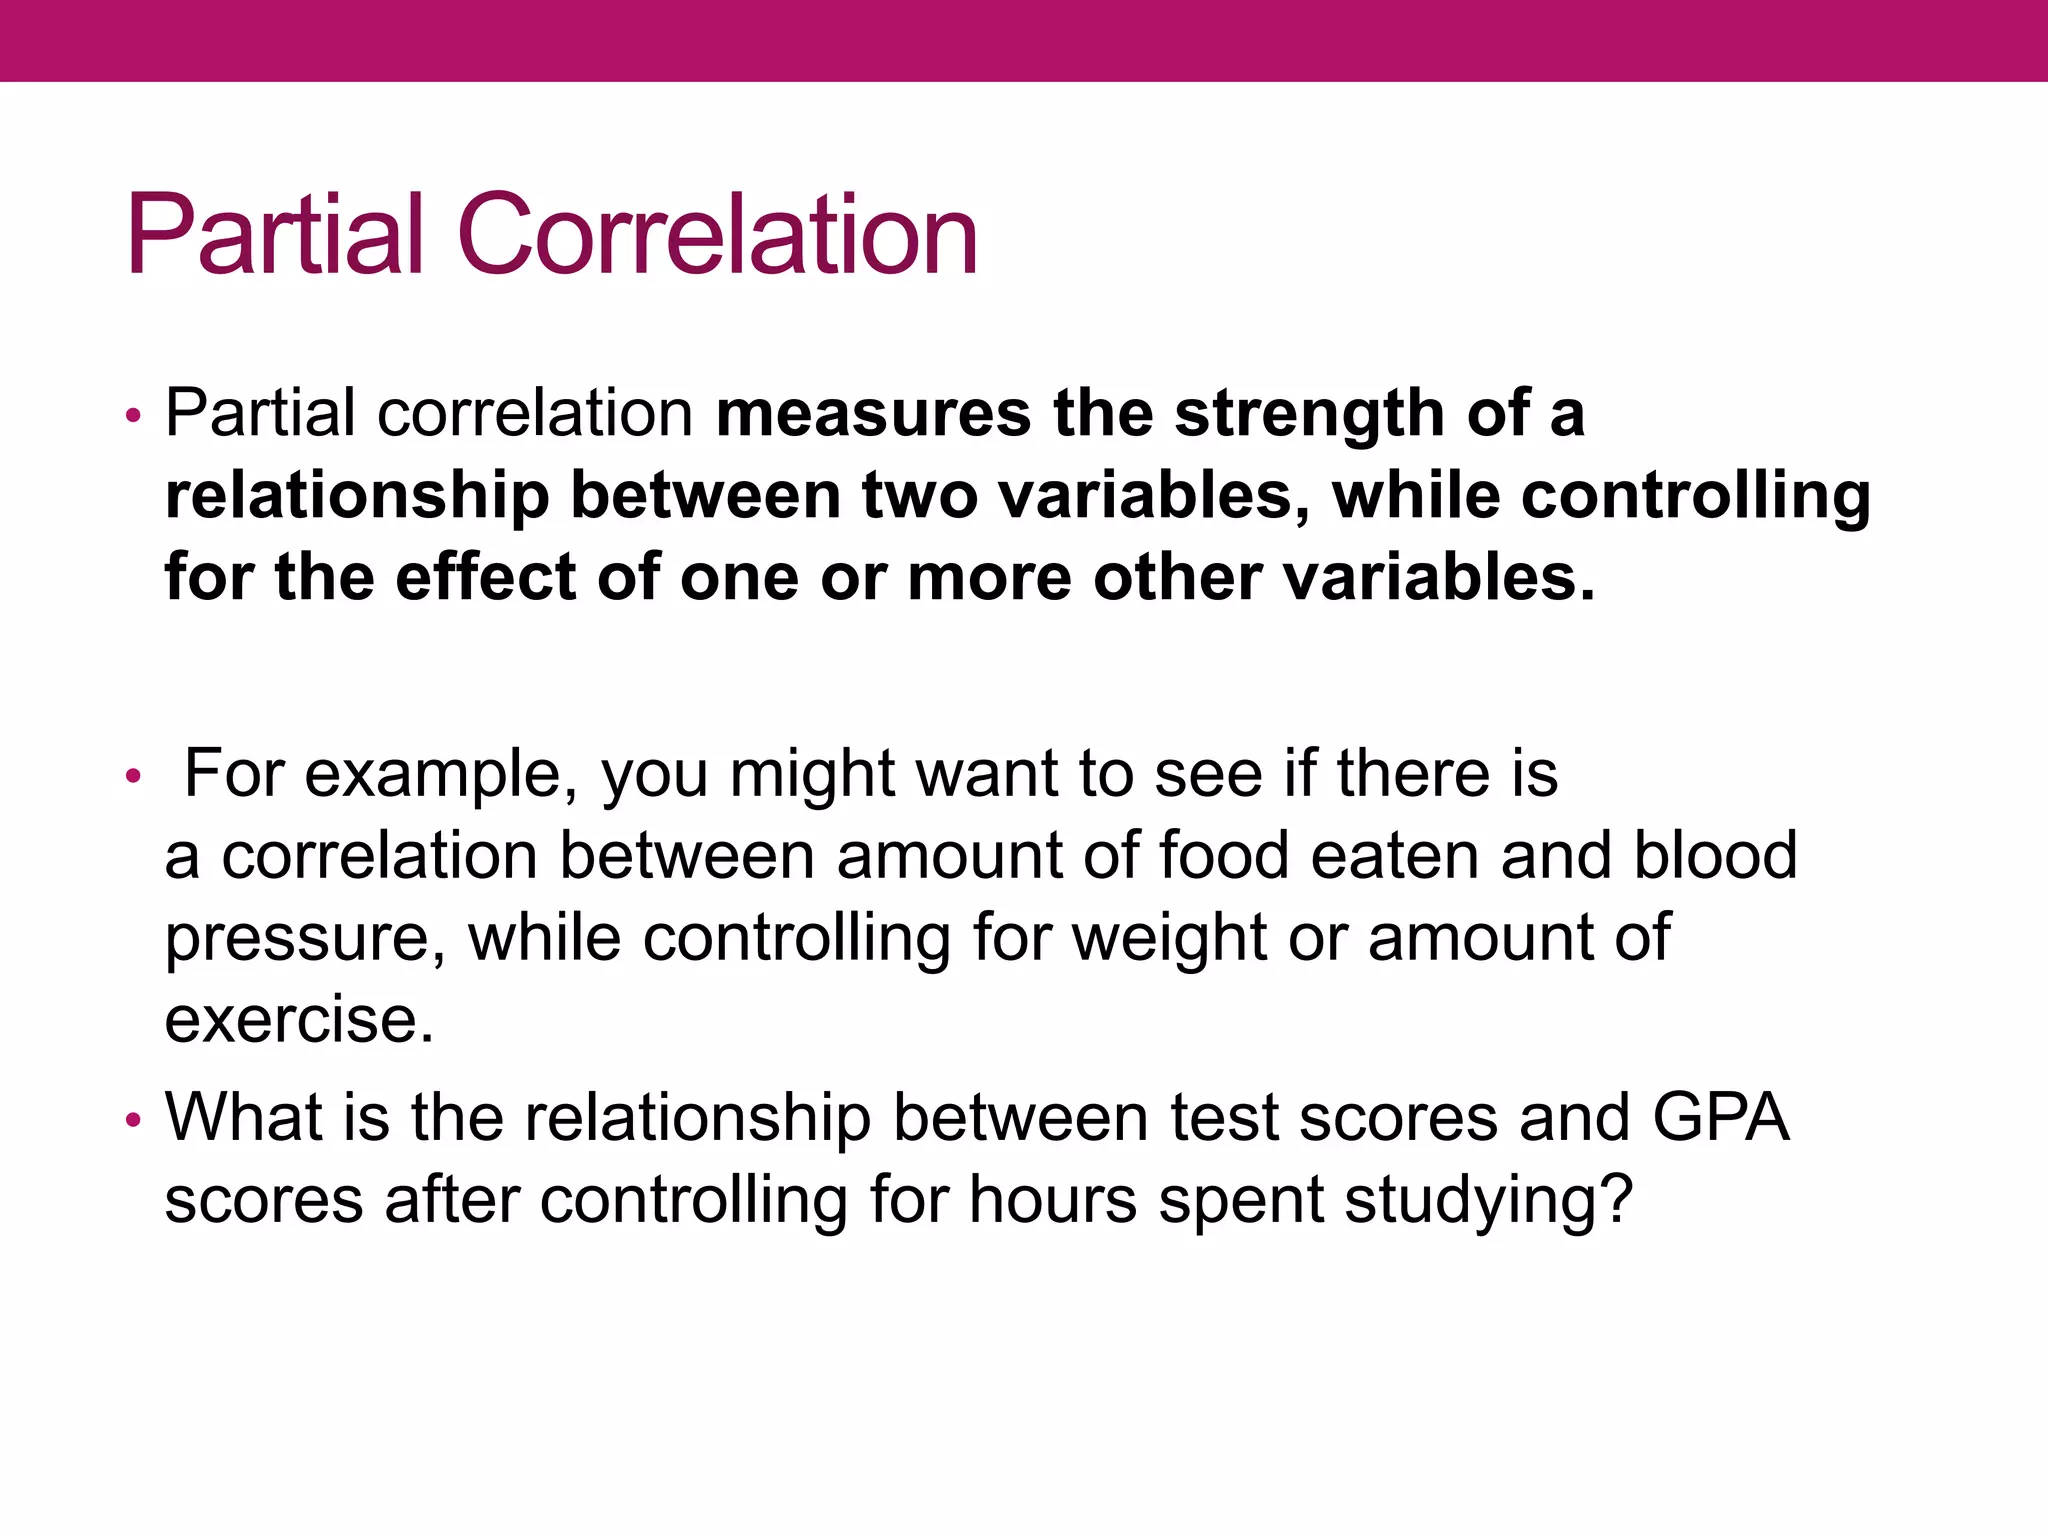
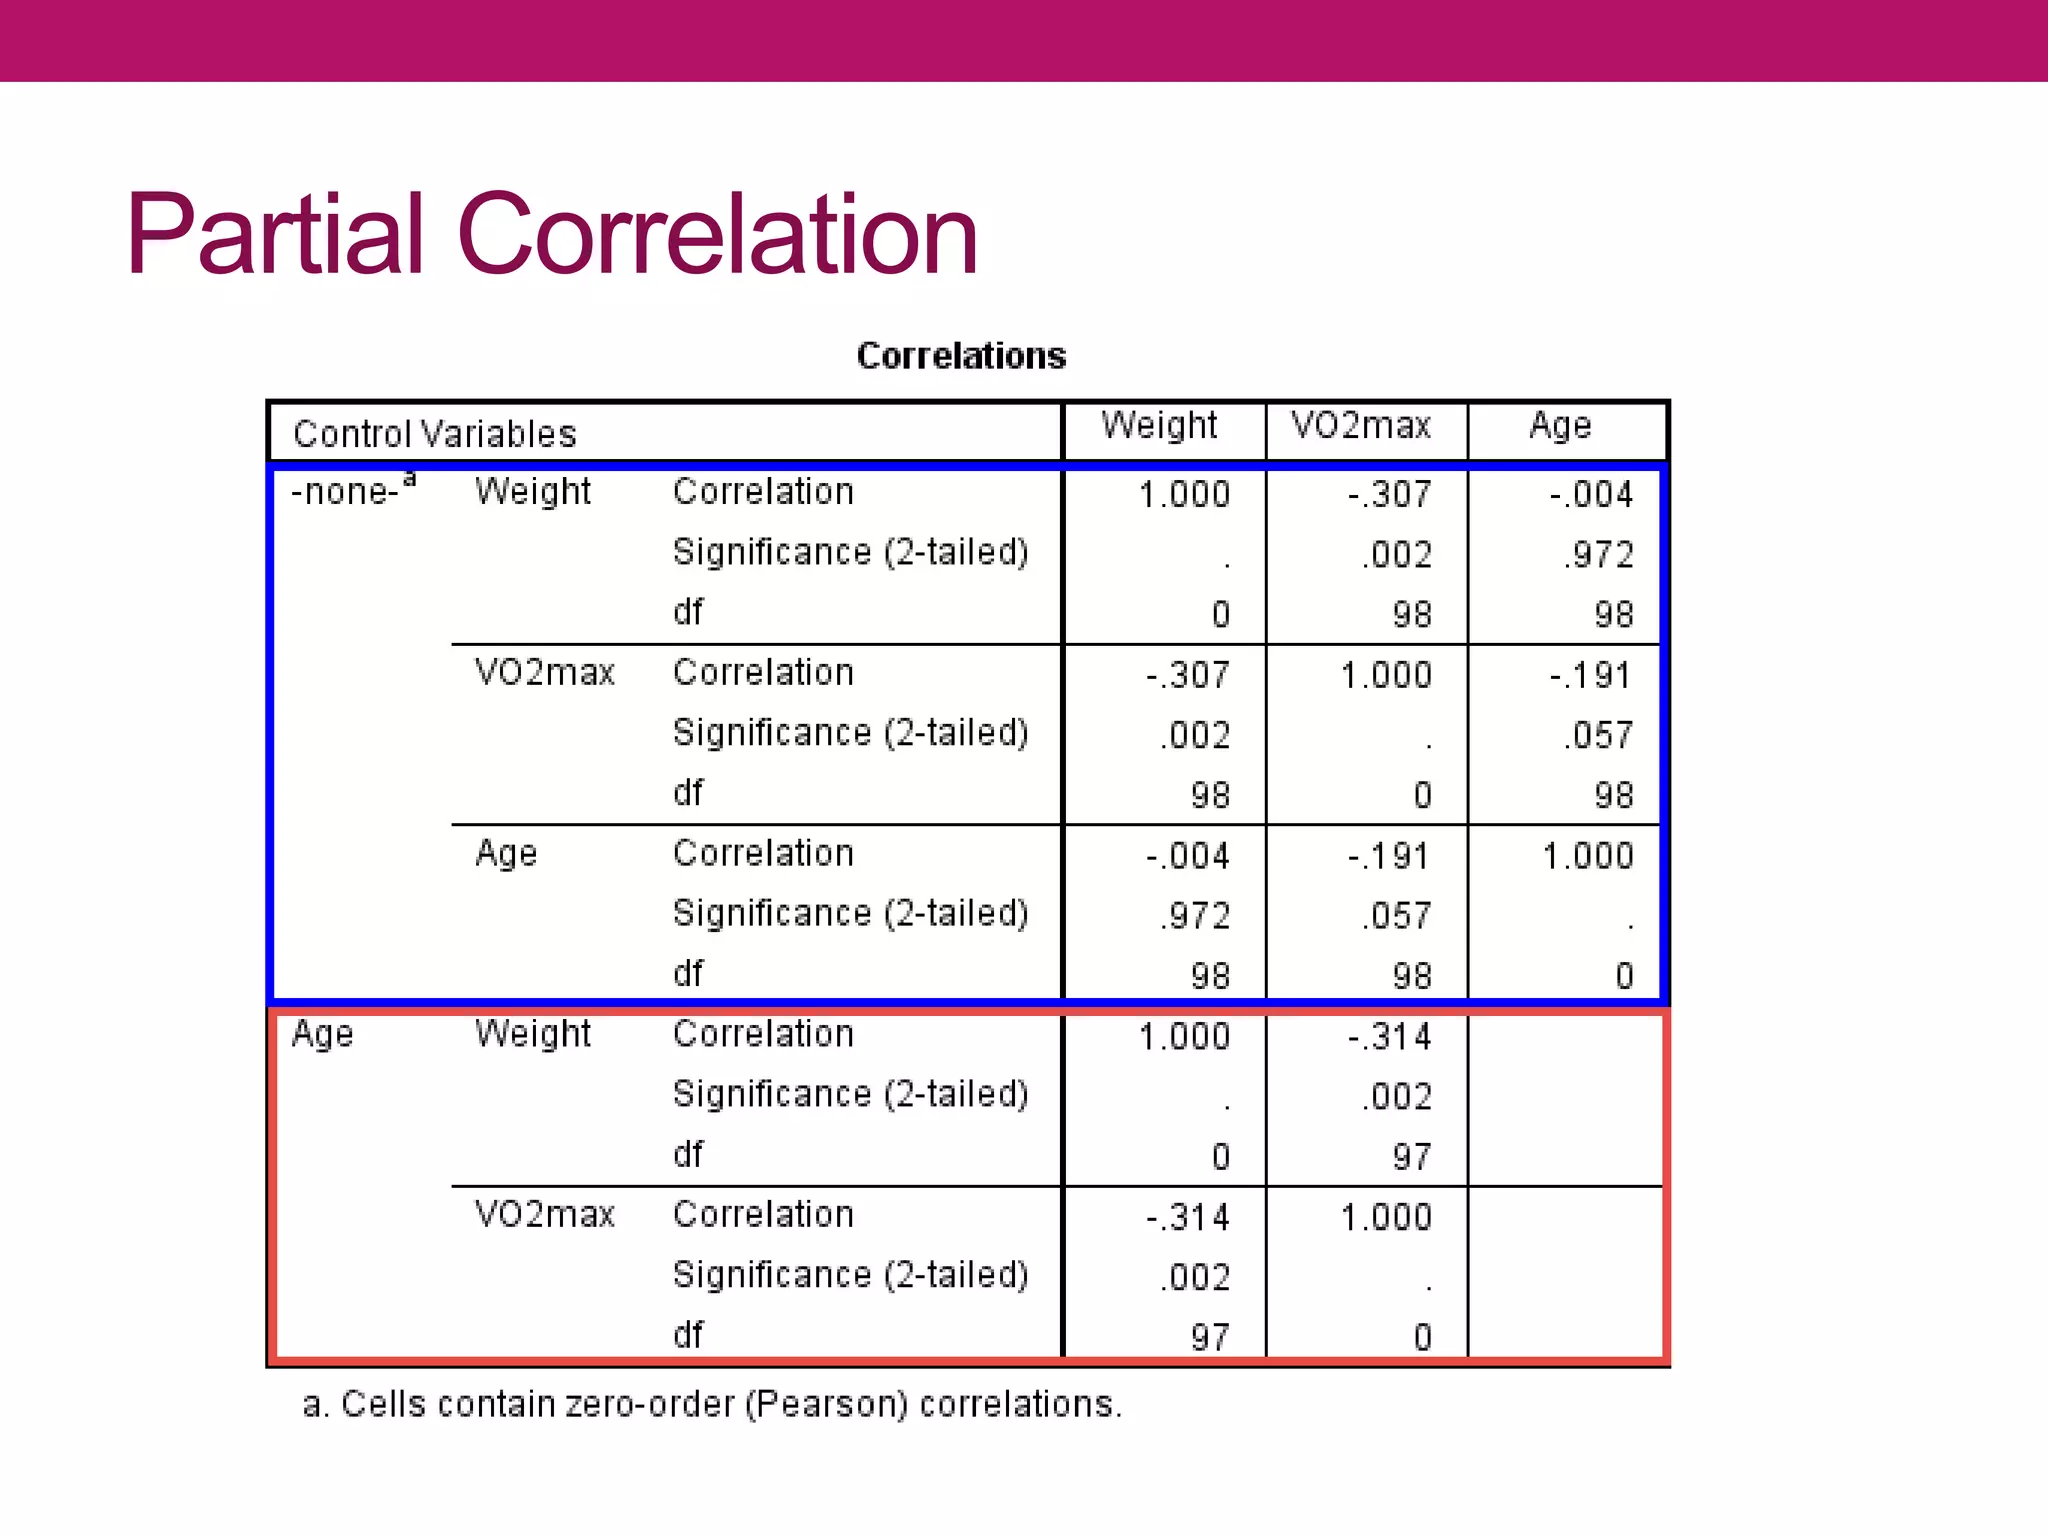

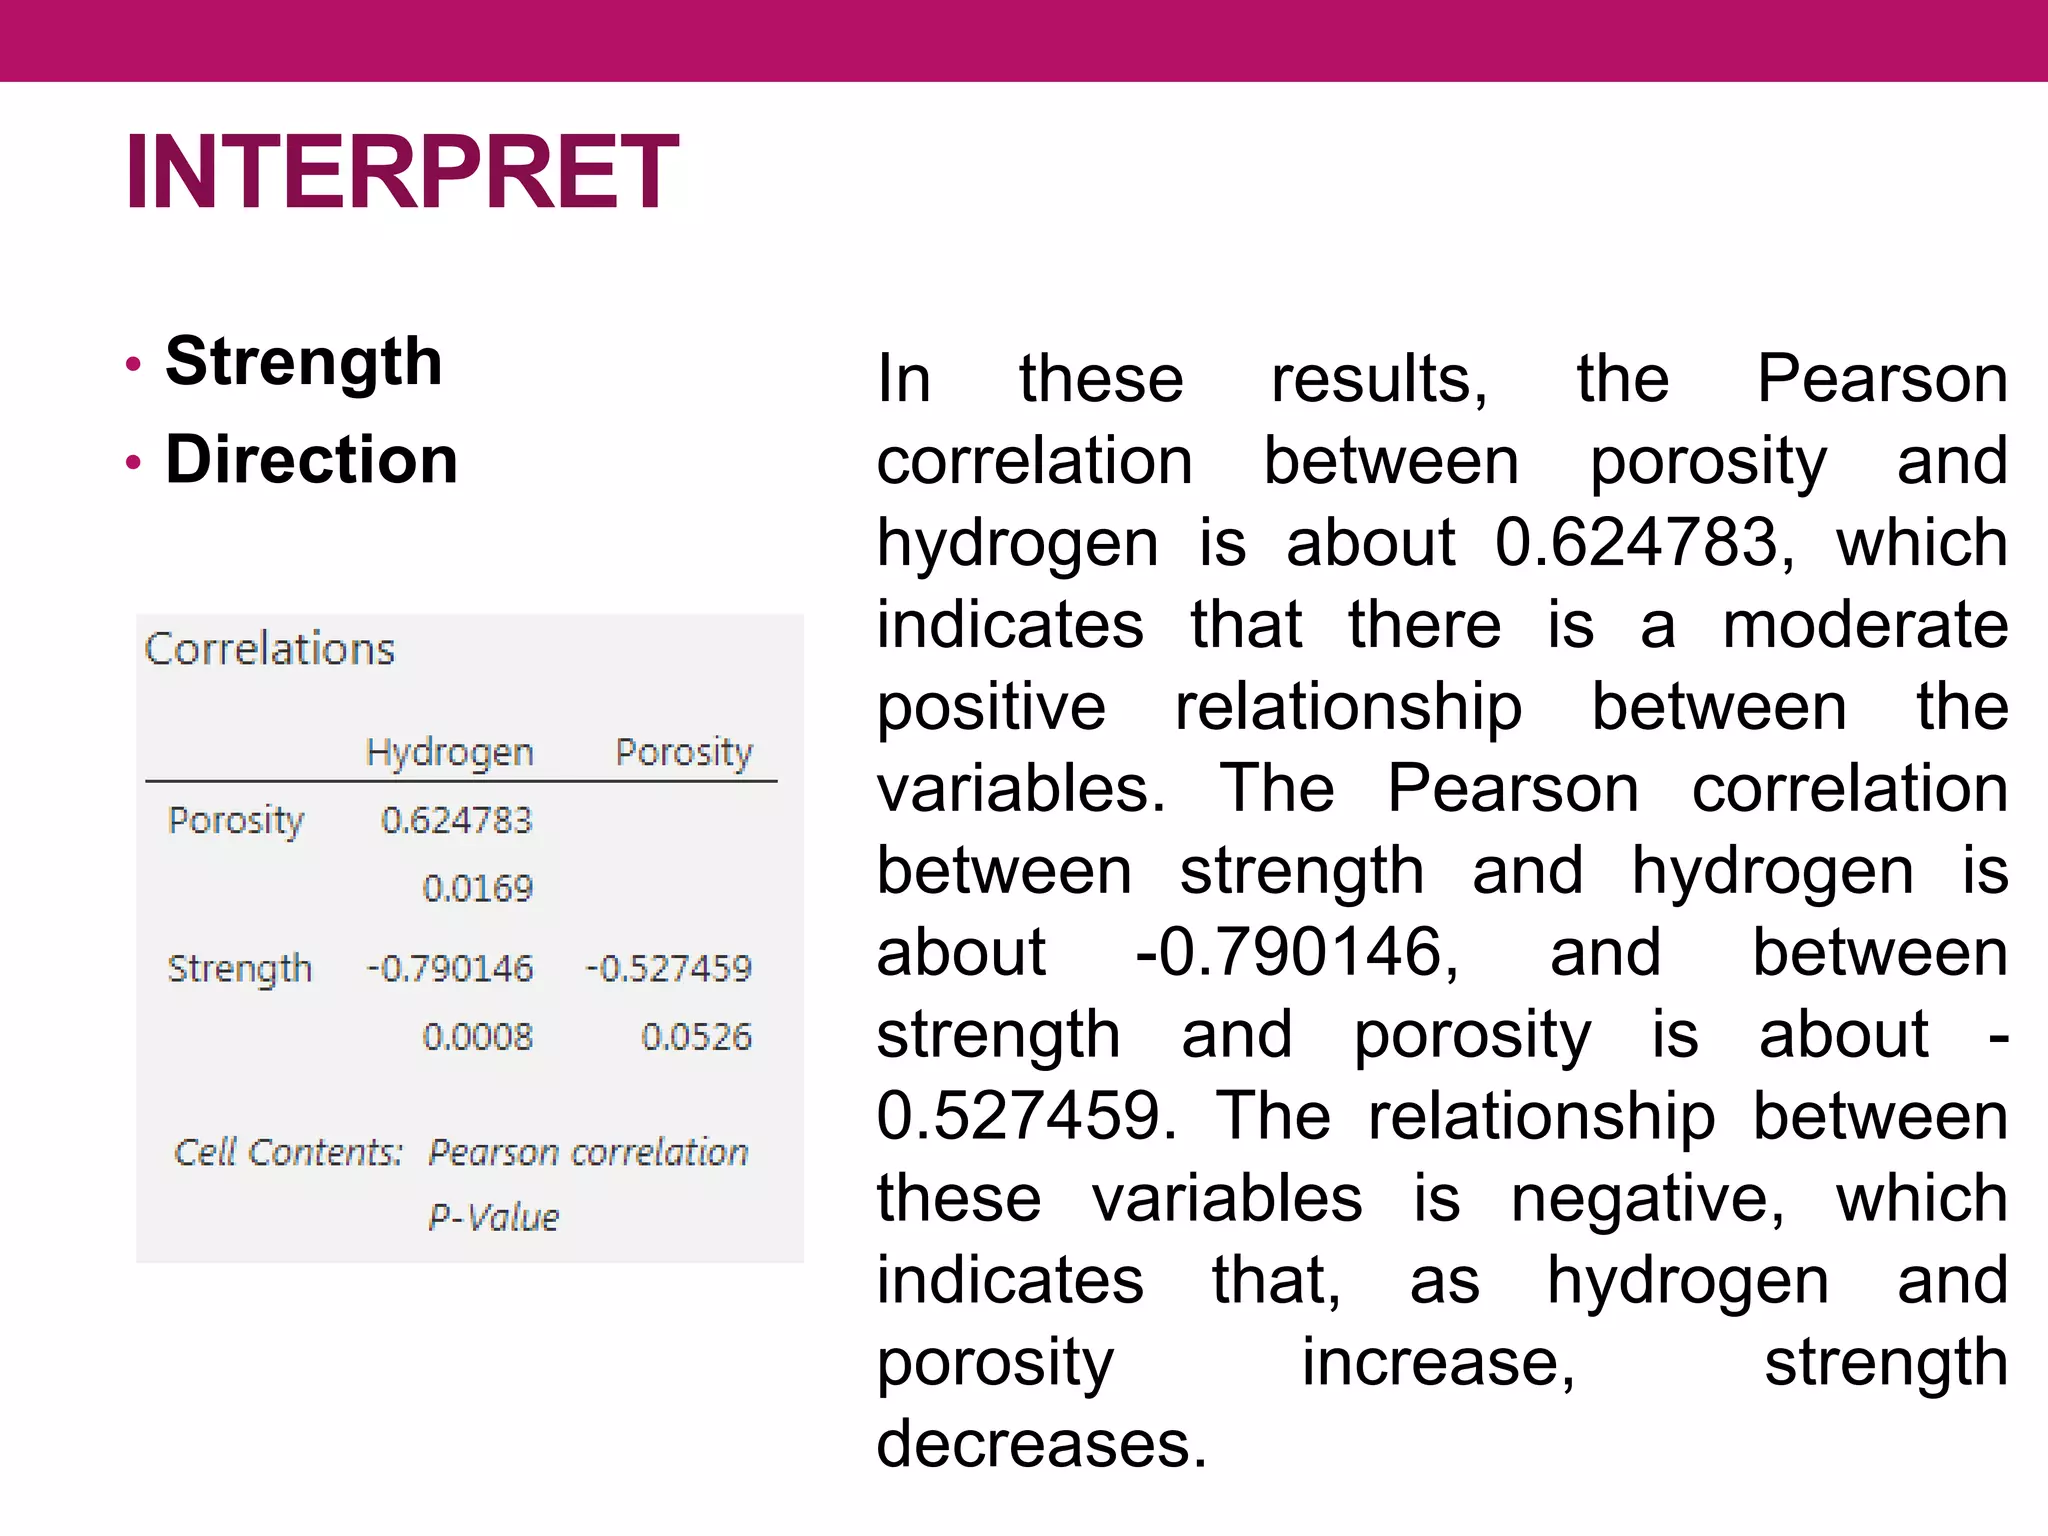
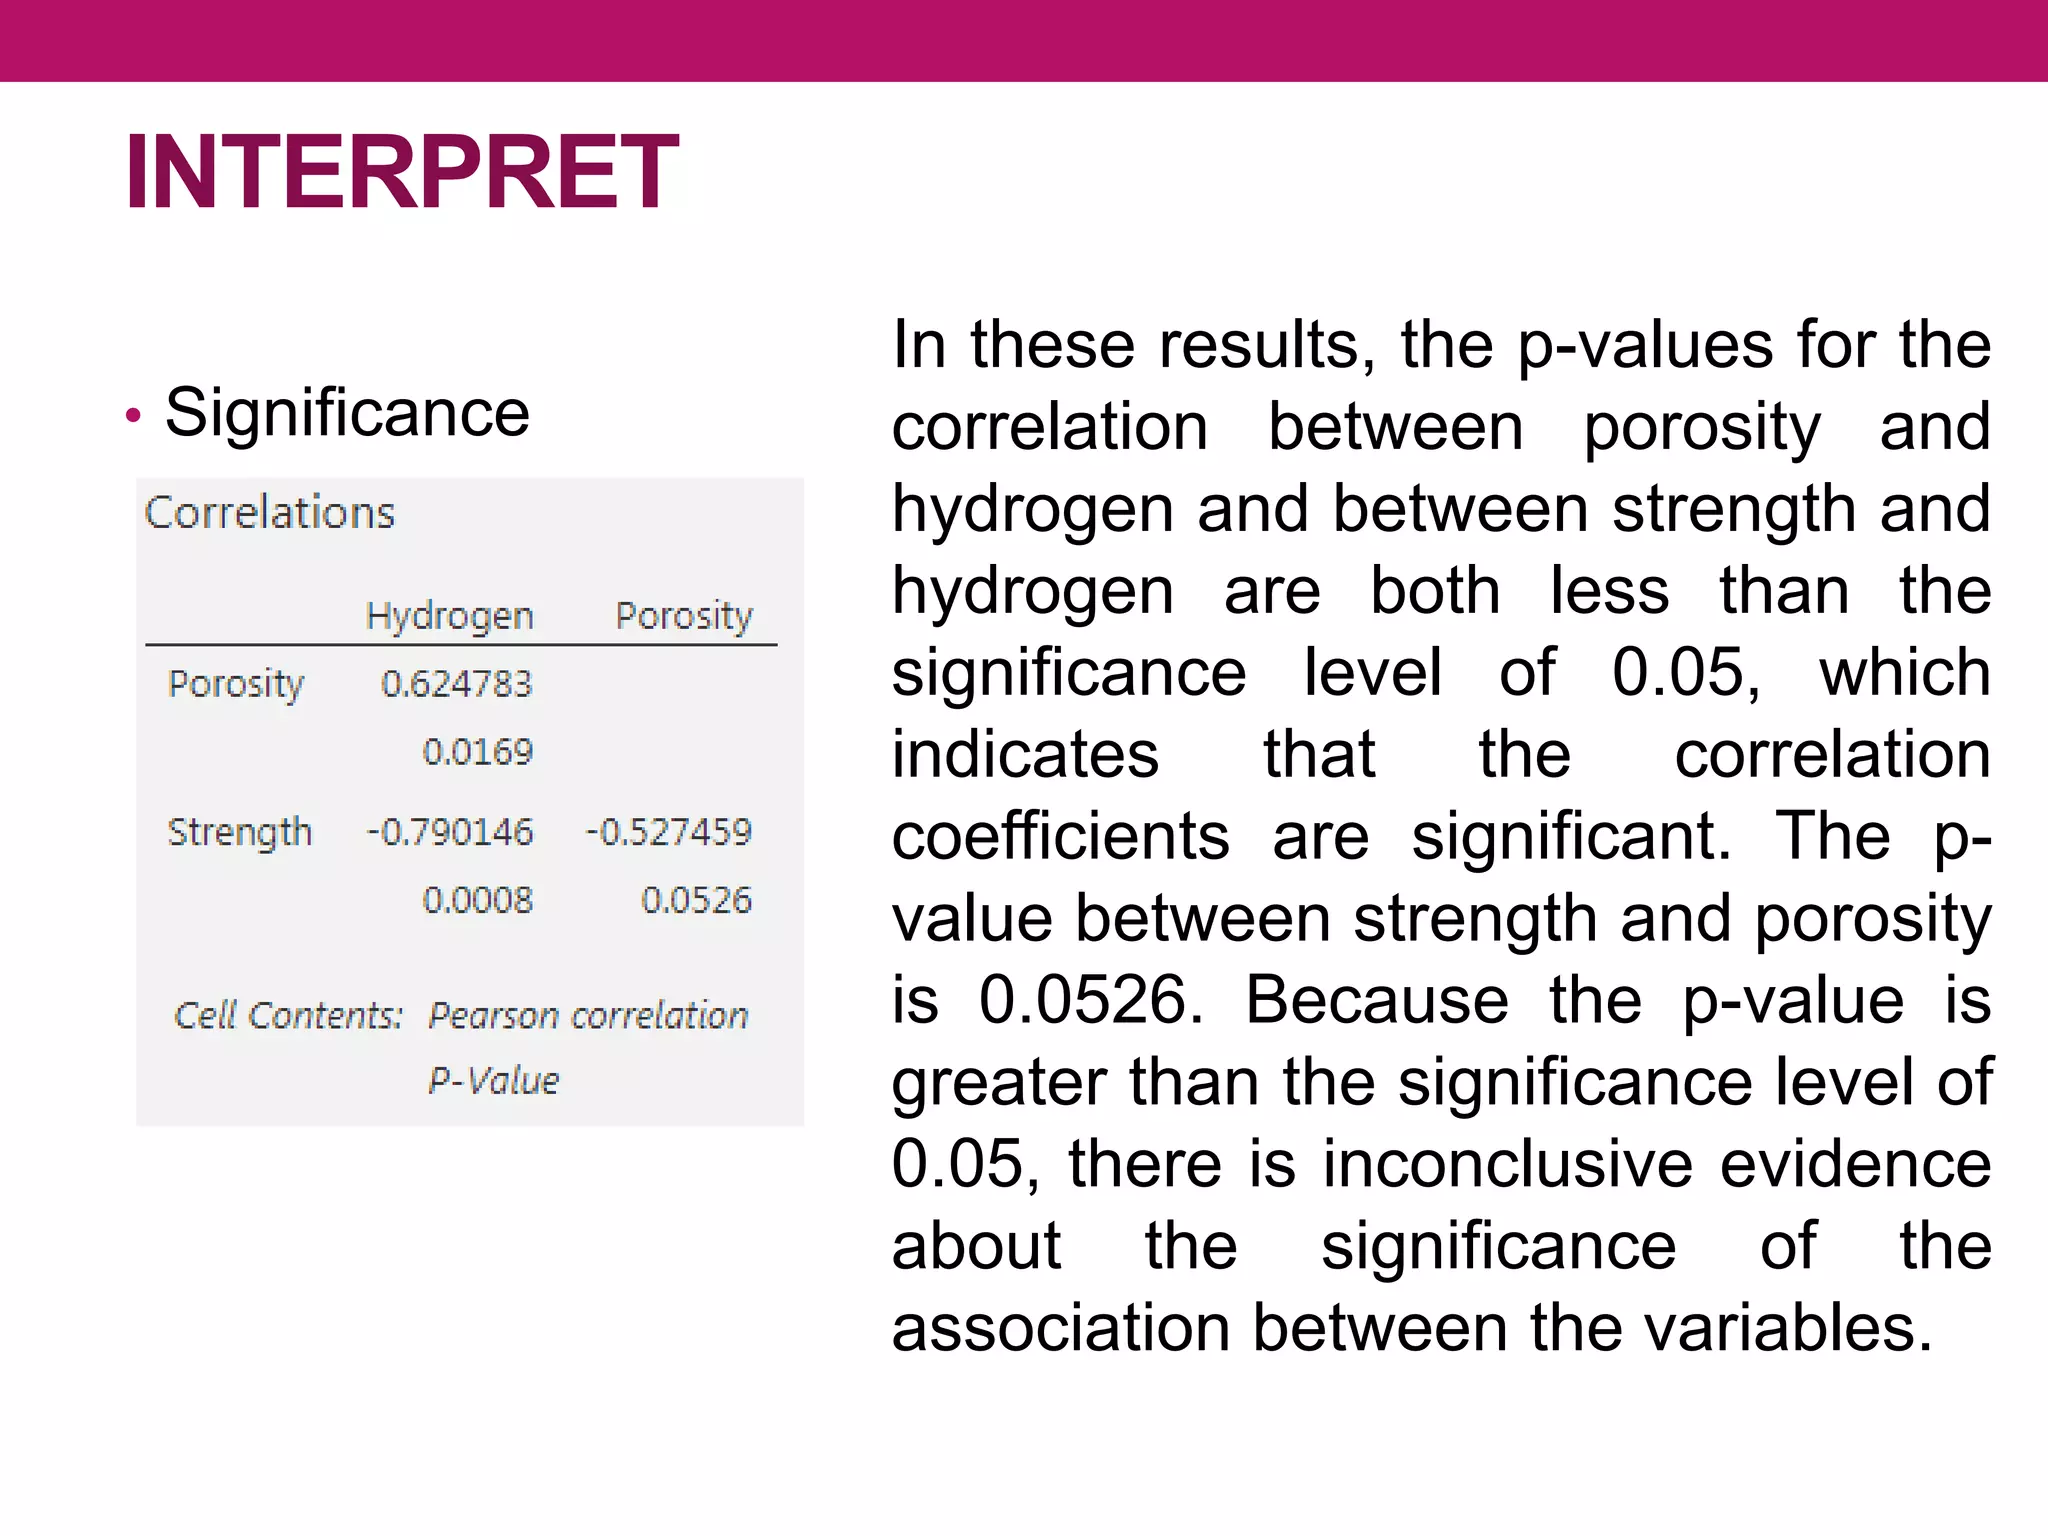

Correlation analysis is a statistical technique used to determine the degree of relationship between two quantitative variables. Scatterplots are used to graphically depict the relationship and identify if it is positive, negative, or no correlation. The correlation coefficient measures the strength and direction of correlation, ranging from -1 to 1. A significance test determines if a correlation is likely to have occurred by chance or is statistically significant. Different types of correlation include simple, multiple, partial, and autocorrelation.


![[DSC Europe 25] Branko Dzakula - From Defense to Attack: How AI Redefines Cyb...](https://cdn.slidesharecdn.com/ss_thumbnails/80bdzdxpr3ky2g0qvyk9-8-251211083048-ce5fc1ee-thumbnail.jpg?width=640&height=640&fit=bounds)


![[DSC Europe 25] Kaja Kandare - LLM as a judge.pptx](https://cdn.slidesharecdn.com/ss_thumbnails/arxyccaxsdsd1ba99wjw-7-251212104007-2b4e3f64-thumbnail.jpg?width=640&height=640&fit=bounds)
![[DSC Europe 25] Debmalya Biswas - Agentification: the art of transforming man...](https://cdn.slidesharecdn.com/ss_thumbnails/r5azlggvtqiaiiusrqdr-4-251212103249-5a12c89b-thumbnail.jpg?width=640&height=640&fit=bounds)