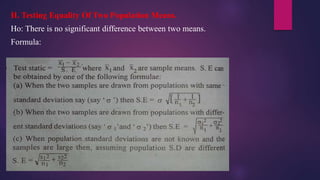
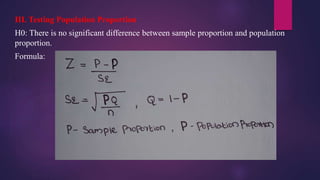
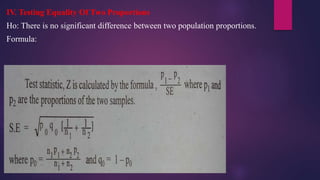
SlideShare a Scribd company logo
Z - Test
FEMY MONI
ASSISTANT PROFESSOR
ST. ALOYSIUS COLLEGEELTHURUTH
INTRODUCTION
 Statistical test of hypothesis is the test conducted to accept or reject the hypothesis.
Commonly used statistical tests are Z-test, t-test, chi-square test, F-test.
 The decision to accept or reject the null hypothesis is made on the basis of a statistic
computed from the sample. Such statistic is known as test statistic (Z, t, F, chi-square).
 Parametric tests are those that make assumptions about the parameters of the population
distribution from which the sample is drawn. This is often the assumption that the
population data are normally distributed.
 Non-parametric tests are “distribution-free” and, as such, can be used for non-Normal
variables.
Z- TEST
 Z - test is a statistical tool used for the comparison or determination of the significance of
several statistical measures, particularly the mean in a sample from a normally distributed
population or between two independent samples.
 Z - tests are also based on normal probability distribution.
 Z - test is the most commonly used statistical tool in research methodology.
 Z - test is a Parametric test.
USES OF Z-TEST
1. To test the given population mean when the sample is large (30 or more) or when the population
SD is known.
2. To test the equality of two sample means when the samples are large (30 or more) or when the
population SD is known.
3. To test the population proportion.
4. To test the equality of two sample proportions.
5. To test the population SD when the sample is large.
6. To test the equality of two sample standard deviations when the samples are large or when
population standard deviations are known.
7. To test the equality of correlation coefficients.
ASSUMPTIONS
1. Sampling distribution of test statistic is normal.
2. Sample statistics are close to the population parameter and therefore for finding standard
error, sample statistics are used in places where population parameters are to be used.
STEPS IN CALCULATION
Step 1 : Formulate the hypothesis
Ho : which is stated for the purpose of possible
acceptance. It is the original hypothesis.
H1 : hypothesis other than null hypothesis is called
alternative hypothesis.
Step 2: Deciding the level of significance
The level of significance is the probability of rejecting the null hypothesis when it is true,
also known as alpha or ' α '. The commonly used level of significance is either 0.05 or
0.01.
Critical Region
The critical region is called the region of rejection.It is the region in which the null
hypothesis is rejected. The are of critical region is equal to the level of significance, α.
Step 3: Calculation of the value
I. Testing The Given Population Mean
Ho: There is no significant difference between sample mean and population mean.
Formula:
II. Testing Equality Of Two Population Means.
Ho: There is no significant difference between two means.
Formula:
III. Testing Population Proportion
H0: There is no significant difference between sample proportion and population
proportion.
Formula:
IV. Testing Equality Of Two Proportions
Ho: There is no significant difference between two population proportions.
Formula:
V. Significance Of Difference Between
Sample SD And Population SD
Ho: There is no significant difference between sample SD and population SD.
Formula:
VI. Significance Of Difference Between
Standard Deviations Of Two Populations
Ho: There is no significant difference between two standard deviations.
Formula:
Step 4: Obtaining the table value and making the decision
The table value is obtained from the 'Table values of z for z - test' by locating the level of
significance and degree of freedom.
For z - test, the degree of freedom is infinity
The decision to accept or reject the null hypothesis is made when;
Calculated value < Table value = Accept Ho
Calculated value > Table value = Reject Ho
ADVANTAGES
1. It is a straightforward and reliable test.
2. A Z-score can be used for a comparison of raw scores obtained from different tests.
3. While comparing a set of raw scores, the Z-score considers both the average value and
the variability of those scores.
DISADVANTAGES
1. Z-test requires a known standard deviation which is not always possible.
2. It cannot be conducted with a smaller sample size (less than 30).

More Related Content

What's hot

Hypothesis testing ppt final
Hypothesis testing ppt finalHypothesis testing ppt final
Hypothesis testing ppt final
piyushdhaker
 

What's hot (20)

Student t test
Student t testStudent t test
Student t test
 
Parametric tests
Parametric testsParametric tests
Parametric tests
 
T test statistics
T test statisticsT test statistics
T test statistics
 
Correlation
CorrelationCorrelation
Correlation
 
Student t-test
Student t-testStudent t-test
Student t-test
 
F test and ANOVA
F test and ANOVAF test and ANOVA
F test and ANOVA
 
Regression
RegressionRegression
Regression
 
Correlation Analysis
Correlation AnalysisCorrelation Analysis
Correlation Analysis
 
Parametric Test
Parametric TestParametric Test
Parametric Test
 
Sign test
Sign testSign test
Sign test
 
LEVEL OF SIGNIFICANCE.pptx
LEVEL OF SIGNIFICANCE.pptxLEVEL OF SIGNIFICANCE.pptx
LEVEL OF SIGNIFICANCE.pptx
 
Hypothesis Testing
Hypothesis TestingHypothesis Testing
Hypothesis Testing
 
Standard deviation
Standard deviationStandard deviation
Standard deviation
 
F test
F testF test
F test
 
Coefficient of variation
Coefficient of variationCoefficient of variation
Coefficient of variation
 
PROCEDURE FOR TESTING HYPOTHESIS
PROCEDURE FOR   TESTING HYPOTHESIS PROCEDURE FOR   TESTING HYPOTHESIS
PROCEDURE FOR TESTING HYPOTHESIS
 
Regression analysis.
Regression analysis.Regression analysis.
Regression analysis.
 
HYPOTHESIS TESTING.ppt
HYPOTHESIS TESTING.pptHYPOTHESIS TESTING.ppt
HYPOTHESIS TESTING.ppt
 
Hypothesis testing ppt final
Hypothesis testing ppt finalHypothesis testing ppt final
Hypothesis testing ppt final
 
Measure of Dispersion in statistics
Measure of Dispersion in statisticsMeasure of Dispersion in statistics
Measure of Dispersion in statistics
 

Similar to Z-test

Parametric vs non parametric test
Parametric vs non parametric testParametric vs non parametric test
Parametric vs non parametric test
ar9530
 
Review Z Test Ci 1
Review Z Test Ci 1Review Z Test Ci 1
Review Z Test Ci 1
shoffma5
 

Similar to Z-test (20)

Tests of significance
Tests of significanceTests of significance
Tests of significance
 
Parametric vs non parametric test
Parametric vs non parametric testParametric vs non parametric test
Parametric vs non parametric test
 
Testing of hypothesis and Goodness of fit
Testing of hypothesis and Goodness of fitTesting of hypothesis and Goodness of fit
Testing of hypothesis and Goodness of fit
 
Testing Of Hypothesis
Testing Of HypothesisTesting Of Hypothesis
Testing Of Hypothesis
 
Basic of Statistical Inference Part-V: Types of Hypothesis Test (Parametric)
Basic of Statistical Inference Part-V: Types of Hypothesis Test (Parametric) Basic of Statistical Inference Part-V: Types of Hypothesis Test (Parametric)
Basic of Statistical Inference Part-V: Types of Hypothesis Test (Parametric)
 
Hypothesis and its important parametric tests
Hypothesis and its important parametric testsHypothesis and its important parametric tests
Hypothesis and its important parametric tests
 
Unit 4 Tests of Significance
Unit 4 Tests of SignificanceUnit 4 Tests of Significance
Unit 4 Tests of Significance
 
tests of significance
tests of significancetests of significance
tests of significance
 
Himani
HimaniHimani
Himani
 
Himani sharma
Himani sharmaHimani sharma
Himani sharma
 
Hypothesis testing
Hypothesis testingHypothesis testing
Hypothesis testing
 
TEST OF SIGNIFICANCE.pptx
TEST OF SIGNIFICANCE.pptxTEST OF SIGNIFICANCE.pptx
TEST OF SIGNIFICANCE.pptx
 
20200519073328de6dca404c.pdfkshhjejhehdhd
20200519073328de6dca404c.pdfkshhjejhehdhd20200519073328de6dca404c.pdfkshhjejhehdhd
20200519073328de6dca404c.pdfkshhjejhehdhd
 
Hypothesis
HypothesisHypothesis
Hypothesis
 
Testing of hypothesis
Testing of hypothesisTesting of hypothesis
Testing of hypothesis
 
Review Z Test Ci 1
Review Z Test Ci 1Review Z Test Ci 1
Review Z Test Ci 1
 
Tests of significance Periodontology
Tests of significance PeriodontologyTests of significance Periodontology
Tests of significance Periodontology
 
Inferential statistics_AAF 500L 2021.ppt
Inferential statistics_AAF 500L 2021.pptInferential statistics_AAF 500L 2021.ppt
Inferential statistics_AAF 500L 2021.ppt
 
Stat topics
Stat topicsStat topics
Stat topics
 
Parametric tests
Parametric  testsParametric  tests
Parametric tests
 

More from femymoni (9)

INTRODUCTION TO CORPORATE GOVERNANCE.pdf
INTRODUCTION TO CORPORATE GOVERNANCE.pdfINTRODUCTION TO CORPORATE GOVERNANCE.pdf
INTRODUCTION TO CORPORATE GOVERNANCE.pdf
 
INTRODUCTION TO CORPORATE GOVERNANCE.pdf
INTRODUCTION TO CORPORATE GOVERNANCE.pdfINTRODUCTION TO CORPORATE GOVERNANCE.pdf
INTRODUCTION TO CORPORATE GOVERNANCE.pdf
 
INTRODUCTION TO CORPORATE GOVERNANCE.pptx
 INTRODUCTION TO CORPORATE GOVERNANCE.pptx INTRODUCTION TO CORPORATE GOVERNANCE.pptx
INTRODUCTION TO CORPORATE GOVERNANCE.pptx
 
Multinational Corporations
Multinational CorporationsMultinational Corporations
Multinational Corporations
 
IMPACT OF ICT ON FINANCIAL SERVICE SECTOR
IMPACT OF ICT ON FINANCIAL SERVICE SECTORIMPACT OF ICT ON FINANCIAL SERVICE SECTOR
IMPACT OF ICT ON FINANCIAL SERVICE SECTOR
 
E banking
E bankingE banking
E banking
 
ICT Initiatives of Ministry of Education
ICT Initiatives of Ministry of EducationICT Initiatives of Ministry of Education
ICT Initiatives of Ministry of Education
 
Incomeandexpenditure account
Incomeandexpenditure accountIncomeandexpenditure account
Incomeandexpenditure account
 
Swayam
SwayamSwayam
Swayam
 

Recently uploaded

Recently uploaded (20)

How to the fix Attribute Error in odoo 17
How to the fix Attribute Error in odoo 17How to the fix Attribute Error in odoo 17
How to the fix Attribute Error in odoo 17
 
UNIT – IV_PCI Complaints: Complaints and evaluation of complaints, Handling o...
UNIT – IV_PCI Complaints: Complaints and evaluation of complaints, Handling o...UNIT – IV_PCI Complaints: Complaints and evaluation of complaints, Handling o...
UNIT – IV_PCI Complaints: Complaints and evaluation of complaints, Handling o...
 
Introduction to Quality Improvement Essentials
Introduction to Quality Improvement EssentialsIntroduction to Quality Improvement Essentials
Introduction to Quality Improvement Essentials
 
Application of Matrices in real life. Presentation on application of matrices
Application of Matrices in real life. Presentation on application of matricesApplication of Matrices in real life. Presentation on application of matrices
Application of Matrices in real life. Presentation on application of matrices
 
Morse OER Some Benefits and Challenges.pptx
Morse OER Some Benefits and Challenges.pptxMorse OER Some Benefits and Challenges.pptx
Morse OER Some Benefits and Challenges.pptx
 
Basic Civil Engineering Notes of Chapter-6, Topic- Ecosystem, Biodiversity G...
Basic Civil Engineering Notes of Chapter-6,  Topic- Ecosystem, Biodiversity G...Basic Civil Engineering Notes of Chapter-6,  Topic- Ecosystem, Biodiversity G...
Basic Civil Engineering Notes of Chapter-6, Topic- Ecosystem, Biodiversity G...
 
Salient features of Environment protection Act 1986.pptx
Salient features of Environment protection Act 1986.pptxSalient features of Environment protection Act 1986.pptx
Salient features of Environment protection Act 1986.pptx
 
The Art Pastor's Guide to Sabbath | Steve Thomason
The Art Pastor's Guide to Sabbath | Steve ThomasonThe Art Pastor's Guide to Sabbath | Steve Thomason
The Art Pastor's Guide to Sabbath | Steve Thomason
 
[GDSC YCCE] Build with AI Online Presentation
[GDSC YCCE] Build with AI Online Presentation[GDSC YCCE] Build with AI Online Presentation
[GDSC YCCE] Build with AI Online Presentation
 
Basic_QTL_Marker-assisted_Selection_Sourabh.ppt
Basic_QTL_Marker-assisted_Selection_Sourabh.pptBasic_QTL_Marker-assisted_Selection_Sourabh.ppt
Basic_QTL_Marker-assisted_Selection_Sourabh.ppt
 
Open Educational Resources Primer PowerPoint
Open Educational Resources Primer PowerPointOpen Educational Resources Primer PowerPoint
Open Educational Resources Primer PowerPoint
 
How to Manage Notification Preferences in the Odoo 17
How to Manage Notification Preferences in the Odoo 17How to Manage Notification Preferences in the Odoo 17
How to Manage Notification Preferences in the Odoo 17
 
MARUTI SUZUKI- A Successful Joint Venture in India.pptx
MARUTI SUZUKI- A Successful Joint Venture in India.pptxMARUTI SUZUKI- A Successful Joint Venture in India.pptx
MARUTI SUZUKI- A Successful Joint Venture in India.pptx
 
Benefits and Challenges of Using Open Educational Resources
Benefits and Challenges of Using Open Educational ResourcesBenefits and Challenges of Using Open Educational Resources
Benefits and Challenges of Using Open Educational Resources
 
Gyanartha SciBizTech Quiz slideshare.pptx
Gyanartha SciBizTech Quiz slideshare.pptxGyanartha SciBizTech Quiz slideshare.pptx
Gyanartha SciBizTech Quiz slideshare.pptx
 
PART A. Introduction to Costumer Service
PART A. Introduction to Costumer ServicePART A. Introduction to Costumer Service
PART A. Introduction to Costumer Service
 
B.ed spl. HI pdusu exam paper-2023-24.pdf
B.ed spl. HI pdusu exam paper-2023-24.pdfB.ed spl. HI pdusu exam paper-2023-24.pdf
B.ed spl. HI pdusu exam paper-2023-24.pdf
 
Sha'Carri Richardson Presentation 202345
Sha'Carri Richardson Presentation 202345Sha'Carri Richardson Presentation 202345
Sha'Carri Richardson Presentation 202345
 
Research Methods in Psychology | Cambridge AS Level | Cambridge Assessment In...
Research Methods in Psychology | Cambridge AS Level | Cambridge Assessment In...Research Methods in Psychology | Cambridge AS Level | Cambridge Assessment In...
Research Methods in Psychology | Cambridge AS Level | Cambridge Assessment In...
 
aaaaaaaaaaaaaaaaaaaaaaaaaaaaaaaaaaaaaaaaa
aaaaaaaaaaaaaaaaaaaaaaaaaaaaaaaaaaaaaaaaaaaaaaaaaaaaaaaaaaaaaaaaaaaaaaaaaaaaaaaaaa
aaaaaaaaaaaaaaaaaaaaaaaaaaaaaaaaaaaaaaaaa
 

Z-test

  • 1. Z - Test FEMY MONI ASSISTANT PROFESSOR ST. ALOYSIUS COLLEGEELTHURUTH
  • 2. INTRODUCTION  Statistical test of hypothesis is the test conducted to accept or reject the hypothesis. Commonly used statistical tests are Z-test, t-test, chi-square test, F-test.  The decision to accept or reject the null hypothesis is made on the basis of a statistic computed from the sample. Such statistic is known as test statistic (Z, t, F, chi-square).  Parametric tests are those that make assumptions about the parameters of the population distribution from which the sample is drawn. This is often the assumption that the population data are normally distributed.  Non-parametric tests are “distribution-free” and, as such, can be used for non-Normal variables.
  • 3. Z- TEST  Z - test is a statistical tool used for the comparison or determination of the significance of several statistical measures, particularly the mean in a sample from a normally distributed population or between two independent samples.  Z - tests are also based on normal probability distribution.  Z - test is the most commonly used statistical tool in research methodology.  Z - test is a Parametric test.
  • 4. USES OF Z-TEST 1. To test the given population mean when the sample is large (30 or more) or when the population SD is known. 2. To test the equality of two sample means when the samples are large (30 or more) or when the population SD is known. 3. To test the population proportion. 4. To test the equality of two sample proportions. 5. To test the population SD when the sample is large. 6. To test the equality of two sample standard deviations when the samples are large or when population standard deviations are known. 7. To test the equality of correlation coefficients.
  • 5. ASSUMPTIONS 1. Sampling distribution of test statistic is normal. 2. Sample statistics are close to the population parameter and therefore for finding standard error, sample statistics are used in places where population parameters are to be used.
  • 6. STEPS IN CALCULATION Step 1 : Formulate the hypothesis Ho : which is stated for the purpose of possible acceptance. It is the original hypothesis. H1 : hypothesis other than null hypothesis is called alternative hypothesis.
  • 7. Step 2: Deciding the level of significance The level of significance is the probability of rejecting the null hypothesis when it is true, also known as alpha or ' α '. The commonly used level of significance is either 0.05 or 0.01. Critical Region The critical region is called the region of rejection.It is the region in which the null hypothesis is rejected. The are of critical region is equal to the level of significance, α.
  • 8.
  • 9. Step 3: Calculation of the value I. Testing The Given Population Mean Ho: There is no significant difference between sample mean and population mean. Formula:
  • 10. II. Testing Equality Of Two Population Means. Ho: There is no significant difference between two means. Formula:
  • 11. III. Testing Population Proportion H0: There is no significant difference between sample proportion and population proportion. Formula:
  • 12. IV. Testing Equality Of Two Proportions Ho: There is no significant difference between two population proportions. Formula:
  • 13. V. Significance Of Difference Between Sample SD And Population SD Ho: There is no significant difference between sample SD and population SD. Formula:
  • 14. VI. Significance Of Difference Between Standard Deviations Of Two Populations Ho: There is no significant difference between two standard deviations. Formula:
  • 15. Step 4: Obtaining the table value and making the decision The table value is obtained from the 'Table values of z for z - test' by locating the level of significance and degree of freedom. For z - test, the degree of freedom is infinity The decision to accept or reject the null hypothesis is made when; Calculated value < Table value = Accept Ho Calculated value > Table value = Reject Ho
  • 16. ADVANTAGES 1. It is a straightforward and reliable test. 2. A Z-score can be used for a comparison of raw scores obtained from different tests. 3. While comparing a set of raw scores, the Z-score considers both the average value and the variability of those scores.
  • 17. DISADVANTAGES 1. Z-test requires a known standard deviation which is not always possible. 2. It cannot be conducted with a smaller sample size (less than 30).