


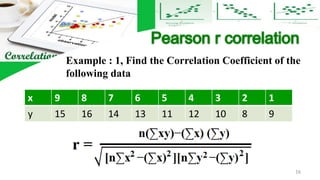
![r =
X Y X2 Y2 XY
9 15 81 225 135
8 16 64 256 128
7 14 49 196 98
6 13 36 169 78
5 11 25 121 55
4 12 16 144 48
3 10 9 100 30
2 8 4 64 16
1 9 1 81 9
45 108 285 1356 597
9(597) – (45) (108)
[9(285) – (45)2][9(1356) – (108) 2]
√
r = 5373 – 4860
[2565 – 2025][12204 – 11664]
√
r = 513
[540][540]
√
513
291600
√
=
r = 513
540
r = 0.95 Hence it is strong
positive Correlation 17](https://image.slidesharecdn.com/correlation-230830082104-57dc100b/85/correlation-pptx-17-320.jpg)

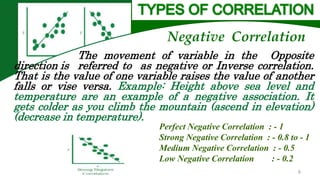
![r =
X Y X2 Y2 XY
2 9 4 81 18
4 7 16 49 28
6 5 36 25 30
8 3 64 9 24
10 1 100 1 10
30 25 220 165 110
5(110) – (30) (25)
[5(220) – (30)2][5(165) – (25) 2]
√
r = 550 - 750
[1100 – 900][825 – 625]
√
r = -200
[200][200]
√
-200
40000
√
=
r = -200
200
r = -1 Hence it is perfect negative Correlation
19](https://image.slidesharecdn.com/correlation-230830082104-57dc100b/85/correlation-pptx-19-320.jpg)


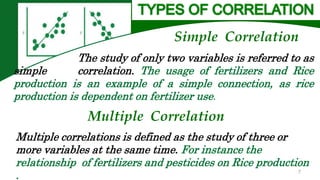
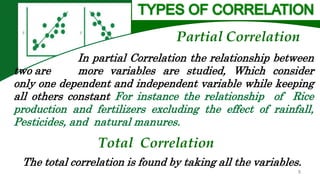
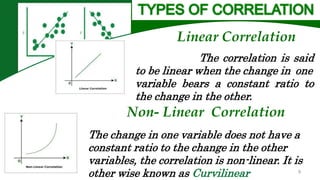
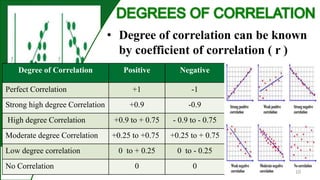
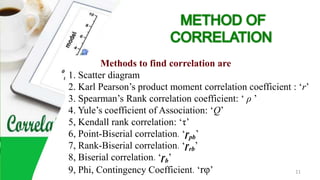
1. Correlation measures the strength and direction of association between two variables. It ranges from -1 to 1, where -1 is perfect negative correlation, 0 is no correlation, and 1 is perfect positive correlation. 2. There are different types of correlation based on the direction, number of variables, and constancy of relationships. Common types include positive, negative, simple, multiple, and partial correlation. 3. Correlation coefficients like Pearson's r and Spearman's rho are used to calculate correlation. Pearson's r assumes linear relationships while Spearman's rho assumes monotonic relationships between variables.


