Downloaded 1,263 times
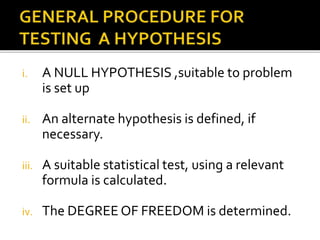
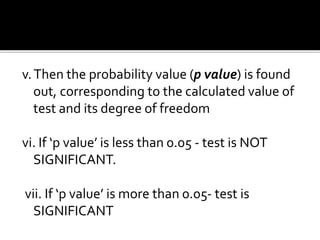
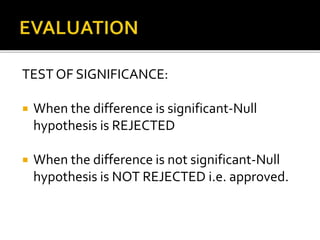
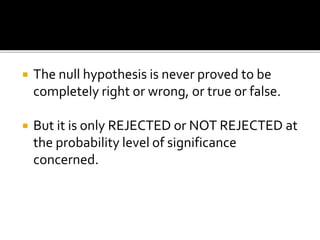

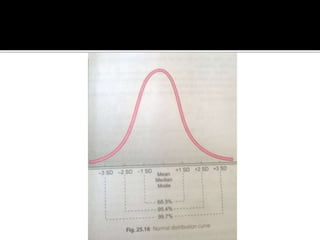
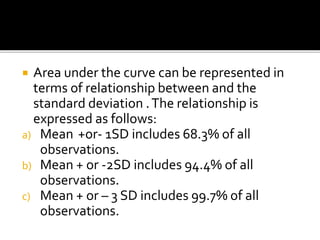
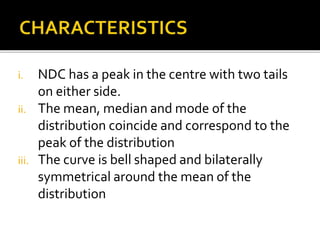
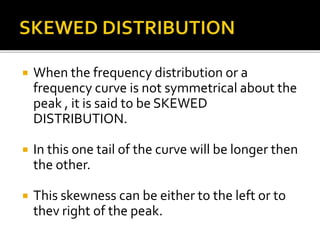
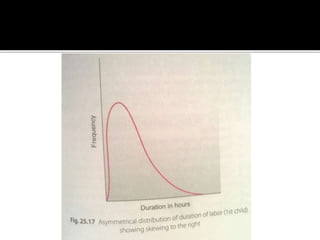
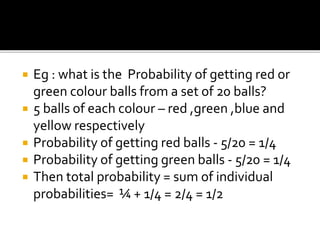
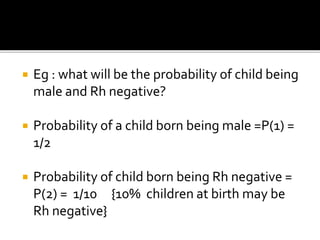


The document explains the null hypothesis, which posits no difference or effect, and details the process for testing it using statistical significance, including the role of p-values. It also describes normal distribution and skewed distributions, elaborating on the calculation of probabilities using addition and multiplication rules, especially in the context of independent and mutually exclusive events. Additionally, examples are provided to illustrate the calculation of probabilities in various scenarios.


![CASE_PRESENTATION_ON_subdural_hematoma(SDH)[1 FINAL PPT]-1.pptx](https://cdn.slidesharecdn.com/ss_thumbnails/casepresentationonsubduralhematomasdh1finalppt-1-260129172522-d405d375-thumbnail.jpg?width=640&height=640&fit=bounds)


