Download to read offline


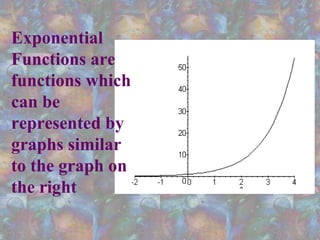
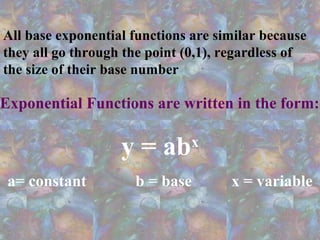
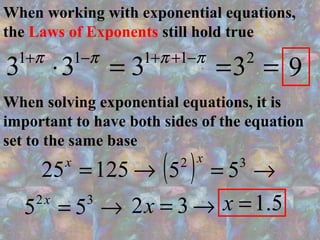
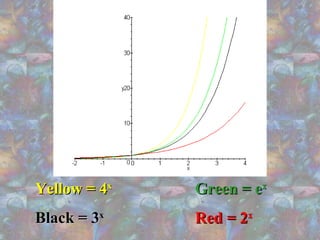

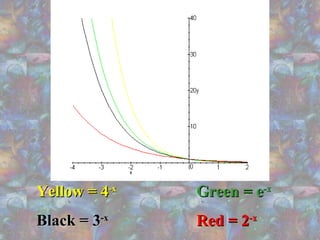
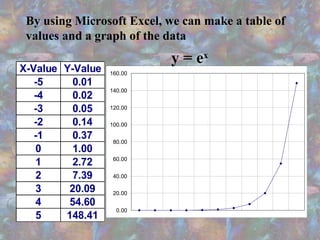
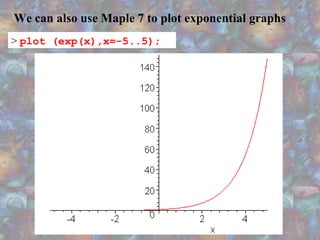


The document discusses exponential functions, highlighting their common characteristics and equations in the form y = ab^x. It explains the importance of having both sides of an exponential equation set to the same base and provides examples of how different bases affect the graph's growth rate. Additionally, it mentions the use of Microsoft Excel and Maple 7 for plotting exponential graphs and illustrates the concept of exponential growth in real life.