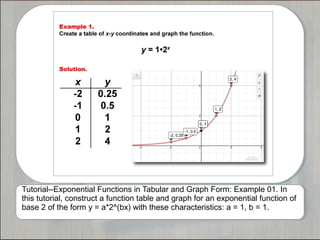
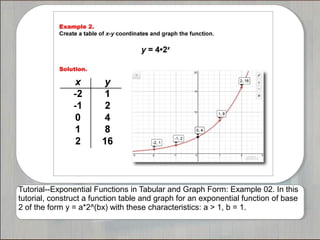
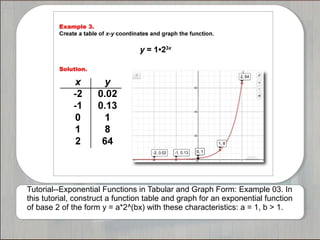
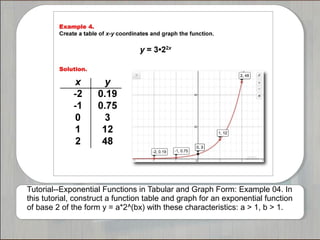
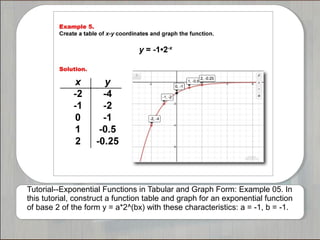
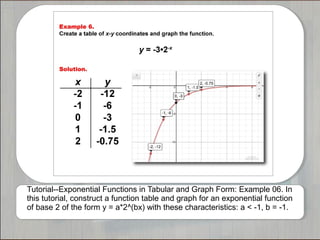
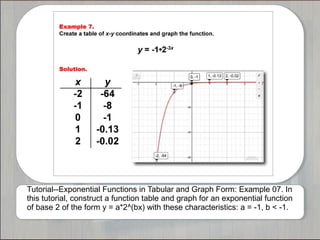
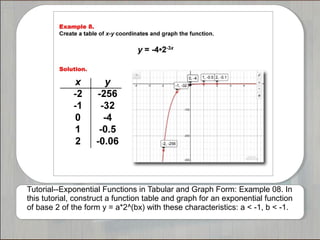
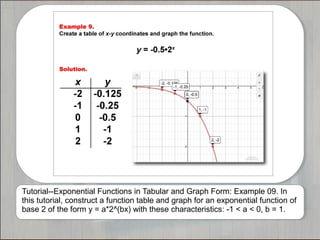
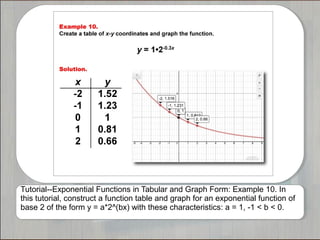
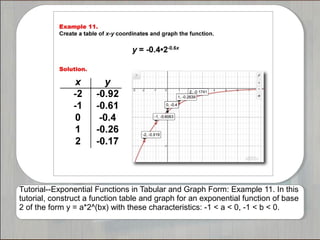
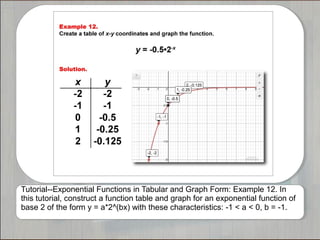
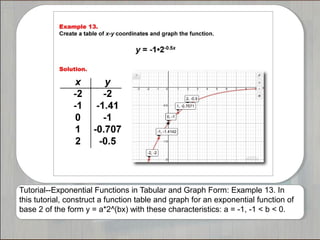
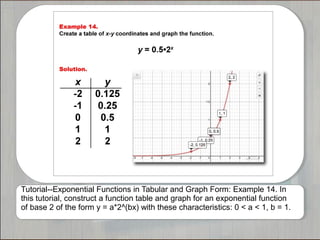
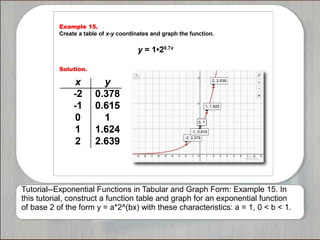
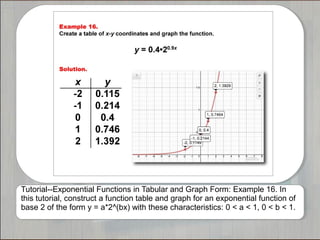
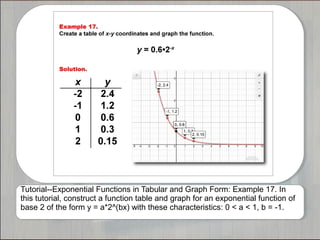
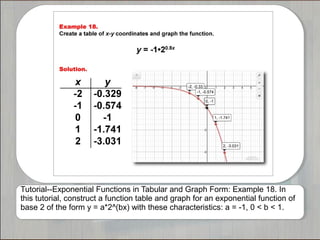
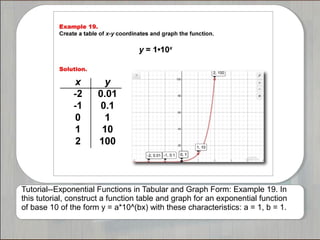
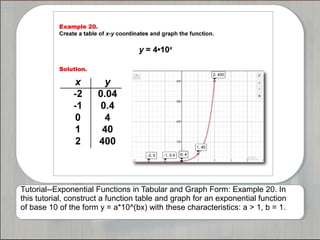
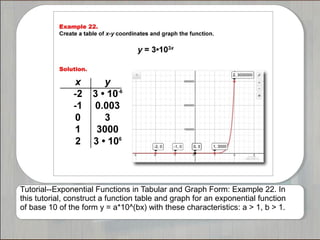
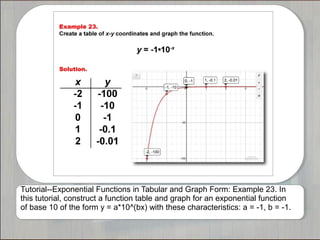
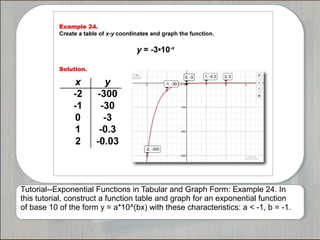
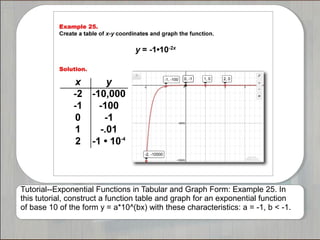
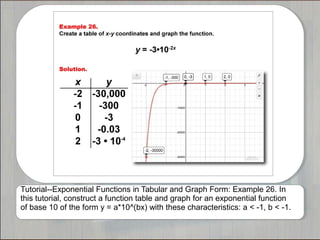
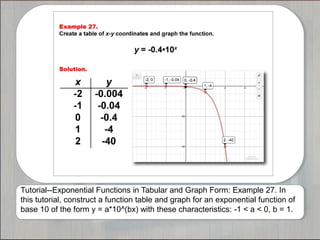
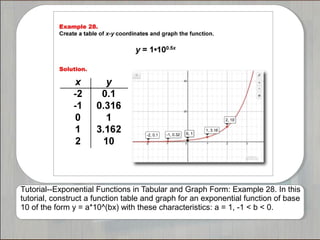
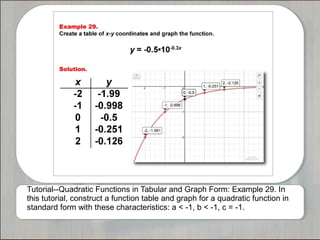
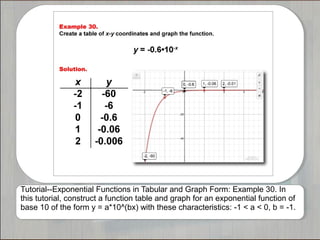
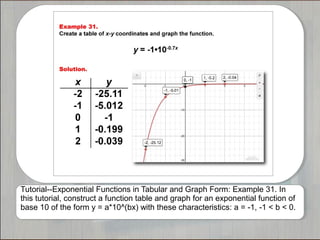
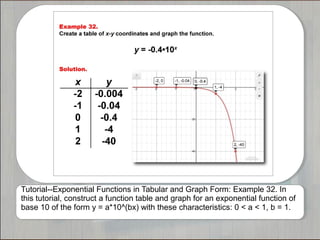
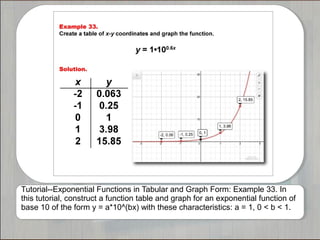
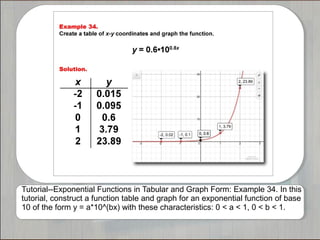
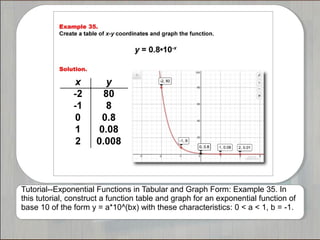
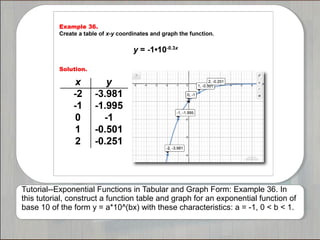
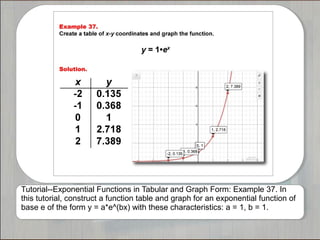
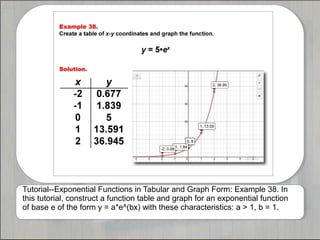
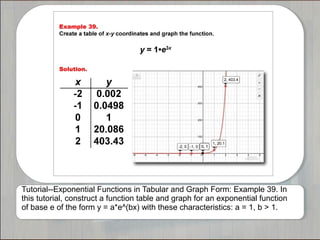
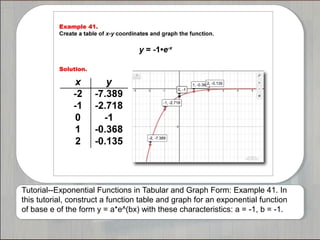
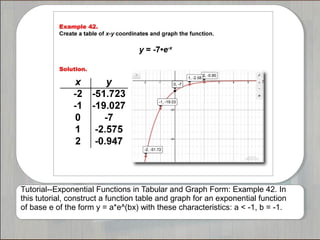
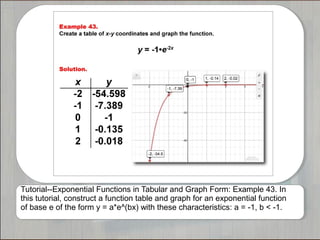
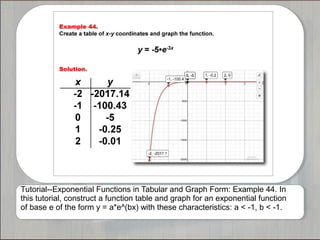
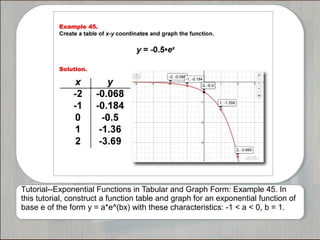
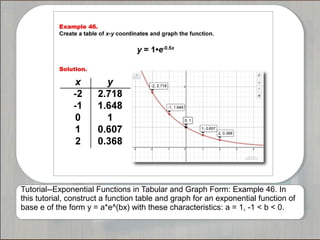
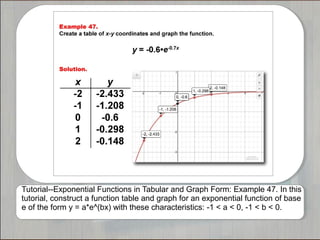
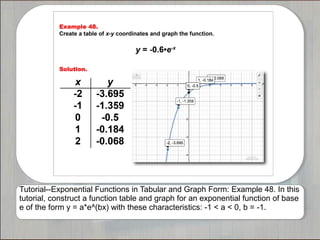
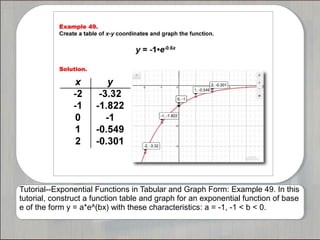
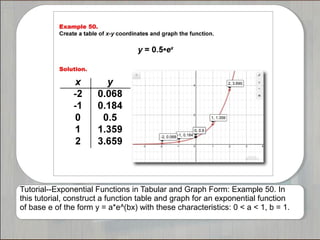
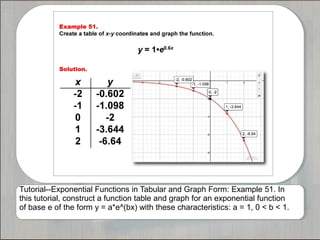
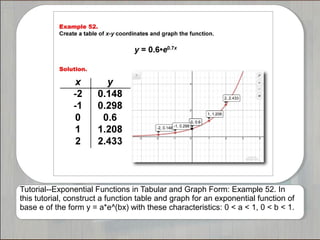
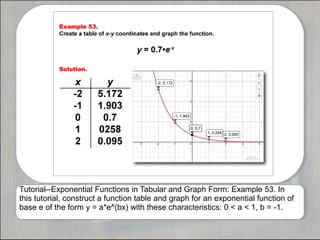
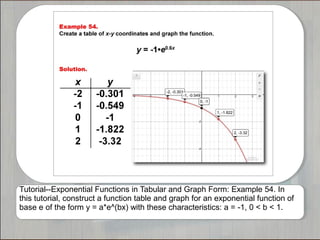
This document outlines 54 tutorials that provide examples of constructing tables and graphs for exponential functions of various bases (2, 10, e) and characteristics of the coefficients a and b. Each tutorial works through an example of an exponential function of the form y = a*b^x, varying the values of a and b to illustrate different patterns in the table and graph.
SAMPLE QUESTIONExercise 1 Consider the functionf (x,C).docxagnesdcarey33086
SAMPLE QUESTION:
Exercise 1: Consider the function
f (x,C)=
sin(C x)
Cx
(a) Create a vector x with 100 elements from -3*pi to 3*pi. Write f as an inline or anonymous function
and generate the vectors y1 = f(x,C1), y2 = f(x,C2) and y3 = f(x,C3), where C1 = 1, C2 = 2 and
C3 = 3. Make sure you suppress the output of x and y's vectors. Plot the function f (for the three
C's above), name the axis, give a title to the plot and include a legend to identify the plots. Add a
grid to the plot.
(b) Without using inline or anonymous functions write a function+function structure m-file that does
the same job as in part (a)
SAMPLE LAB WRITEUP:
MAT 275 MATLAB LAB 1 NAME: __________________________
LAB DAY and TIME:______________
Instructor: _______________________
Exercise 1
(a)
x = linspace(-3*pi,3*pi); % generating x vector - default value for number
% of pts linspace is 100
f= @(x,C) sin(C*x)./(C*x) % C will be just a constant, no need for ".*"
C1 = 1, C2 = 2, C3 = 3 % Using commans to separate commands
y1 = f(x,C1); y2 = f(x,C2); y3 = f(x,C3); % supressing the y's
plot(x,y1,'b.-', x,y2,'ro-', x,y3,'ks-') % using different markers for
% black and white plots
xlabel('x'), ylabel('y') % labeling the axis
title('f(x,C) = sin(Cx)/(Cx)') % adding a title
legend('C = 1','C = 2','C = 3') % adding a legend
grid on
Command window output:
f =
@(x,C)sin(C*x)./(C*x)
C1 =
1
C2 =
2
C3 =
3
(b)
M-file of structure function+function
function ex1
x = linspace(-3*pi,3*pi); % generating x vector - default value for number
% of pts linspace is 100
C1 = 1, C2 = 2, C3 = 3 % Using commans to separate commands
y1 = f(x,C1); y2 = f(x,C2); y3 = f(x,C3); % function f is defined below
plot(x,y1,'b.-', x,y2,'ro-', x,y3,'ks-') % using different markers for
% black and white plots
xlabel('x'), ylabel('y') % labeling the axis
title('f(x,C) = sin(Cx)/(Cx)') % adding a title
legend('C = 1','C = 2','C = 3') % adding a legend
grid on
end
function y = f(x,C)
y = sin(C*x)./(C*x);
end
Command window output:
C1 =
1
C2 =
2
C3 =
3
Joe Bob
Mon lab: 4:30-6:50
Lab 3
Exercise 1
(a) Create function M-file for banded LU factorization
function [L,U] = luband(A,p)
% LUBAND Banded LU factorization
% Adaptation to LUFACT
% Input:
% A diagonally dominant square matrix
% Output:
% L,U unit lower triangular and upper triangular such that LU=A
n = length(A);
L = eye(n); % ones on diagonal
% Gaussian Elimination
for j = 1:n-1
a = min(j+p.
MODULE 5 QuizQuestion1. Find the domain of the function. E.docxmoirarandell
MODULE 5 Quiz
Question
1.
Find the domain of the function. Express your answer in interval notation.
a.
b.
c.
d.
2.
Indicate whether the graph is the graph of a function.
a. Function
b. Not a function
3.
Graph f(x) = |x – 1|.
a.
b.
c.
d.
4.
Determine whether the function is even, odd, or neither. f(x) = x5 + 4
a. Even
b. Odd
c. Neither
5.
Find the value of f(3) if f(x) = 4x2 + x.
a. 38
b. 39
c. 40
d. 41
6.
Use the graph of the function to estimate: (a) f(–6), (b) f(1), (c) All x such that f(x) = 3
a. (a) 4 (b) 3 (c) –5, 1
b. (a) 5 (b) 4 (c) –3, 1
c. (a) 1 (b) 2 (c) –5, 2
d. (a) 7 (b) 5 (c) –5, 6
7.
The graph of the function g is formed by applying the indicated sequence of transformations to the given function f. Find an equation for the function g. The graph of is horizontally stretched by a factor of 0.1, reflected in the y axis, and shifted four units to the left.
a.
b.
c.
d.
8.
Evaluate f(–1).
a. –1
b. 8
c. 0
d. –2
9.
Determine whether the function is even, odd, or neither. f(x) = x3 – 10x
a. Even
b. Odd
c. Neither
10.
Indicate whether the graph is the graph of a function.
a. Function
b. Not a function
11.
Determine whether the equation defines a function with independent variable x. If it does, find the domain. If it does not, find a value of x to which there corresponds more than one value of y. x|y| = x + 5
a. A function with domain all real numbers
b. A function with domain all real numbers except 0
c. Not a function: when x = 0, y = ±5
d. Not a function: when x = 1, y = ±6
12.
Graph y = (x – 2)2 + 1
a.
b.
c.
d.
13.
Find the y-intercept(s).
a. –2
b. 1, –3
c. –3
d. None
14.
Determine whether the correspondence defines a function. Let F be the set of all faculty teaching Chemistry 101 at a university, and let S be the set of all students taking that course. Students from set S correspond to their Chemistry 101 instructors.
a. A function
b. Not a function
15.
Determine whether the function is even, odd, or neither. f(x) = –4x2 + 5x + 3
a. Even
b. Odd
c. Neither
16.
Indicate whether the table defines a function.
a. Function
b. Not a function
17.
Use the graph of the function to estimate: (a) f(1), (b) f(–5),and (c) All x such that f(x) = 3
a. (a) –3 (b) –9 (c) 7
b. (a) –3 (b) –9 (c) –1
c. (a) 5 (b) –1 (c) 7
d. (a) 5 (b) –1 (c) –1
18.
Find the intervals over which f is increasing.
a. (–∞, –2], [1, ∞)
b. (–3, ∞)
c. (–∞, –3], [1, ∞)
d. None
19.
Evaluate f(4).
a. 4
b. 10
c. 5
d. –2
20.
Indicate whether the graph is the graph of a function.
a. Function
b. Not a function
21.
Sketch the graph of the function f(x) = –2x + 3.
a.
b.
22.
Find the intervals over which f is decreasing.
a. (–∞, –2), [1, ∞)
b. (–∞, –2], [1, ∞)
c. (–∞, –3), [1, ∞)
d. (–∞, –3], [1, ∞)
23.
Indicate whether the table defines a function.
a. Function
b. Not a function
24.
Indicate whether the graph is the graph of a function.
a. ...
A hands-on activity for explore a variety of math topics, including:
* Circumference and Diameter
* Linear functions and slope
* Ratios
* Data gathering and scatterplot
For more math resources, go to www.media4math.com.
Tutorials--The Language of Math--Variable Expressions--Multiplication and Sub...Media4math
This set of tutorials provides 32 examples of converting verbal expressions into variable expressions that involve multiplication and subtraction. Note: The download is a PPT file.
Tutorials--The Language of Math--Numerical Expressions--Multiplication Media4math
This set of tutorials provides 40 examples of converting verbal expressions into numerical expressions that involve multiplication. Note: The download is a PPT file.
Tutorials--The Language of Math--Numerical Expressions--Division Media4math
This set of tutorials provides 40 examples of converting verbal expressions into numerical expressions that involve division. Note: The download is a PPT file.
Tutorials--The Language of Math--Numerical Expressions--SubtractionMedia4math
This set of tutorials provides 40 examples of converting verbal expressions into numerical expressions that involve subtraction. Note: The download is a PPT file.
Tutorials--Language of Math--Numerical Expressions--AdditionMedia4math
This set of tutorials provides 40 examples of converting verbal expressions into numerical expressions that involve addition. The verbal expressions include these terms:
Plus
Increased by
In addition to
Added to
More than
In this issue of Math in the News we explore logarithmic functions to model the thawing of frozen turkeys. We look at USDA guidelines to determine data points and use a graphing calculator to create mathematical models.
Embracing GenAI - A Strategic ImperativePeter Windle
Artificial Intelligence (AI) technologies such as Generative AI, Image Generators and Large Language Models have had a dramatic impact on teaching, learning and assessment over the past 18 months. The most immediate threat AI posed was to Academic Integrity with Higher Education Institutes (HEIs) focusing their efforts on combating the use of GenAI in assessment. Guidelines were developed for staff and students, policies put in place too. Innovative educators have forged paths in the use of Generative AI for teaching, learning and assessments leading to pockets of transformation springing up across HEIs, often with little or no top-down guidance, support or direction.
This Gasta posits a strategic approach to integrating AI into HEIs to prepare staff, students and the curriculum for an evolving world and workplace. We will highlight the advantages of working with these technologies beyond the realm of teaching, learning and assessment by considering prompt engineering skills, industry impact, curriculum changes, and the need for staff upskilling. In contrast, not engaging strategically with Generative AI poses risks, including falling behind peers, missed opportunities and failing to ensure our graduates remain employable. The rapid evolution of AI technologies necessitates a proactive and strategic approach if we are to remain relevant.
Palestine last event orientationfvgnh .pptxRaedMohamed3
An EFL lesson about the current events in Palestine. It is intended to be for intermediate students who wish to increase their listening skills through a short lesson in power point.
Biological screening of herbal drugs: Introduction and Need for
Phyto-Pharmacological Screening, New Strategies for evaluating
Natural Products, In vitro evaluation techniques for Antioxidants, Antimicrobial and Anticancer drugs. In vivo evaluation techniques
for Anti-inflammatory, Antiulcer, Anticancer, Wound healing, Antidiabetic, Hepatoprotective, Cardio protective, Diuretics and
Antifertility, Toxicity studies as per OECD guidelines
Instructions for Submissions thorugh G- Classroom.pptxJheel Barad
This presentation provides a briefing on how to upload submissions and documents in Google Classroom. It was prepared as part of an orientation for new Sainik School in-service teacher trainees. As a training officer, my goal is to ensure that you are comfortable and proficient with this essential tool for managing assignments and fostering student engagement.
Acetabularia Information For Class 9 .docxvaibhavrinwa19
Acetabularia acetabulum is a single-celled green alga that in its vegetative state is morphologically differentiated into a basal rhizoid and an axially elongated stalk, which bears whorls of branching hairs. The single diploid nucleus resides in the rhizoid.
Introduction to AI for Nonprofits with Tapp NetworkTechSoup
Dive into the world of AI! Experts Jon Hill and Tareq Monaur will guide you through AI's role in enhancing nonprofit websites and basic marketing strategies, making it easy to understand and apply.
Operation “Blue Star” is the only event in the history of Independent India where the state went into war with its own people. Even after about 40 years it is not clear if it was culmination of states anger over people of the region, a political game of power or start of dictatorial chapter in the democratic setup.
The people of Punjab felt alienated from main stream due to denial of their just demands during a long democratic struggle since independence. As it happen all over the word, it led to militant struggle with great loss of lives of military, police and civilian personnel. Killing of Indira Gandhi and massacre of innocent Sikhs in Delhi and other India cities was also associated with this movement.
Honest Reviews of Tim Han LMA Course Program.pptxtimhan337
Personal development courses are widely available today, with each one promising life-changing outcomes. Tim Han’s Life Mastery Achievers (LMA) Course has drawn a lot of interest. In addition to offering my frank assessment of Success Insider’s LMA Course, this piece examines the course’s effects via a variety of Tim Han LMA course reviews and Success Insider comments.
2. Overview
This set of tutorials provides 54 examples of
exponential functions in tabular and graph form.
3. Tutorial--Exponential Functions in Tabular and Graph Form: Example 01. In
this tutorial, construct a function table and graph for an exponential function of
base 2 of the form y = a*2^(bx) with these characteristics: a = 1, b = 1.
4. Tutorial--Exponential Functions in Tabular and Graph Form: Example 02. In this
tutorial, construct a function table and graph for an exponential function of base
2 of the form y = a*2^(bx) with these characteristics: a > 1, b = 1.
5. Tutorial--Exponential Functions in Tabular and Graph Form: Example 03. In
this tutorial, construct a function table and graph for an exponential function
of base 2 of the form y = a*2^(bx) with these characteristics: a = 1, b > 1.
6. Tutorial--Exponential Functions in Tabular and Graph Form: Example 04. In
this tutorial, construct a function table and graph for an exponential function
of base 2 of the form y = a*2^(bx) with these characteristics: a > 1, b > 1.
7. Tutorial--Exponential Functions in Tabular and Graph Form: Example 05. In
this tutorial, construct a function table and graph for an exponential function
of base 2 of the form y = a*2^(bx) with these characteristics: a = -1, b = -1.
8. Tutorial--Exponential Functions in Tabular and Graph Form: Example 06. In
this tutorial, construct a function table and graph for an exponential function
of base 2 of the form y = a*2^(bx) with these characteristics: a < -1, b = -1.
9. Tutorial--Exponential Functions in Tabular and Graph Form: Example 07. In
this tutorial, construct a function table and graph for an exponential function
of base 2 of the form y = a*2^(bx) with these characteristics: a = -1, b < -1.
10. Tutorial--Exponential Functions in Tabular and Graph Form: Example 08. In
this tutorial, construct a function table and graph for an exponential function
of base 2 of the form y = a*2^(bx) with these characteristics: a < -1, b < -1.
11. Tutorial--Exponential Functions in Tabular and Graph Form: Example 09. In
this tutorial, construct a function table and graph for an exponential function of
base 2 of the form y = a*2^(bx) with these characteristics: -1 < a < 0, b = 1.
12. Tutorial--Exponential Functions in Tabular and Graph Form: Example 10. In
this tutorial, construct a function table and graph for an exponential function of
base 2 of the form y = a*2^(bx) with these characteristics: a = 1, -1 < b < 0.
13. Tutorial--Exponential Functions in Tabular and Graph Form: Example 11. In this
tutorial, construct a function table and graph for an exponential function of base
2 of the form y = a*2^(bx) with these characteristics: -1 < a < 0, -1 < b < 0.
14. Tutorial--Exponential Functions in Tabular and Graph Form: Example 12. In
this tutorial, construct a function table and graph for an exponential function of
base 2 of the form y = a*2^(bx) with these characteristics: -1 < a < 0, b = -1.
15. Tutorial--Exponential Functions in Tabular and Graph Form: Example 13. In
this tutorial, construct a function table and graph for an exponential function of
base 2 of the form y = a*2^(bx) with these characteristics: a = -1, -1 < b < 0.
16. Tutorial--Exponential Functions in Tabular and Graph Form: Example 14. In
this tutorial, construct a function table and graph for an exponential function
of base 2 of the form y = a*2^(bx) with these characteristics: 0 < a < 1, b = 1.
17. Tutorial--Exponential Functions in Tabular and Graph Form: Example 15. In
this tutorial, construct a function table and graph for an exponential function
of base 2 of the form y = a*2^(bx) with these characteristics: a = 1, 0 < b < 1.
18. Tutorial--Exponential Functions in Tabular and Graph Form: Example 16. In
this tutorial, construct a function table and graph for an exponential function of
base 2 of the form y = a*2^(bx) with these characteristics: 0 < a < 1, 0 < b < 1.
19. Tutorial--Exponential Functions in Tabular and Graph Form: Example 17. In
this tutorial, construct a function table and graph for an exponential function of
base 2 of the form y = a*2^(bx) with these characteristics: 0 < a < 1, b = -1.
20. Tutorial--Exponential Functions in Tabular and Graph Form: Example 18. In
this tutorial, construct a function table and graph for an exponential function of
base 2 of the form y = a*2^(bx) with these characteristics: a = -1, 0 < b < 1.
21. Tutorial--Exponential Functions in Tabular and Graph Form: Example 19. In
this tutorial, construct a function table and graph for an exponential function
of base 10 of the form y = a*10^(bx) with these characteristics: a = 1, b = 1.
22. Tutorial--Exponential Functions in Tabular and Graph Form: Example 20. In
this tutorial, construct a function table and graph for an exponential function
of base 10 of the form y = a*10^(bx) with these characteristics: a > 1, b = 1.
23. Tutorial--Exponential Functions in Tabular and Graph Form: Example 21. In
this tutorial, construct a function table and graph for an exponential function
of base 10 of the form y = a*10^(bx) with these characteristics: a = 1, b > 1.
24. Tutorial--Exponential Functions in Tabular and Graph Form: Example 22. In
this tutorial, construct a function table and graph for an exponential function
of base 10 of the form y = a*10^(bx) with these characteristics: a > 1, b > 1.
25. Tutorial--Exponential Functions in Tabular and Graph Form: Example 23. In
this tutorial, construct a function table and graph for an exponential function
of base 10 of the form y = a*10^(bx) with these characteristics: a = -1, b = -1.
26. Tutorial--Exponential Functions in Tabular and Graph Form: Example 24. In
this tutorial, construct a function table and graph for an exponential function
of base 10 of the form y = a*10^(bx) with these characteristics: a < -1, b = -1.
27. Tutorial--Exponential Functions in Tabular and Graph Form: Example 25. In
this tutorial, construct a function table and graph for an exponential function
of base 10 of the form y = a*10^(bx) with these characteristics: a = -1, b < -1.
28. Tutorial--Exponential Functions in Tabular and Graph Form: Example 26. In
this tutorial, construct a function table and graph for an exponential function
of base 10 of the form y = a*10^(bx) with these characteristics: a < -1, b < -1.
29. Tutorial--Exponential Functions in Tabular and Graph Form: Example 27. In
this tutorial, construct a function table and graph for an exponential function of
base 10 of the form y = a*10^(bx) with these characteristics: -1 < a < 0, b = 1.
30. Tutorial--Exponential Functions in Tabular and Graph Form: Example 28. In this
tutorial, construct a function table and graph for an exponential function of base
10 of the form y = a*10^(bx) with these characteristics: a = 1, -1 < b < 0.
31. Tutorial--Quadratic Functions in Tabular and Graph Form: Example 29. In
this tutorial, construct a function table and graph for a quadratic function in
standard form with these characteristics: a < -1, b < -1, c = -1.
32. Tutorial--Exponential Functions in Tabular and Graph Form: Example 30. In
this tutorial, construct a function table and graph for an exponential function of
base 10 of the form y = a*10^(bx) with these characteristics: -1 < a < 0, b = -1.
33. Tutorial--Exponential Functions in Tabular and Graph Form: Example 31. In
this tutorial, construct a function table and graph for an exponential function of
base 10 of the form y = a*10^(bx) with these characteristics: a = -1, -1 < b < 0.
34. Tutorial--Exponential Functions in Tabular and Graph Form: Example 32. In
this tutorial, construct a function table and graph for an exponential function of
base 10 of the form y = a*10^(bx) with these characteristics: 0 < a < 1, b = 1.
35. Tutorial--Exponential Functions in Tabular and Graph Form: Example 33. In
this tutorial, construct a function table and graph for an exponential function of
base 10 of the form y = a*10^(bx) with these characteristics: a = 1, 0 < b < 1.
36. Tutorial--Exponential Functions in Tabular and Graph Form: Example 34. In this
tutorial, construct a function table and graph for an exponential function of base
10 of the form y = a*10^(bx) with these characteristics: 0 < a < 1, 0 < b < 1.
37. Tutorial--Exponential Functions in Tabular and Graph Form: Example 35. In
this tutorial, construct a function table and graph for an exponential function of
base 10 of the form y = a*10^(bx) with these characteristics: 0 < a < 1, b = -1.
38. Tutorial--Exponential Functions in Tabular and Graph Form: Example 36. In
this tutorial, construct a function table and graph for an exponential function of
base 10 of the form y = a*10^(bx) with these characteristics: a = -1, 0 < b < 1.
39. Tutorial--Exponential Functions in Tabular and Graph Form: Example 37. In
this tutorial, construct a function table and graph for an exponential function of
base e of the form y = a*e^(bx) with these characteristics: a = 1, b = 1.
40. Tutorial--Exponential Functions in Tabular and Graph Form: Example 38. In
this tutorial, construct a function table and graph for an exponential function
of base e of the form y = a*e^(bx) with these characteristics: a > 1, b = 1.
41. Tutorial--Exponential Functions in Tabular and Graph Form: Example 39. In
this tutorial, construct a function table and graph for an exponential function
of base e of the form y = a*e^(bx) with these characteristics: a = 1, b > 1.
42. Tutorial--Exponential Functions in Tabular and Graph Form: Example 40. In
this tutorial, construct a function table and graph for an exponential function
of base e of the form y = a*e^(bx) with these characteristics: a > 1, b > 1.
43. Tutorial--Exponential Functions in Tabular and Graph Form: Example 41. In
this tutorial, construct a function table and graph for an exponential function
of base e of the form y = a*e^(bx) with these characteristics: a = -1, b = -1.
44. Tutorial--Exponential Functions in Tabular and Graph Form: Example 42. In
this tutorial, construct a function table and graph for an exponential function
of base e of the form y = a*e^(bx) with these characteristics: a < -1, b = -1.
45. Tutorial--Exponential Functions in Tabular and Graph Form: Example 43. In
this tutorial, construct a function table and graph for an exponential function
of base e of the form y = a*e^(bx) with these characteristics: a = -1, b < -1.
46. Tutorial--Exponential Functions in Tabular and Graph Form: Example 44. In
this tutorial, construct a function table and graph for an exponential function
of base e of the form y = a*e^(bx) with these characteristics: a < -1, b < -1.
47. Tutorial--Exponential Functions in Tabular and Graph Form: Example 45. In
this tutorial, construct a function table and graph for an exponential function of
base e of the form y = a*e^(bx) with these characteristics: -1 < a < 0, b = 1.
48. Tutorial--Exponential Functions in Tabular and Graph Form: Example 46. In
this tutorial, construct a function table and graph for an exponential function of
base e of the form y = a*e^(bx) with these characteristics: a = 1, -1 < b < 0.
49. Tutorial--Exponential Functions in Tabular and Graph Form: Example 47. In this
tutorial, construct a function table and graph for an exponential function of base
e of the form y = a*e^(bx) with these characteristics: -1 < a < 0, -1 < b < 0.
50. Tutorial--Exponential Functions in Tabular and Graph Form: Example 48. In this
tutorial, construct a function table and graph for an exponential function of base
e of the form y = a*e^(bx) with these characteristics: -1 < a < 0, b = -1.
51. Tutorial--Exponential Functions in Tabular and Graph Form: Example 49. In this
tutorial, construct a function table and graph for an exponential function of base
e of the form y = a*e^(bx) with these characteristics: a = -1, -1 < b < 0.
52. Tutorial--Exponential Functions in Tabular and Graph Form: Example 50. In
this tutorial, construct a function table and graph for an exponential function
of base e of the form y = a*e^(bx) with these characteristics: 0 < a < 1, b = 1.
53. Tutorial--Exponential Functions in Tabular and Graph Form: Example 51. In
this tutorial, construct a function table and graph for an exponential function
of base e of the form y = a*e^(bx) with these characteristics: a = 1, 0 < b < 1.
54. Tutorial--Exponential Functions in Tabular and Graph Form: Example 52. In
this tutorial, construct a function table and graph for an exponential function of
base e of the form y = a*e^(bx) with these characteristics: 0 < a < 1, 0 < b < 1.
55. Tutorial--Exponential Functions in Tabular and Graph Form: Example 53. In
this tutorial, construct a function table and graph for an exponential function of
base e of the form y = a*e^(bx) with these characteristics: 0 < a < 1, b = -1.
56. Tutorial--Exponential Functions in Tabular and Graph Form: Example 54. In
this tutorial, construct a function table and graph for an exponential function of
base e of the form y = a*e^(bx) with these characteristics: a = -1, 0 < b < 1.