Download to read offline


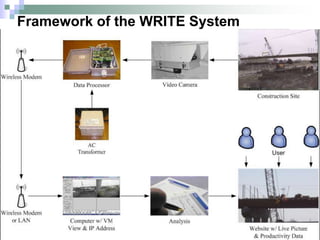
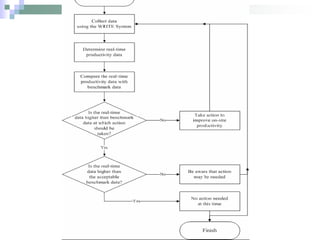

The document discusses the development of the Wireless Real-Time Productivity Measurement (WRITE) system aimed at providing real-time data on construction productivity to project managers. It highlights how traditional measurement techniques are insufficient for timely decision-making, while the WRITE system improves on-site productivity by benchmarking real-time data against established metrics. Additionally, the document explains the framework of a productivity improvement model based on data captured by the WRITE system, allowing construction teams to make informed operational decisions.


![[Infographic] Construction Safety: The realities, risks, repercussions](https://cdn.slidesharecdn.com/ss_thumbnails/constructionsafetyinfographic-170919132944-thumbnail.jpg?width=640&height=640&fit=bounds)