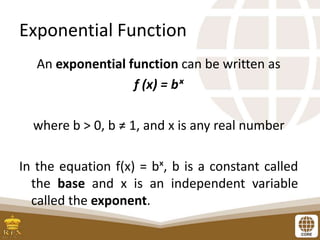
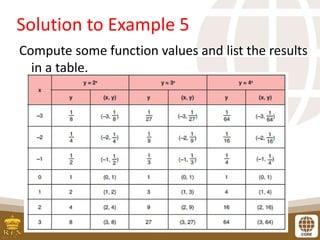
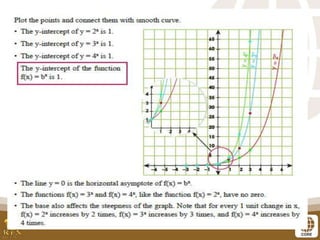
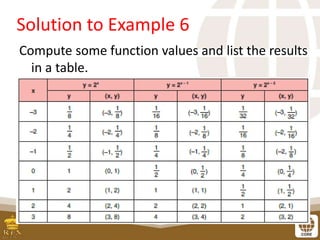
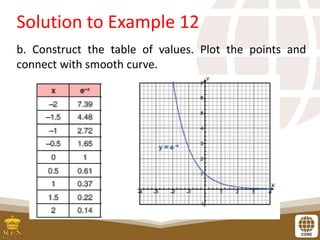
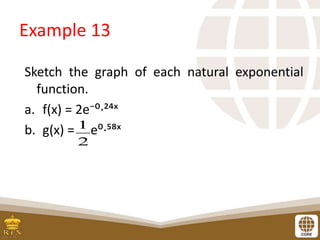
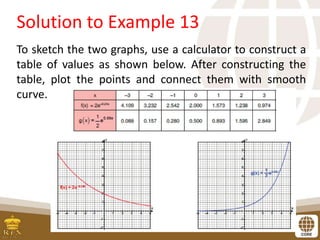
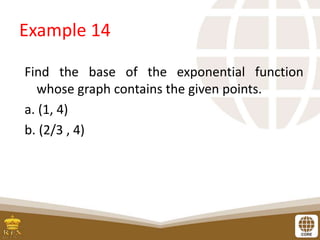
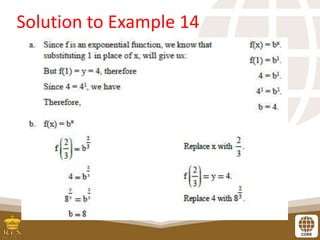
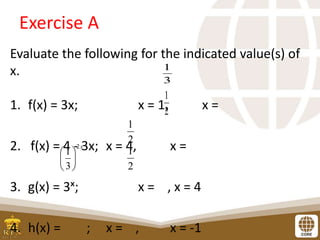
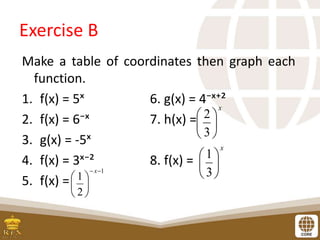
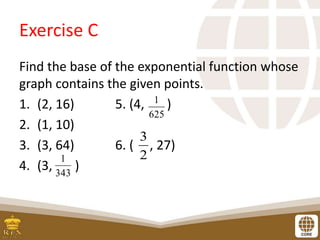
This document covers exponential functions including:
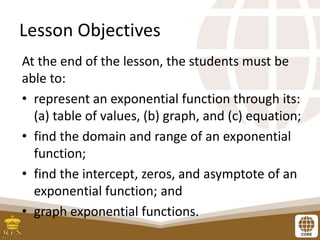
- Representing exponential functions through tables, graphs, and equations.
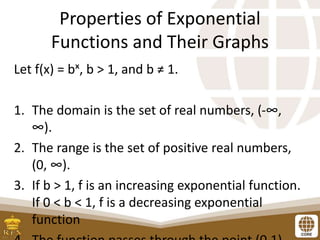
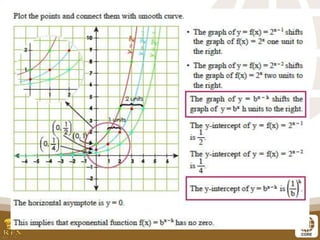
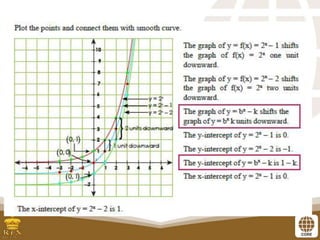
- Finding the domain, range, intercepts, zeros, and asymptotes of exponential functions.
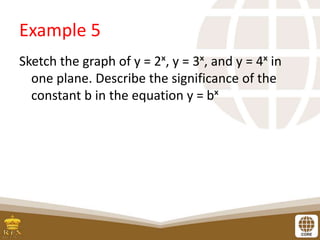
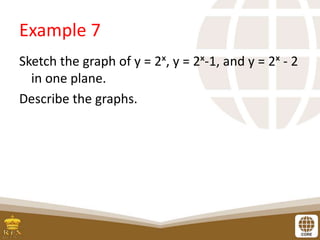
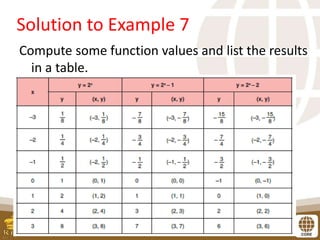
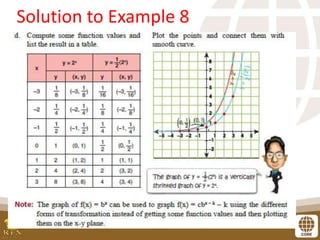
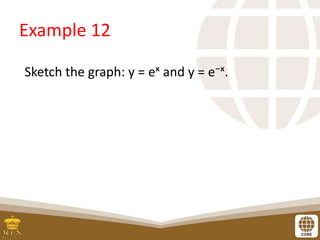
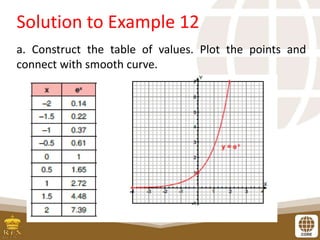
- Graphing exponential functions and describing how they increase or decrease based on the base value.
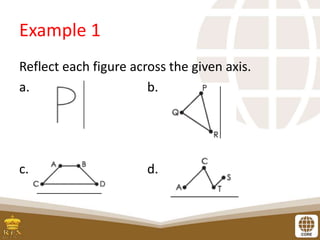
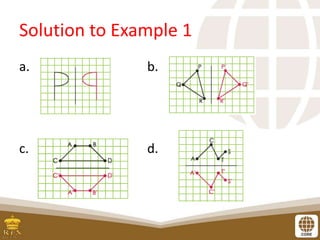
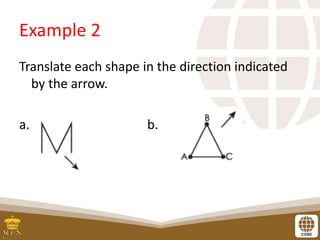
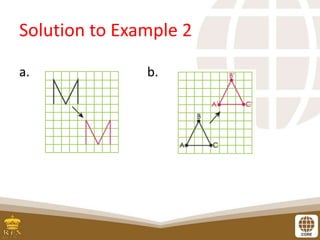
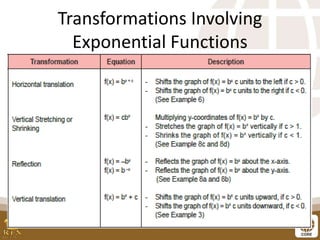
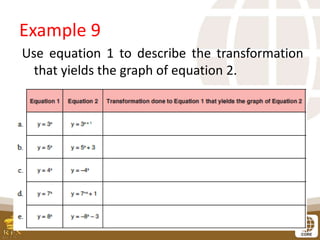
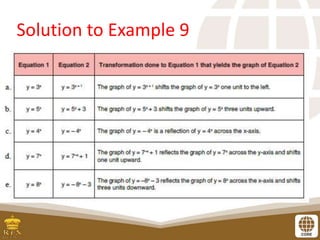
- Transformations of exponential functions including reflections across axes and translations.
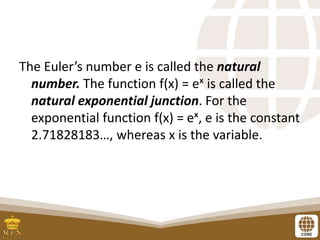
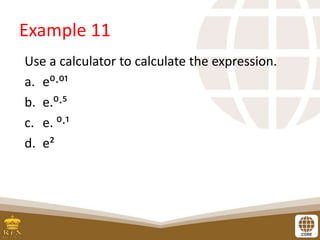
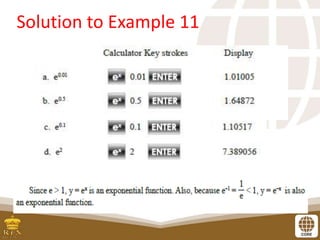
- Properties of natural exponential functions where e is the base.