Downloaded 156 times


![Polygons and lines:
11
Polygons can be thought of as sequences of connected points, where the
first point is the same as the last.
- An open polygon, where the sequence of points does not result in a
closed shape with a denned area, is called a line.
In the R environment, line and polygon data are stored in objects of classes
SpatialPolygons and Spatial Lines")
Class Polygon [package "sp"]
Name: labpt area hole ringDir coords
Class: numeric numeric logical integer matrix
The data are stored as a SpatialPolygons dataframe, which is a subclass of
SpatialPolygons containing a dataframe of attributes.](https://image.slidesharecdn.com/131854-140508022253-phpapp01/85/R-programming-language-in-spatial-analysis-11-320.jpg)
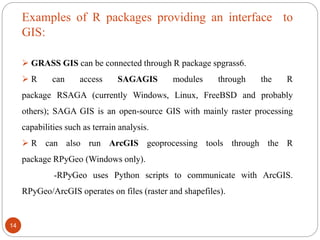


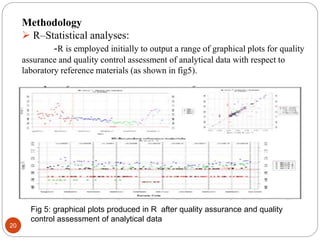


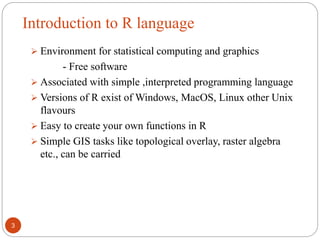
R is a free software environment for statistical computing and graphics. It can be used for spatial data analysis and GIS tasks. Spatial data such as points, polygons, and raster files can be imported and analyzed in R using specialized packages. Two case studies demonstrated using R for spatial interpolation of temperature data, LiDAR data processing to create digital elevation models, and developing online viewers for spatial datasets. R allows for reproducible analysis through scripting and has numerous packages that implement statistical procedures, graphics, and interfaces with GIS software like GRASS and ArcGIS.


![Spatial_Data_Analysis_with_open_source_softwares[1]](https://cdn.slidesharecdn.com/ss_thumbnails/8db4d971-8e8c-4fd8-8682-b20e5d6cd65f-161221072847-thumbnail.jpg?width=640&height=640&fit=bounds)