Downloaded 132 times
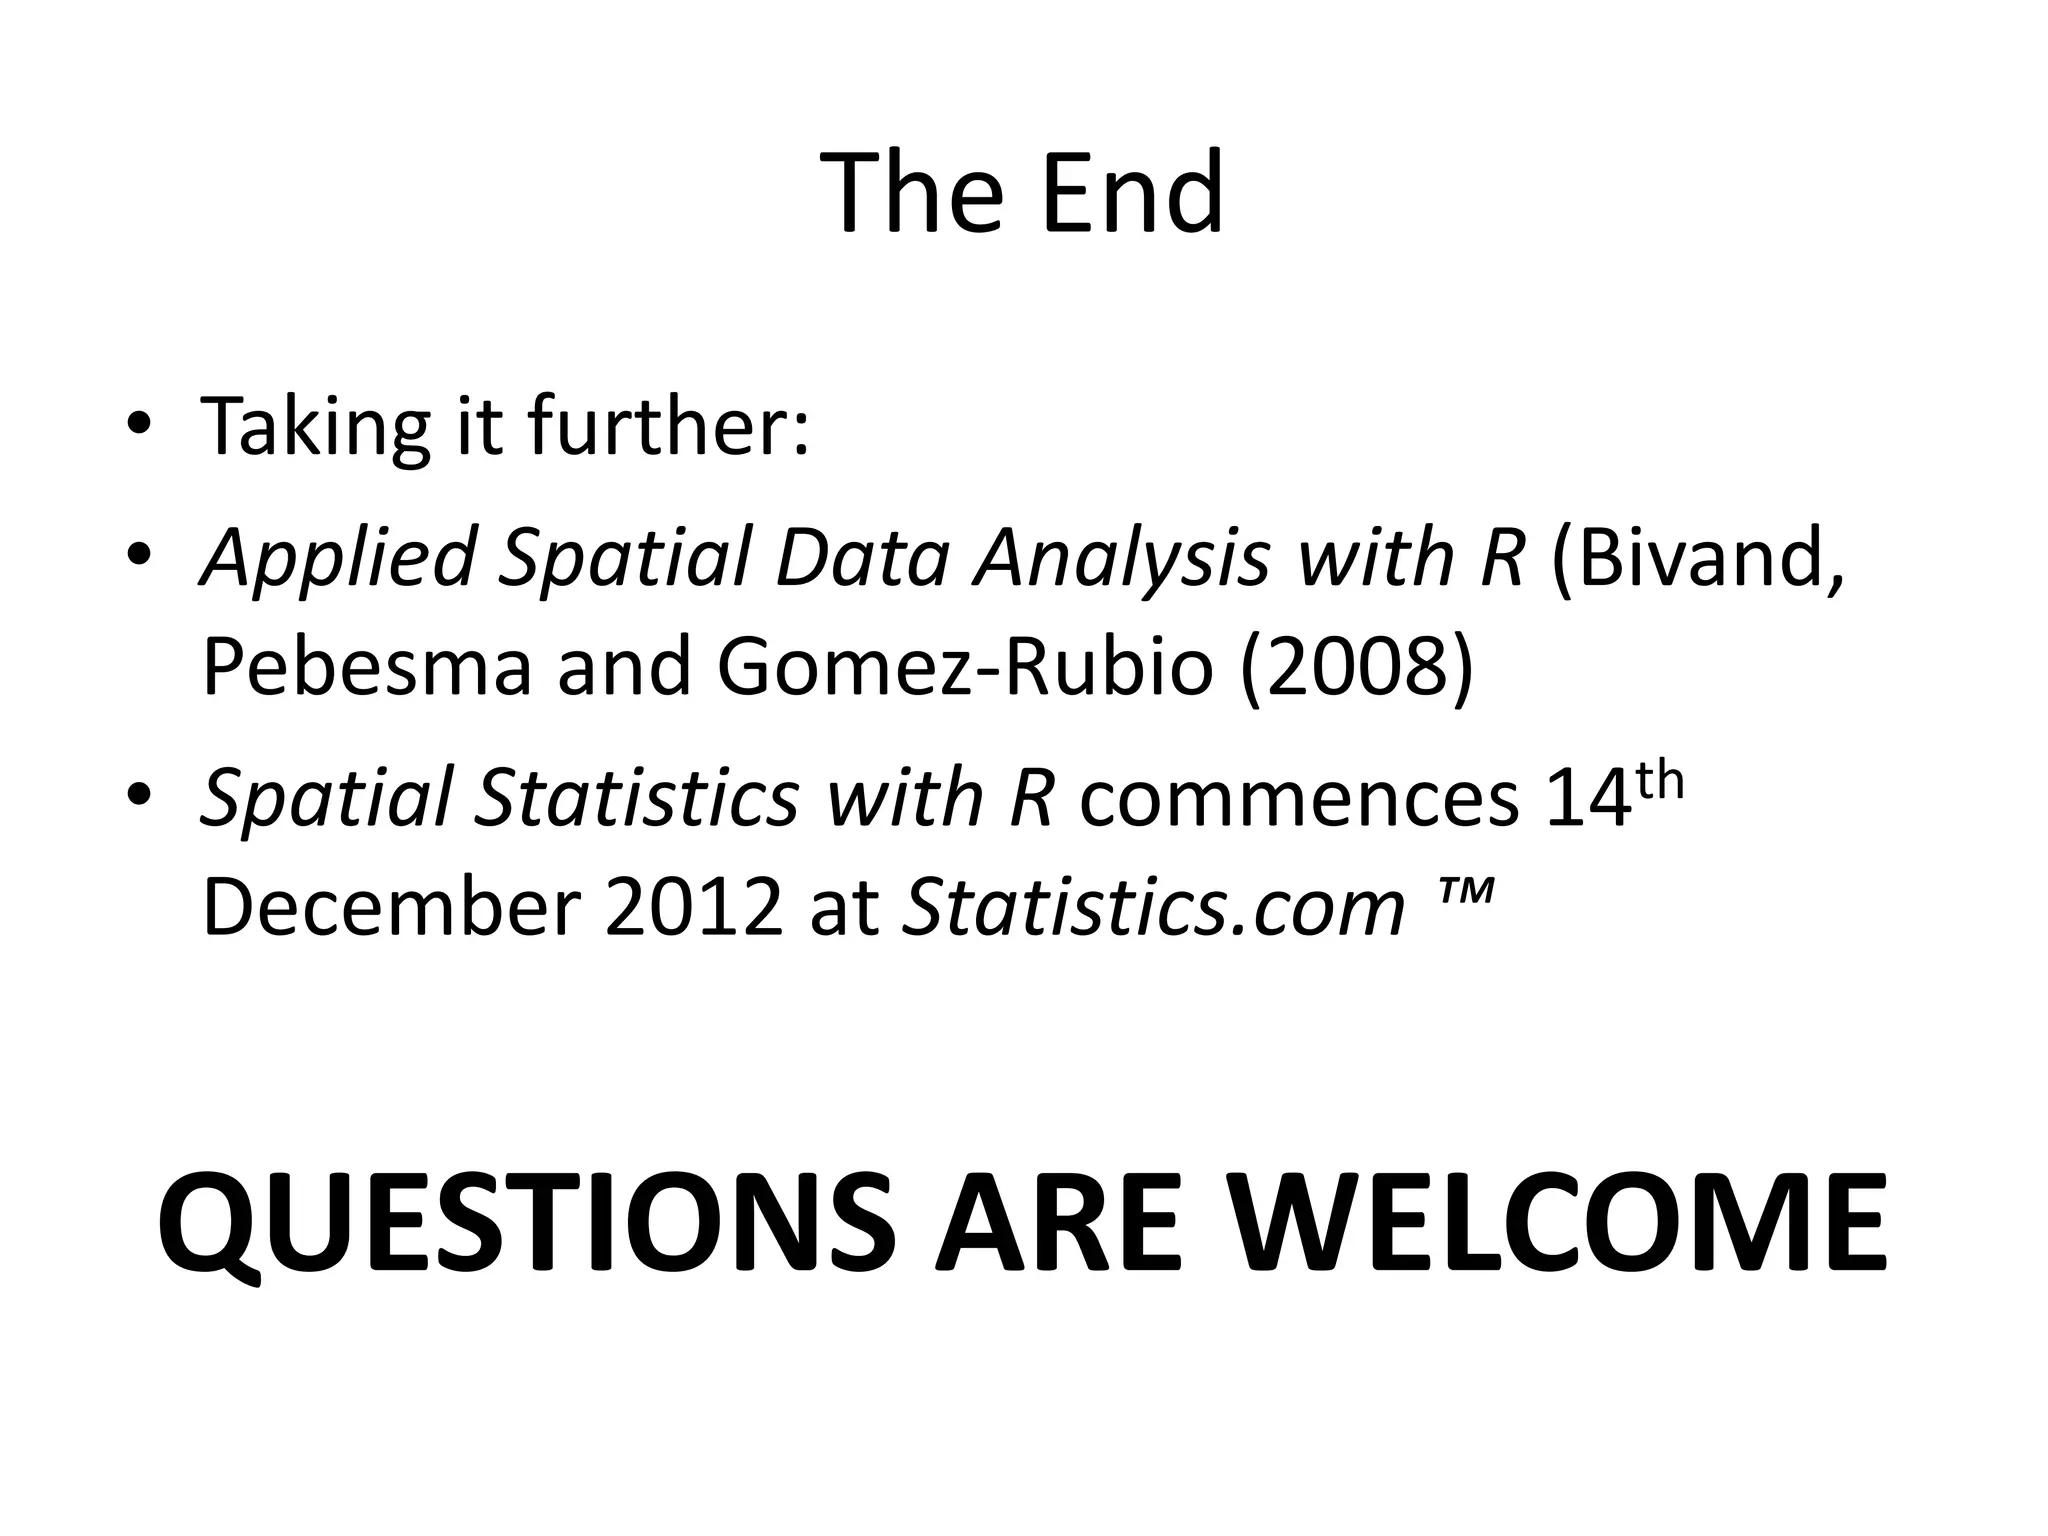
![> library(sp)
> getClass("Spatial")
Class "Spatial" [package "sp"]
Slots:
Name: bbox proj4string
Class: matrix CRS
Known Subclasses:
Class "SpatialPoints", directly
Class "SpatialLines", directly
Class "SpatialPolygons", directly
Class "SpatialPointsDataFrame", by class "SpatialPoints", distance 2
Class "SpatialPixels", by class "SpatialPoints", distance 2
Class "SpatialLinesDataFrame", by class "SpatialLines", distance 2
Class "SpatialGrid", by class "SpatialPoints", distance 3
Class "SpatialPixelsDataFrame", by class "SpatialPoints", distance 3
Class "SpatialGridDataFrame", by class "SpatialPoints", distance 4
Class "SpatialPolygonsDataFrame", by class "SpatialPolygons", distance 2](https://image.slidesharecdn.com/spatialanalysisinrwebinar-120613112057-phpapp02/75/Finding-Meaning-in-Points-Areas-and-Surfaces-Spatial-Analysis-in-R-11-2048.jpg)
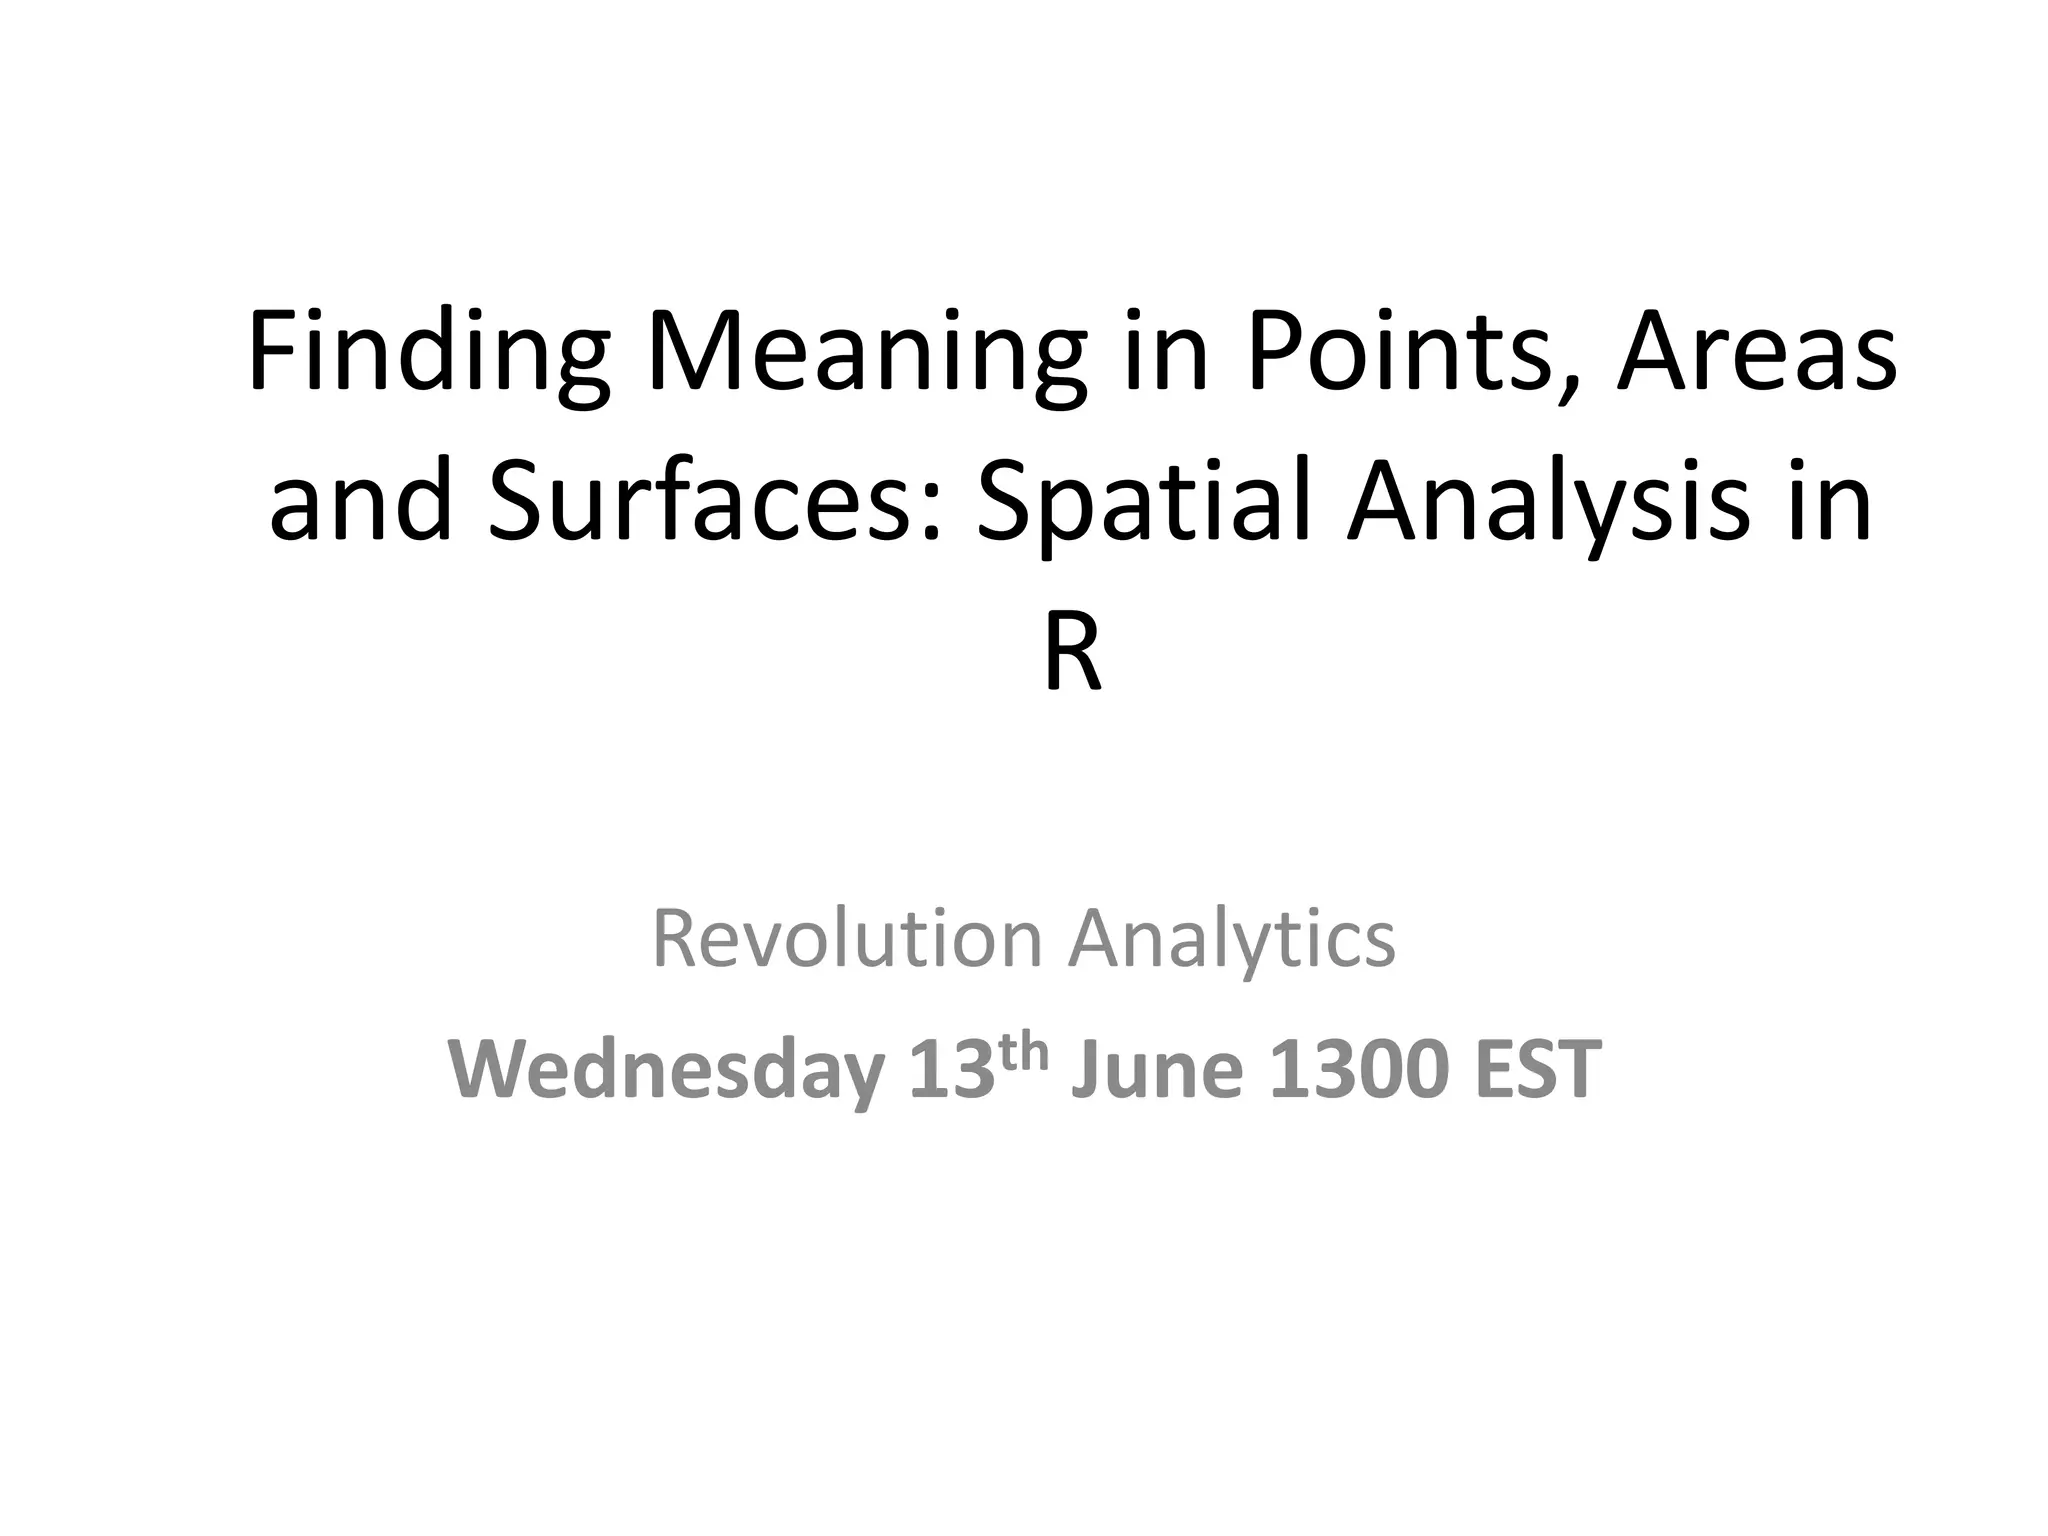
![Chi-square mapping using ‘Pearsonian’ Residuals
> sum(lips$CANCER)
[1] 536
> sum(lips$POP)
[1] 14979894
>pop_exp<-
536*(lips$POP/14979894)
> chisq <- (lips$CANCER-
pop_exp)/sqrt(pop_exp)
> lips_chi <- spCbind(lips, chisq)
>spplot(lips_chi,"chisq")](https://image.slidesharecdn.com/spatialanalysisinrwebinar-120613112057-phpapp02/75/Finding-Meaning-in-Points-Areas-and-Surfaces-Spatial-Analysis-in-R-29-2048.jpg)
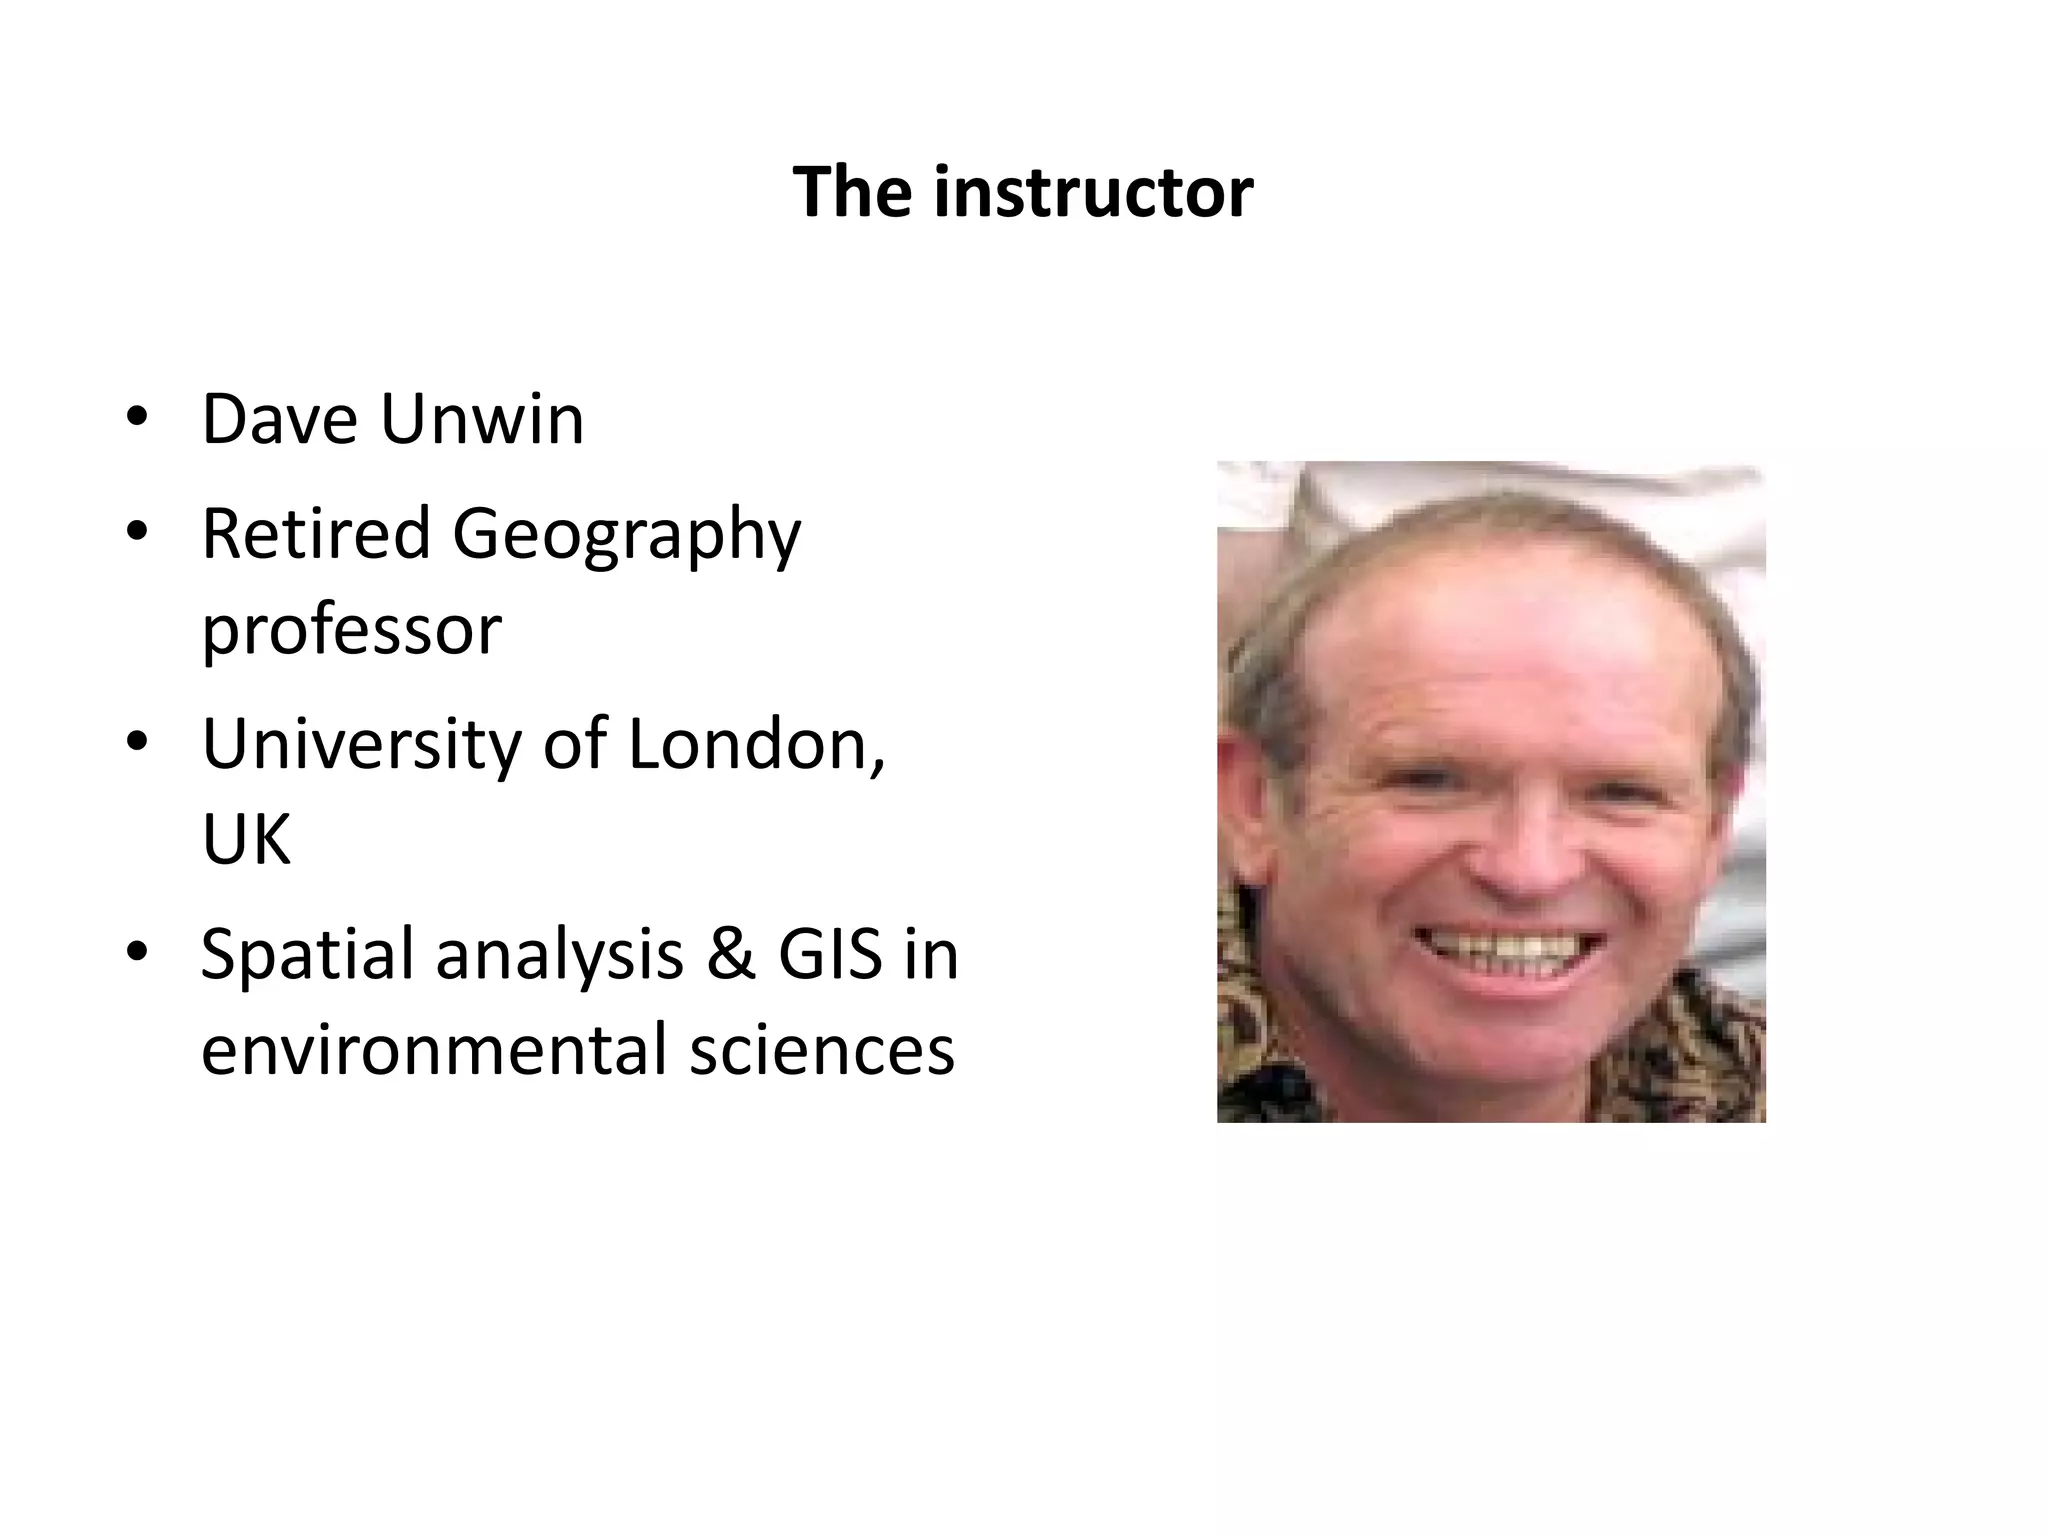
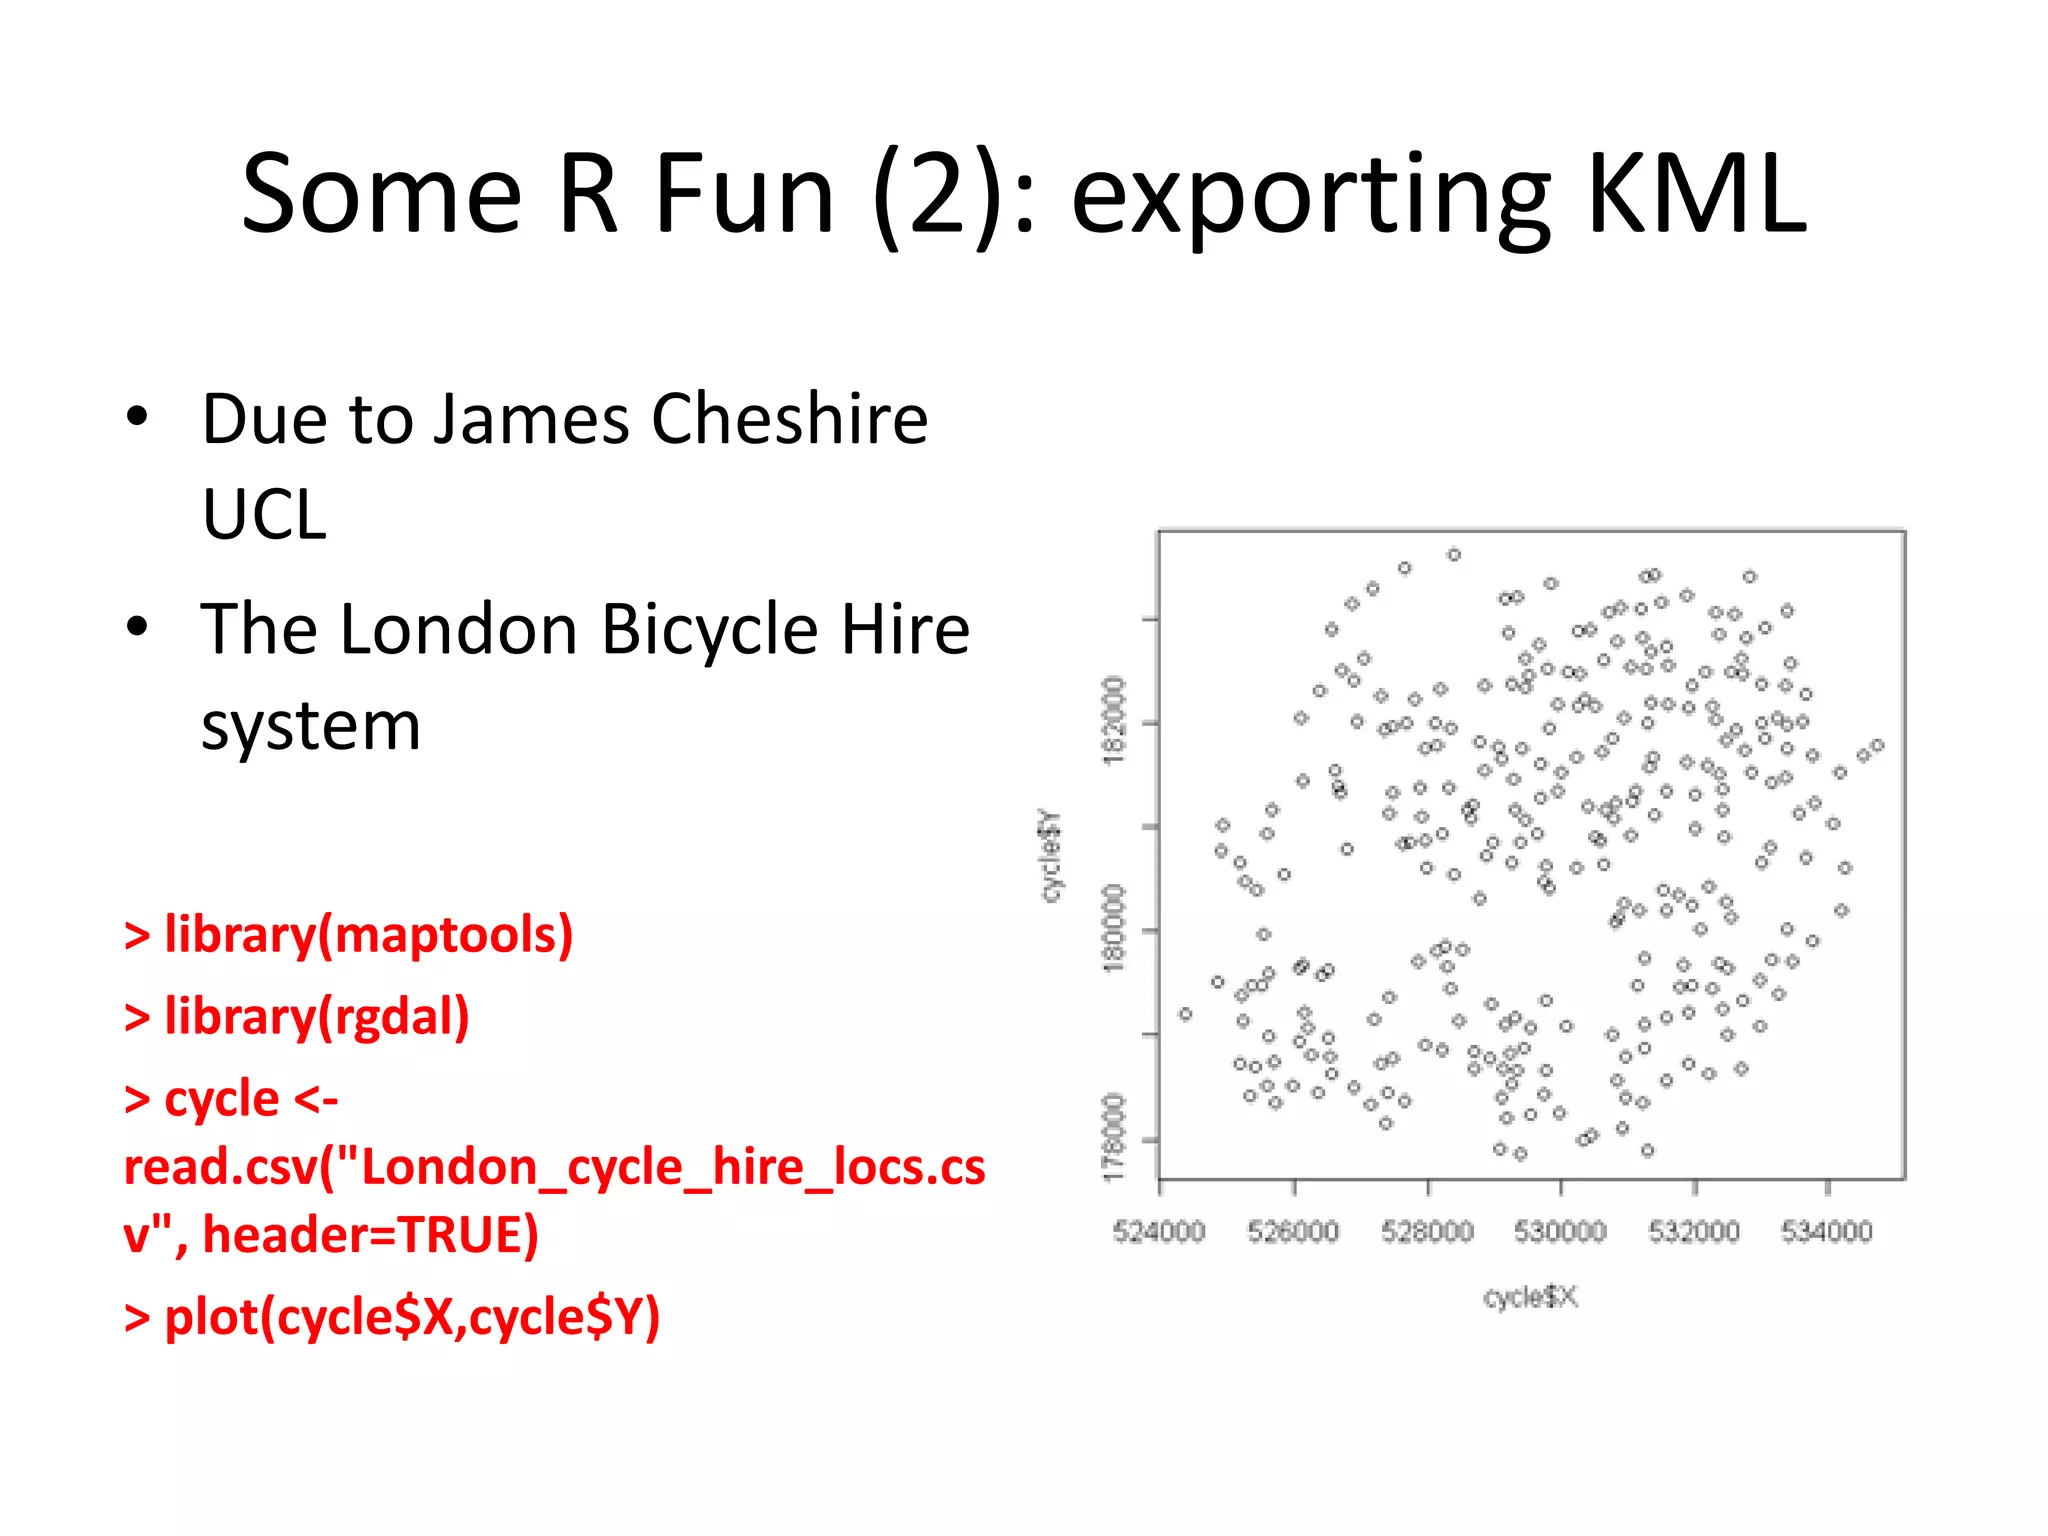
![Some R-fun (1) : using dismo
>library(XML) #needs this
> library(rgdal) #and this
>library (dismo)
> place<-geocode("Maidwell, > size<-extent(unlist(place[4:7]))
Northamptonshire, UK") #the #what does this do?
address needs to have enough to be > map<-gmap(size,type="satellite")
recognized > plot(map)
> place # the place object is a vector > map<-gmap(size,type="roadmap")
of length 7 with a bounding box: > plot(map)
ID lon lat lonmin lonmax
latmin latmax To find places and plot
1 1 -0.9030642 52.38524 -0.938073 them using Google
-0.8710494 52.37016 52.40107 Earth and Maps™
location
1 Maidwell, Northamptonshire, UK](https://image.slidesharecdn.com/spatialanalysisinrwebinar-120613112057-phpapp02/75/Finding-Meaning-in-Points-Areas-and-Surfaces-Spatial-Analysis-in-R-43-2048.jpg)
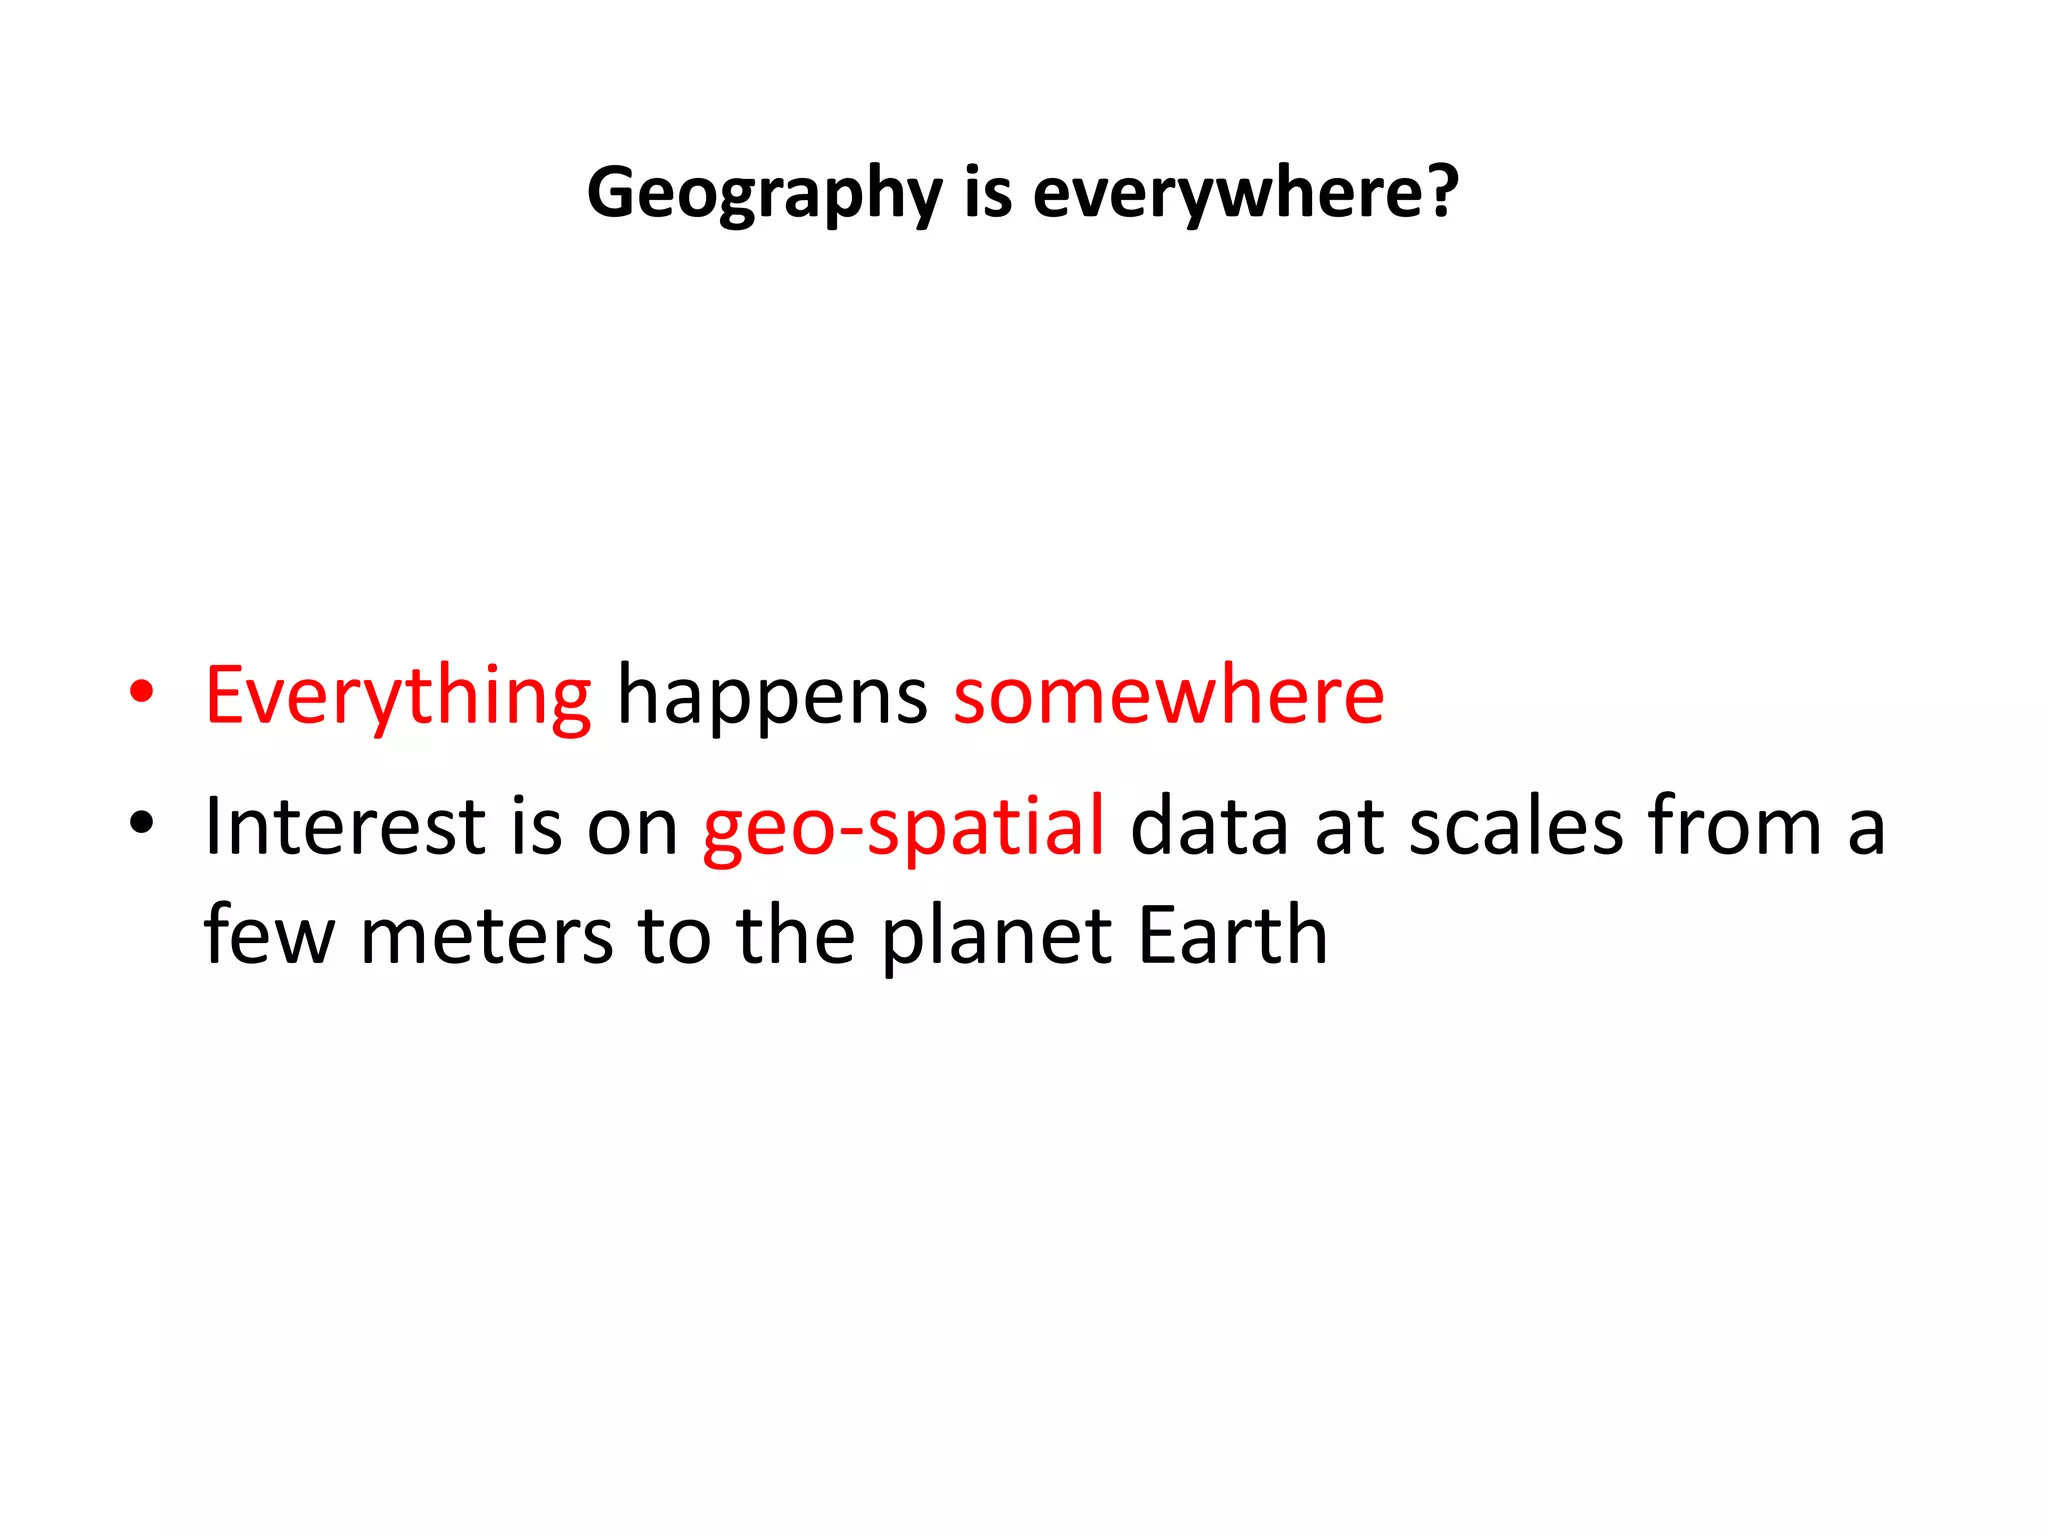
![Or (slightly) better known?
> place<-geocode("The White
House, Washington, USA")
> size<-
extent(unlist(place[4:7]))
> map<-
gmap(size,type="satellite")
> plot(map)](https://image.slidesharecdn.com/spatialanalysisinrwebinar-120613112057-phpapp02/75/Finding-Meaning-in-Points-Areas-and-Surfaces-Spatial-Analysis-in-R-45-2048.jpg)

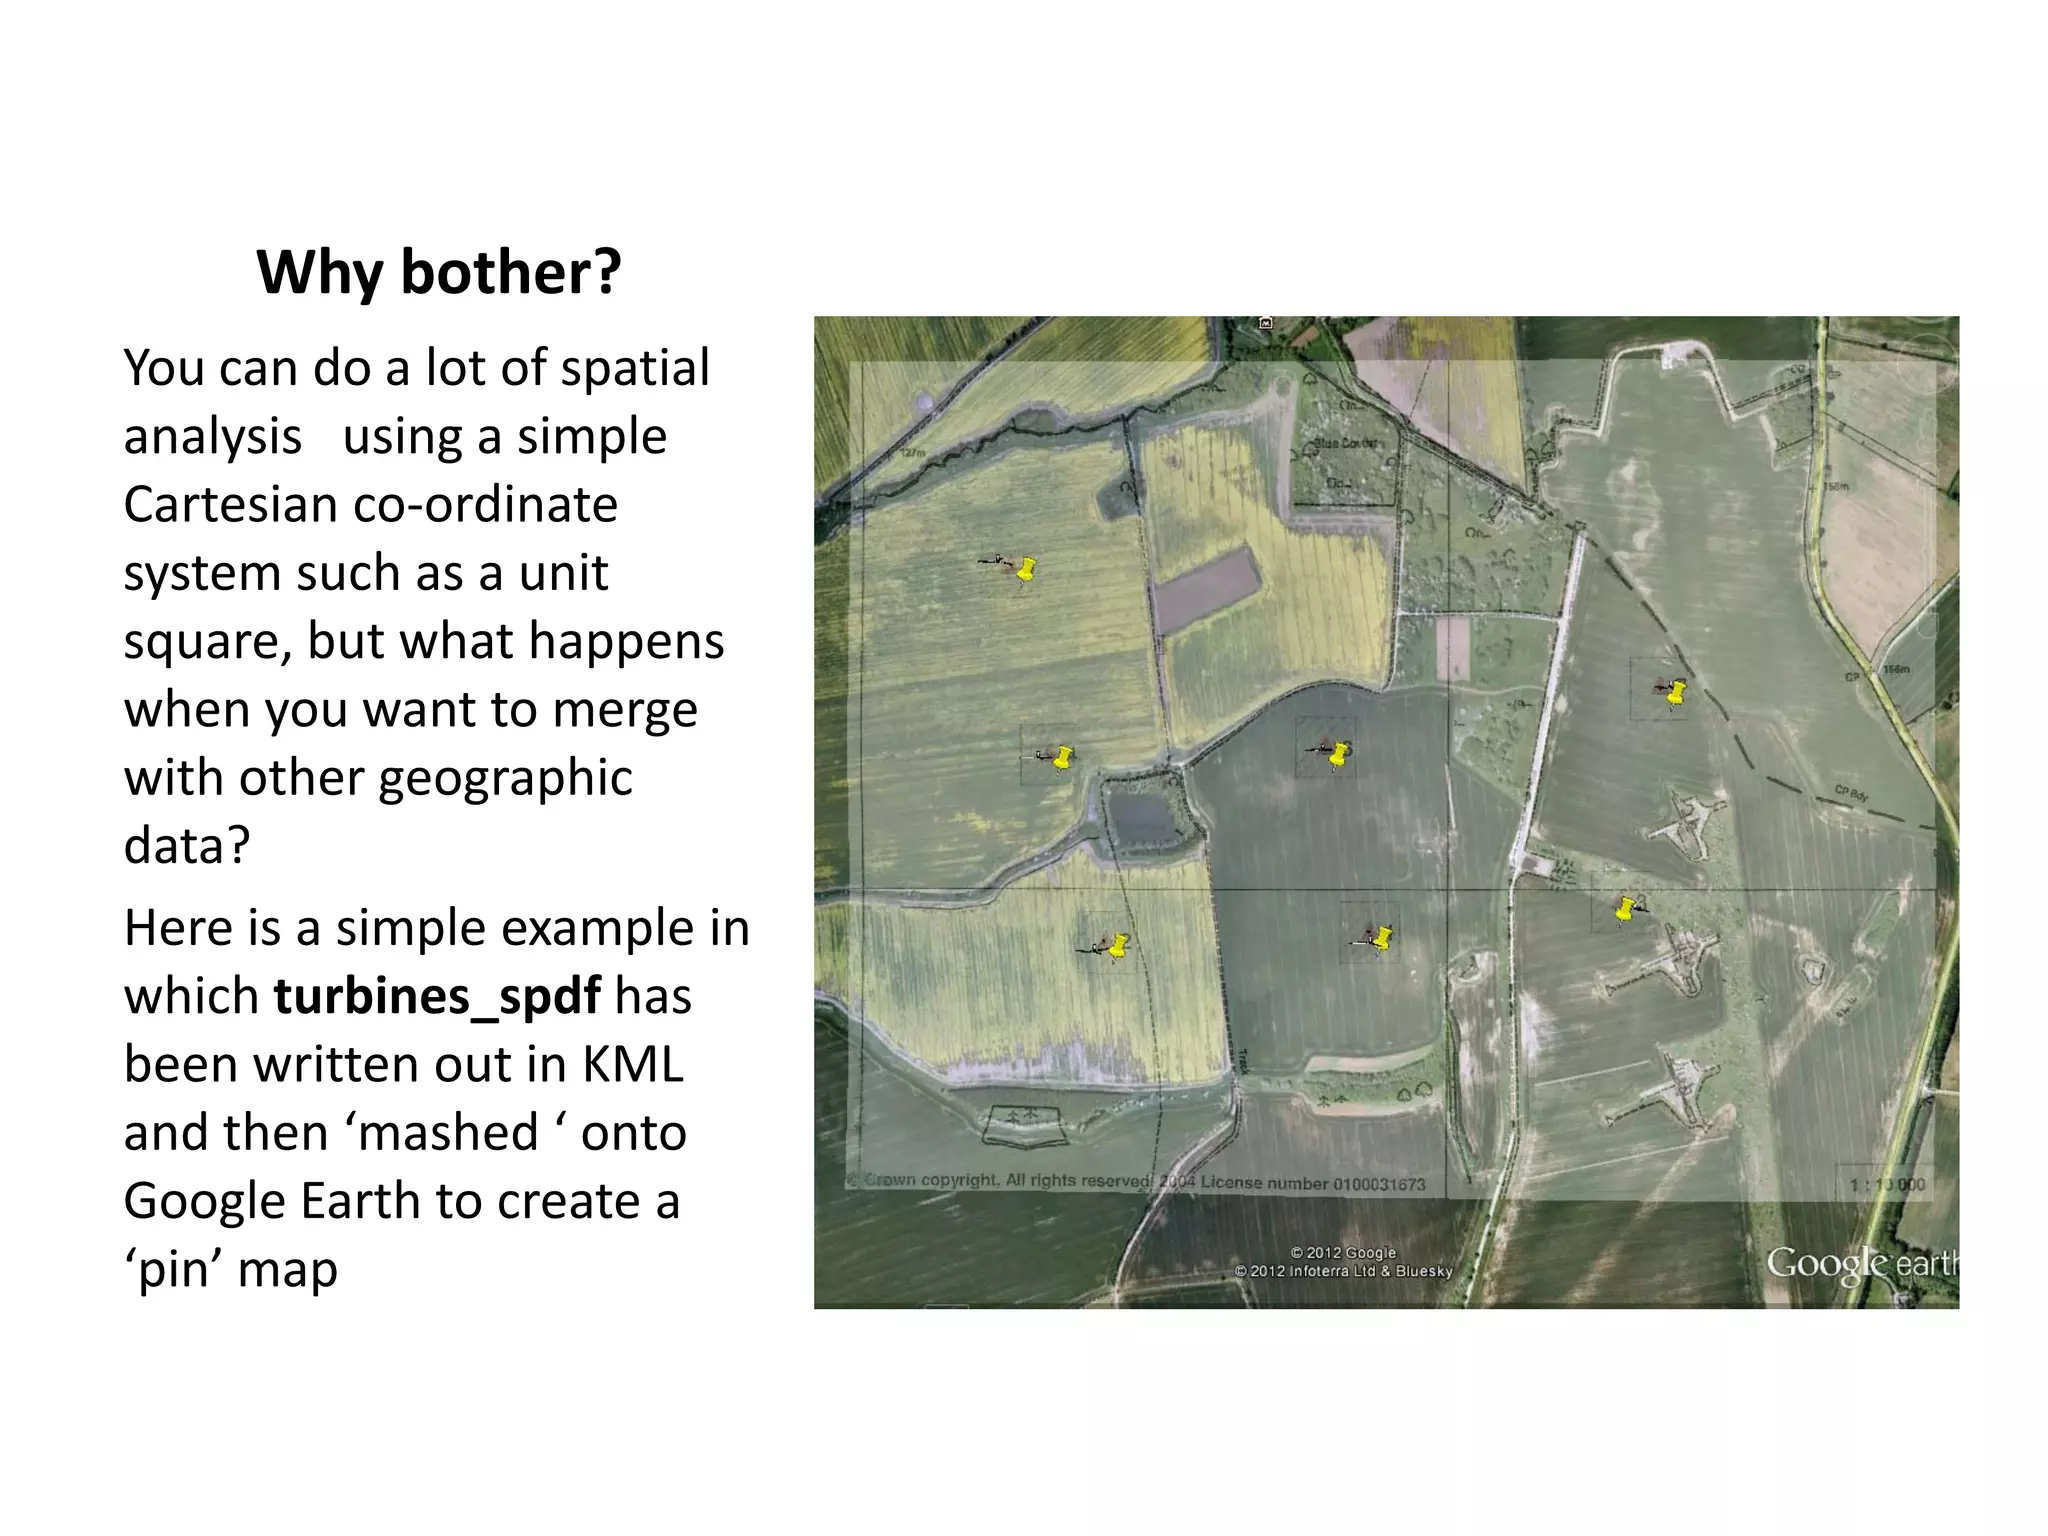
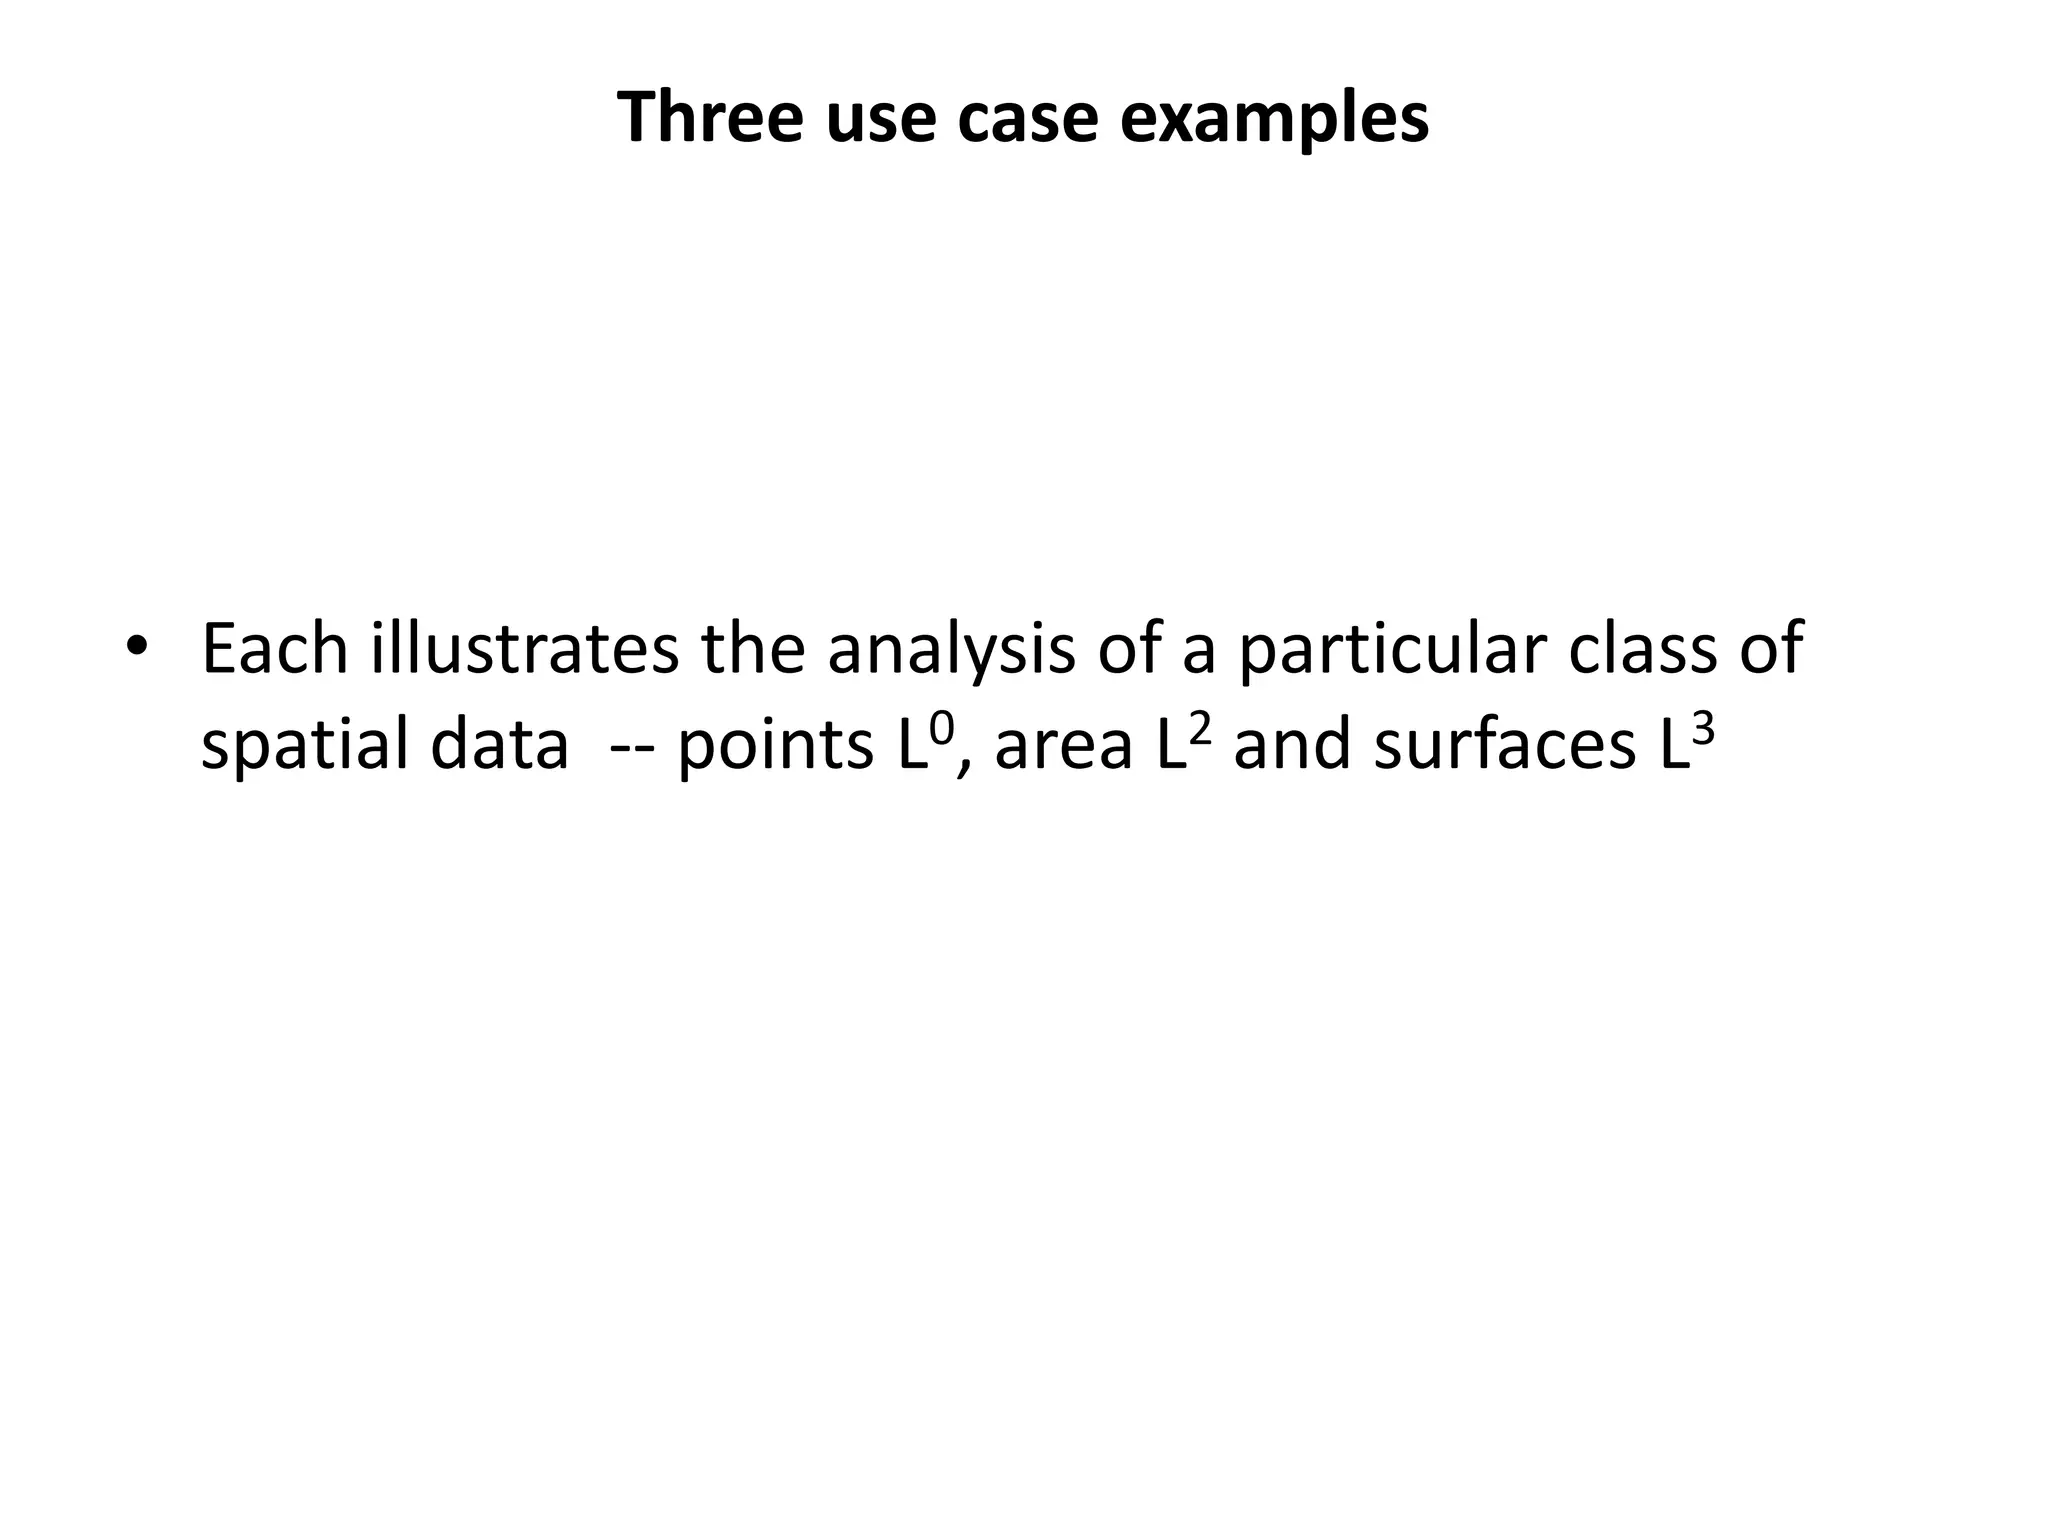
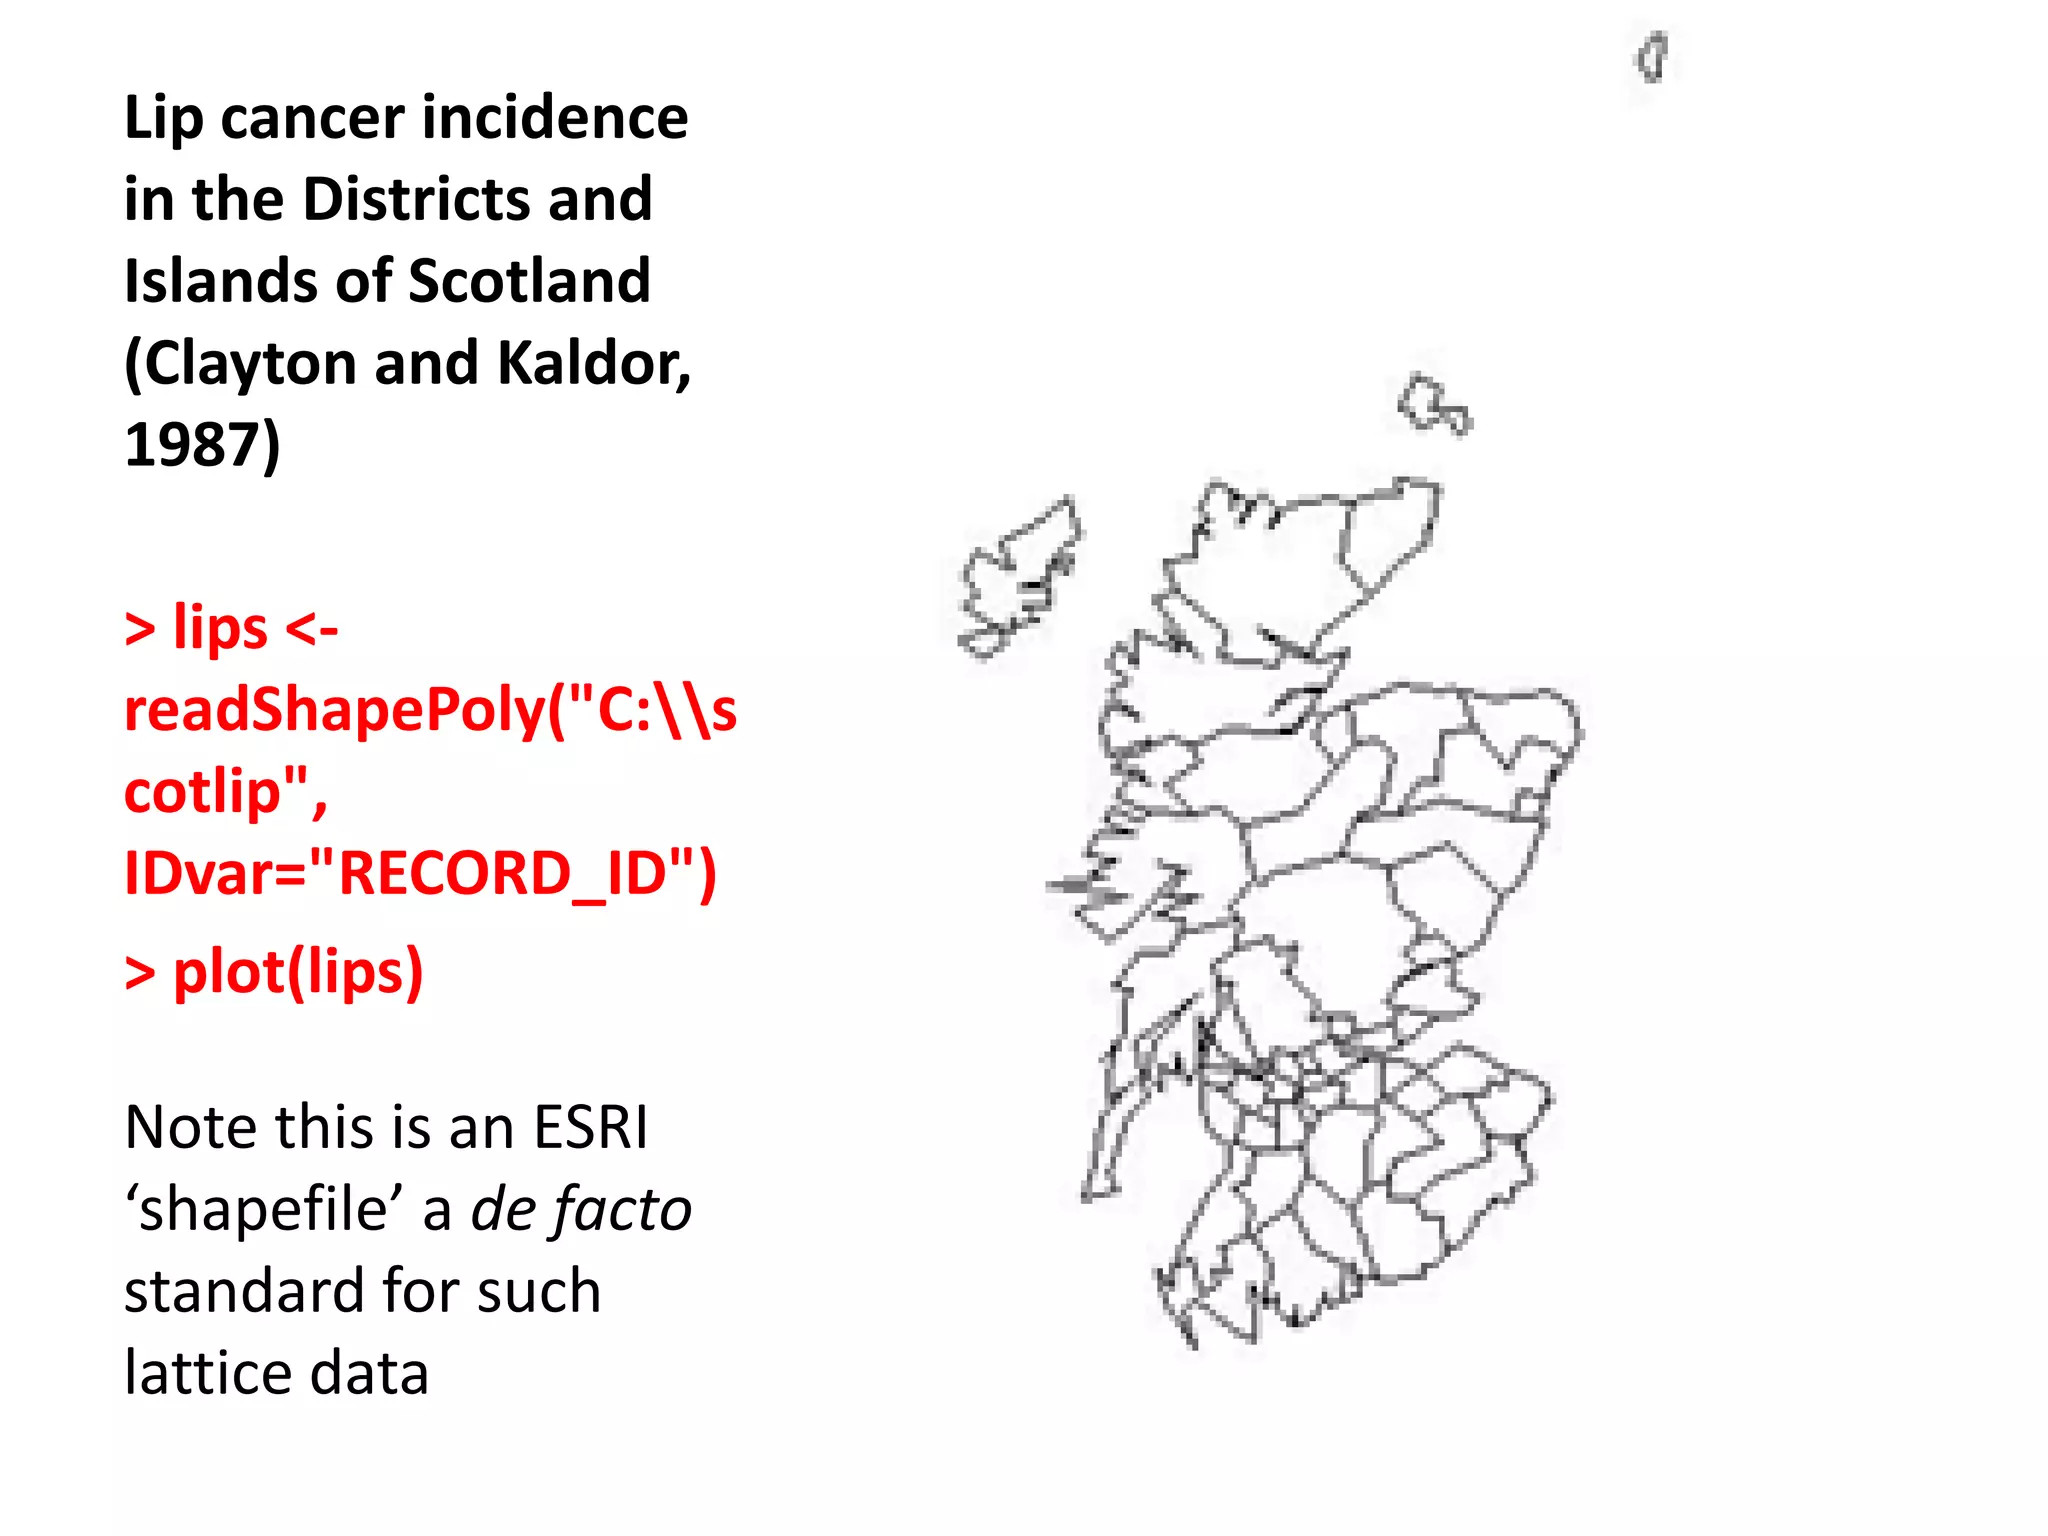
The document discusses spatial analysis using R, led by instructor Dave Unwin, focusing on the use of geo-spatial data and methods for analyzing point patterns and continuous variables. It outlines various spatial data structures, measurement techniques, and specific analytical packages designed for geostatistical applications. The session includes practical examples and applications in environmental sciences to understand spatial patterns and dependencies.


![Spatial_Data_Analysis_with_open_source_softwares[1]](https://cdn.slidesharecdn.com/ss_thumbnails/8db4d971-8e8c-4fd8-8682-b20e5d6cd65f-161221072847-thumbnail.jpg?width=640&height=640&fit=bounds)