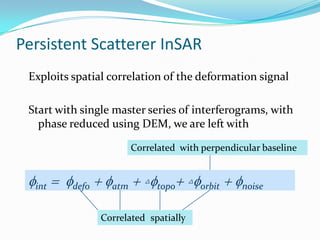
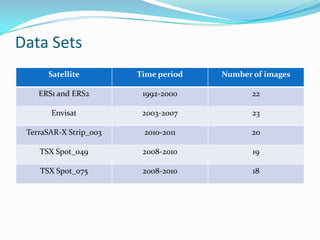
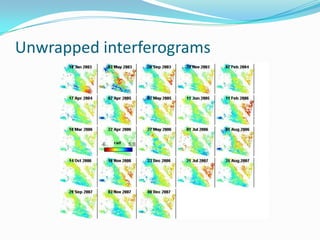
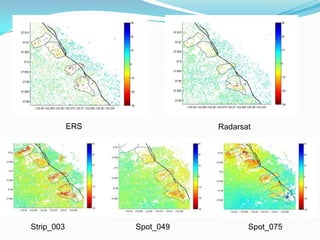
A ~25 slide presentation that explains the underlying principles and some applications of InSAR, with a particular focus on the measurement of deformation due to earthquakes. The presentation could be used in a lecture or lab setting, or provided to students for review out of class. The slides are annotated with additional background information designed to assist instructors.
SAR is a type of radar which works with antenna and receiver using radio waves which can create two dimension or three dimension of the objects . A synthetic-aperture radar is an imaging radar mounted on a moving platform. SAR gives high resolution data and works 24*7.
This content presents for basic of Synthetic Aperture Radar (SAR) including its geometry, how the image is created, essential parameters, interpretation, SAR sensor specification, and advantages and disadvantages.
SBAS-DInSAR processing on the ESA Geohazards Exploitation PlatformEmmanuel Mathot
In the context of space-borne geodetic techniques, Differential Synthetic Aperture Radar Interferometry (DInSAR) has demonstrated its high performance in measuring surface displacements in different conditions and scenarios, both natural and anthropic. In particular, the advanced DInSAR time series processing method referred to as Small BAseline Subset (SBAS), that allows studying both the spatial and temporal variability of the surface displacements, has proven to be particularly suitable in different contexts, as for natural hazards (volcanoes, earthquakes and landslides) and human-induced deformation (subsidence due to aquifer exploitation, mining operations, and building of large infrastructures). Recently, an efficient implementation of this algorithm (referred to as P-SBAS approach) has been fully integrated within the ESA’s Grid Processing on Demand (G-POD) environment, which is part of the [Geohazards Thematic Exploitation Platform (GEP)](https://geohazards-tep.eo.esa.int/#!) of ESA. The GEP is devoted to the exploitation of EO data resources in the context of the Geohazard Supersites & Natural Laboratories as well as on the CEOS Pilots on Seismic Hazards and Volcanoes. The GEP is sourced with elements, data and processing, including P-SBAS, relevant to the geohazards theme. The integration of the P-SBAS algorithm within GEP resulted in a web-based tool freely available to the scientific community. This tool allows users to process, from their own laptops, the European SAR data archives (ERS, ENVISAT and Sentinel-1) for obtaining surface displacement maps and time series in a completely unsupervised way, without caring about data download and processing facility procurements. The workshop is organized in four parts. First, a short overview on the DInSAR processing methods allowing retrieving mean surface deformation maps and displacement time series will be provided, with a specific focus on the SBAS-DInSAR technique. Secondly, the GEP and G-POD environments will be introduced and the P-SBAS web tool will be presented. The third and the fourth parts are dedicated to the advanced features and to case studies and results achieved via the web tool, respectively.
How to better understand SAR, interpret SAR products and realize the limitationsNopphawanTamkuan
This content shows how to better understand SAR (how to interpret SAR images and read SAR interferogram ). Moreover, capacities and limitations of SAR are discussed for each disaster emergency mapping (Flood, Landslide and Earthquake).
Photogrammetry Surveying, its Benefits & DrawbacksNI BT
Learn the Photogrammetry Surveying and benefits-drawbacks of photogrammetry. Photogrammetry is the process of generating a 3D model from a set of 2D photographs. In Surveying, this is done by taking two or more images of the same point from different angles
The advantage of digital imagery is that it allows us to manipulate the digital pixel values in the image. Even after the radiometric corrections image may still not be optimized for visual interpretation. An image 'enhancement' is basically anything that makes it easier or better to visually interpret. An enhancement is performed for a specific application as well. This enhancement may be inappropriate for another purpose, which would demand a different type of enhancement.
Filtering is used to enhance the appearance of an image. Spatial filters are designed to highlight or suppress specific features in an image based on their spatial frequency. ‘Rough’ textured areas of an image, where the changes in tone are abrupt, have high spatial frequencies, while ‘smooth’ areas with little variation have low spatial frequencies. A common filtering procedure involves moving a ‘matrix' of a few pixels in dimension (ie. 3x3, 5x5, etc.) over each pixel in the image, using mathematical calculation and replacing the central pixel with the new value.
A low-pass filter is designed to emphasize larger, homogeneous areas of similar tone and reduce the smaller detail in an image. Thus, low-pass filters generally serve to smooth the appearance of an image. In some cases, like 'low-pass filtering', the enhanced image can actually look worse than the original, but such an enhancement was likely performed to help the interpreter see low spatial frequency features among the usual high frequency clutter found in an image. High-pass filters do the opposite and serve to sharpen the appearance of fine detail in an image. Directional, or edge detection filters are designed to highlight linear features, such as roads or field boundaries. These filters can also be designed to enhance features which are oriented in specific directions.
THIS PRESENTATION IS TO HELP YOU PERFORM THE TASK STEP BY STEP.
Characterizing Landslide Deformation Using InSARguest06bc949
Alberta Geological Survey's work with corner reflector InSAR at the Little Smoky landslide in Alberta.
Presented in 2008 at the 4th Canadian Conference on Geohazards.
Interferometric and Geodetic Validation of Sentinel-1petarmar
Experiences and summary of SAR/InSAR calibration and validation results from the 1st year of Sentinel-1 operation.
Authors: Petar Marinkovic (PPO.labs), Yngvar Larsen (Norut), Zbigniew Perski (PGI), Tom Rune Lauknes (Norut), John Dehls (NGU)
Presented at CEOS Calibration and Validation Workshop 2015, October 27-29, 2015, at ESA-ESTEC, in Noordwijk, The Netherlands
Operational exploitation of the Sentinel-1 mission: implications for geosciencepetarmar
Poster presented at American Geophysical Union (AGU), Fall Meeting, San Francisco, 12-16 December 2016
Title: Operational exploitation of the Sentinel-1 mission: implications for geoscience
Sub-title: Lessons learned from ESA SEOM InSARap project
Authors: Yngvar Larsen (Norut), Petar Marinkovic (PPO.labs), John Dehls (NGU), Zbigniew Perski (PGI), Andy Hooper(Uni.Leeds), Tim Wright(Uni.Leeds)
Acknowledgment: ESA SEOM programme
Speckle is the major multiplicative noise in the SAR(Radar) images, Improvement is done by using stochastic distance methods by assuming data as gamma distribution which enhances the images by 78% overall....
CLASSIFICATION AND COMPARISION OF REMOTE SENSING IMAGE USING SUPPORT VECTOR M...ADEIJ Journal
Remote sensing is collecting information about an object without any direct physical contact with the particular object. It is widely used in many fields such as oceanography, geology, ecology. Remote sensing uses the Satellite to detect and classify the particular object or area. They also classify the object on the earth surfaces which includes Vegetation, Building, Soil, Forest and Water. The approach uses the classifiers of previous images to decrease the required number of training samples for the classifier training of an incoming image. For each incoming image, a rough classifier is predicted first based on the temporal trend of a set of previous classifiers. The predicted classifier is then fine-tuned into a more accurate manner with current training samples. This approach can be further applied as sequential image data, with only a small number of training samples, which are being required from each image. This method uses LANSAT 8 images for Training and Testing processes. First, using the Classifier Prediction technique the Signatures are being generated for the input images. The generated Signatures are used for the Training purposes. SVM Classification is used for classifying the images. The final results describes that the leverage of a priori information from previous images will provide advantageous improvement for future images in multi temporal image classification.
International Journal of Engineering Research and Applications (IJERA) is an open access online peer reviewed international journal that publishes research and review articles in the fields of Computer Science, Neural Networks, Electrical Engineering, Software Engineering, Information Technology, Mechanical Engineering, Chemical Engineering, Plastic Engineering, Food Technology, Textile Engineering, Nano Technology & science, Power Electronics, Electronics & Communication Engineering, Computational mathematics, Image processing, Civil Engineering, Structural Engineering, Environmental Engineering, VLSI Testing & Low Power VLSI Design etc.
Conferencia impartida por Sebastián Sánchez en los Viernes Científicos organizada por la Facultad de Ciencias Experimentales de la Universidad de Almería el 14 de enero de 2011.
The peer-reviewed International Journal of Engineering Inventions (IJEI) is started with a mission to encourage contribution to research in Science and Technology. Encourage and motivate researchers in challenging areas of Sciences and Technology.
On the processing of aerial LiDAR data for supporting enhancement, interpreta...Beniamino Murgante
On the processing of aerial LiDAR data for supporting enhancement, interpretation and mapping of archaeological features
Rosa Lasaponara - Institute of Methodologies for Environmental Analysis, National Research Council, Italy
Nicola Masini- Archaeological and monumental heritage institute, National Research Council, Italy
2024.06.01 Introducing a competency framework for languag learning materials ...Sandy Millin
http://sandymillin.wordpress.com/iateflwebinar2024
Published classroom materials form the basis of syllabuses, drive teacher professional development, and have a potentially huge influence on learners, teachers and education systems. All teachers also create their own materials, whether a few sentences on a blackboard, a highly-structured fully-realised online course, or anything in between. Despite this, the knowledge and skills needed to create effective language learning materials are rarely part of teacher training, and are mostly learnt by trial and error.
Knowledge and skills frameworks, generally called competency frameworks, for ELT teachers, trainers and managers have existed for a few years now. However, until I created one for my MA dissertation, there wasn’t one drawing together what we need to know and do to be able to effectively produce language learning materials.
This webinar will introduce you to my framework, highlighting the key competencies I identified from my research. It will also show how anybody involved in language teaching (any language, not just English!), teacher training, managing schools or developing language learning materials can benefit from using the framework.
Synthetic Fiber Construction in lab .pptxPavel ( NSTU)
Synthetic fiber production is a fascinating and complex field that blends chemistry, engineering, and environmental science. By understanding these aspects, students can gain a comprehensive view of synthetic fiber production, its impact on society and the environment, and the potential for future innovations. Synthetic fibers play a crucial role in modern society, impacting various aspects of daily life, industry, and the environment. ynthetic fibers are integral to modern life, offering a range of benefits from cost-effectiveness and versatility to innovative applications and performance characteristics. While they pose environmental challenges, ongoing research and development aim to create more sustainable and eco-friendly alternatives. Understanding the importance of synthetic fibers helps in appreciating their role in the economy, industry, and daily life, while also emphasizing the need for sustainable practices and innovation.
The Art Pastor's Guide to Sabbath | Steve ThomasonSteve Thomason
What is the purpose of the Sabbath Law in the Torah. It is interesting to compare how the context of the law shifts from Exodus to Deuteronomy. Who gets to rest, and why?
Read| The latest issue of The Challenger is here! We are thrilled to announce that our school paper has qualified for the NATIONAL SCHOOLS PRESS CONFERENCE (NSPC) 2024. Thank you for your unwavering support and trust. Dive into the stories that made us stand out!
Operation “Blue Star” is the only event in the history of Independent India where the state went into war with its own people. Even after about 40 years it is not clear if it was culmination of states anger over people of the region, a political game of power or start of dictatorial chapter in the democratic setup.
The people of Punjab felt alienated from main stream due to denial of their just demands during a long democratic struggle since independence. As it happen all over the word, it led to militant struggle with great loss of lives of military, police and civilian personnel. Killing of Indira Gandhi and massacre of innocent Sikhs in Delhi and other India cities was also associated with this movement.
How to Make a Field invisible in Odoo 17Celine George
It is possible to hide or invisible some fields in odoo. Commonly using “invisible” attribute in the field definition to invisible the fields. This slide will show how to make a field invisible in odoo 17.
The Indian economy is classified into different sectors to simplify the analysis and understanding of economic activities. For Class 10, it's essential to grasp the sectors of the Indian economy, understand their characteristics, and recognize their importance. This guide will provide detailed notes on the Sectors of the Indian Economy Class 10, using specific long-tail keywords to enhance comprehension.
For more information, visit-www.vavaclasses.com
Welcome to TechSoup New Member Orientation and Q&A (May 2024).pdfTechSoup
In this webinar you will learn how your organization can access TechSoup's wide variety of product discount and donation programs. From hardware to software, we'll give you a tour of the tools available to help your nonprofit with productivity, collaboration, financial management, donor tracking, security, and more.
Chapter 3 - Islamic Banking Products and Services.pptx
PERSISTENT SCATTERER SAR INTERFEROMETRY APPLICATION.pptx
1. Persistent scatterersarinterferometry application on berkeley hills landslides Ling Lei1,2, Yinqing Zhou1, Jingwen Li, Roland Bürgmann2 1 Beijing University of Aeronautics and Astronautics (Beihang University) 2 Berkeley Seismological Lab, University of California
13. Persistent ScattererInSAR Exploits spatial correlation of the deformation signal Start with single master series of interferograms, with phase reduced using DEM, we are left with Correlated with perpendicular baseline intdefoatm△topo△orbitnoise Correlatedspatially