Downloaded 642 times

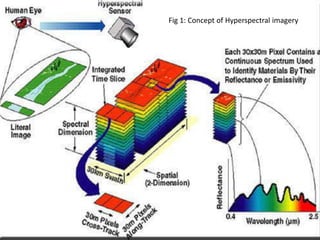
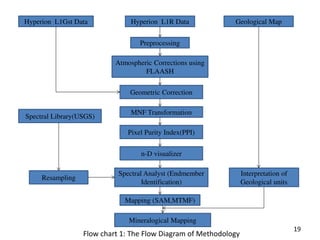
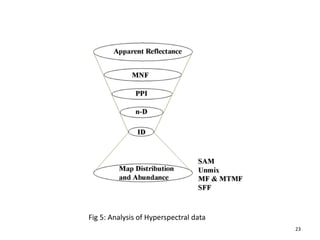
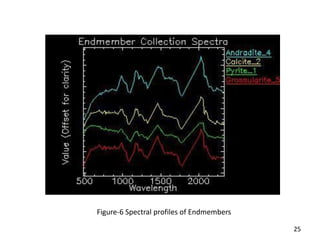
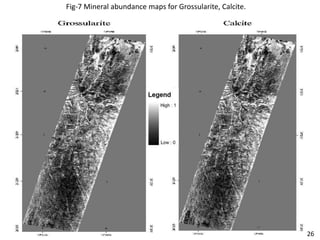
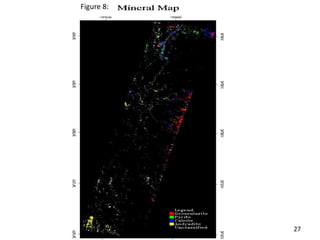

- The document discusses using hyperspectral remote sensing for mineral mapping. It provides background on how minerals have unique spectral signatures and defines hyperspectral imagery as image cubes with spatial and spectral data. - Two case studies are summarized that demonstrate using techniques like atmospheric correction, MNF transformation, and spectral analysis tools like SAM and MTMF on Hyperion satellite imagery to map minerals in areas of India and Pakistan. Key minerals identified include grossularite, calcite, pyrite, andradite, and dolomite. - The methodology involves preprocessing the hyperspectral cube, identifying endmembers, and then classifying and mapping minerals present based on their spectral properties and signatures in the imagery.