Downloaded 512 times


![17
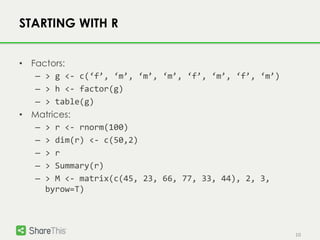
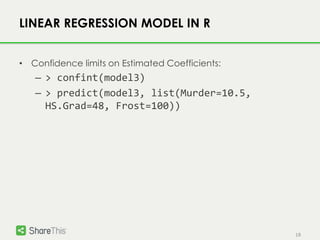
LINEAR REGRESSION MODEL IN R
• Model Built-in Data:
– > colnames(st)[4] = "Life.Exp"
– > colnames(st)[6] = "HS.Grad"
– model1 = lm(Life.Exp ~ Population + Income
+ Illiteracy + Murder + HS.Grad + Frost +
Area + Density, data=st)
– > summary(model1)
– > model2 <- step(model1)
– > model3 = update(model2, .~.-Population)
– > Summary(model3)](https://image.slidesharecdn.com/dataanalysiswithr-140612132735-phpapp02/85/Data-analysis-with-R-17-320.jpg)


The document provides an overview of R, a free and open-source programming language used for statistical computing and graphics, highlighting its multi-paradigmatic nature and extensive features, including statistical analysis and programming capabilities. It also details how to install and start using R, along with example codes for data manipulation and linear regression modeling. Additionally, it describes a case study involving ad click predictions and offers resources for further learning about R.


![Basics of R programming for analytics [Autosaved] (1).pdf](https://cdn.slidesharecdn.com/ss_thumbnails/basicsofrprogrammingforanalyticsautosaved1-240916080545-0682f8c8-thumbnail.jpg?width=640&height=640&fit=bounds)


