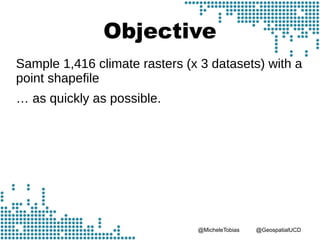
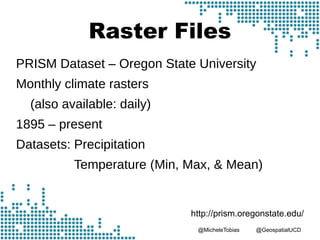
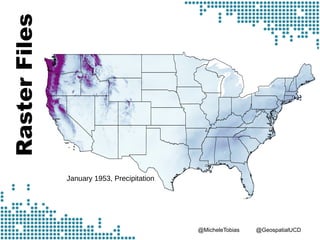
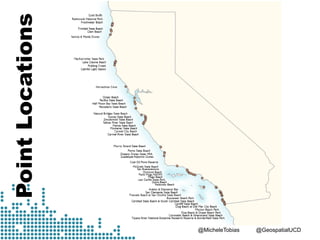
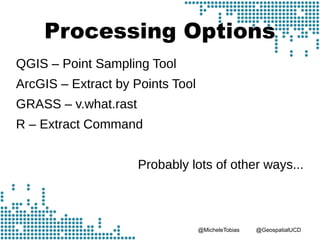
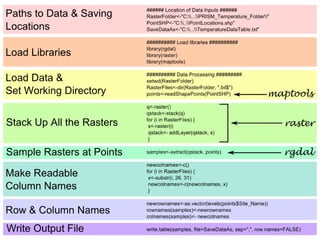
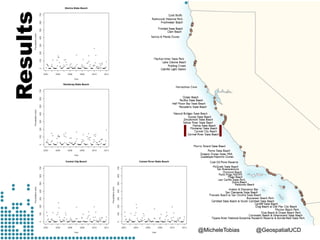
We the vitality of Mathematics in other field of sciences but we don't how and where it is being used. Here is another side of picture that how Mathematics lead us to explore the deep world of sciences like, geology, geography, earth sciences etc
Department of Geography and Geoinformation Science Seminar, George Mason University, Falls Church, VA, September 2015.
Increasingly, GIS is part of the collaboration between computer scientists, information scientists, and domain scientists to solve complex scientific questions. Successfully addressing scientific problems, such as informing regional decision- and policy-making for coastal zone management and marine spatial planning, requires integrative and innovative approaches to analyzing, modeling, and developing extensive and diverse data sets. The current chaotic distribution of available data sets, lack of documentation about them, and lack of easy-to-use access tools and computer modeling and analysis codes are still major obstacles for scientists and educators alike. Contributing solutions to these problems is part of an emerging science agenda at Esri for a range of environmental, conservation, climate and ocean sciences that will be discussed. The talk will highlight some recent projects in progress, including a new global map of ecological land units, new tools to support multidimensional scientific data, continued work on an ocean basemap, and more.
This tool solves a real problem in the environmental inventory industry and makes a valuable open data set more accessible.
The NJDEP maintains a statewide wildlife habitat data set that details conservation requirements related to environmental regulations. This is an open data set, but accessibility is limited since working with the one million habitat areas often requires knowledge of GIS software. Using desktop GIS software, a site-specific search is a time-intensive process, taking minutes or hours to run geoprocessing operations for specific properties.
Now, a user can draw a custom area in a browser window and return results in seconds.
Learn about how the project was built in this presentation.
Runoff Prediction of Gharni River Catchment of Maharashtra by Regressional An...ijtsrd
The present study deals with the prediction of runoff of a river catchment of maharastra by using linear regressional analysis and self organizing maps by handling numerical data. The prediction is done by using past data record. A mathematical model has been developed for rainfall runoff correlation. Warish Khan | Adil Masood | Najib Hasan"Runoff Prediction of Gharni River Catchment of Maharashtra by Regressional Analysis and Ann Tool Box" Published in International Journal of Trend in Scientific Research and Development (ijtsrd), ISSN: 2456-6470, Volume-2 | Issue-1 , December 2017, URL: http://www.ijtsrd.com/papers/ijtsrd7025.pdf http://www.ijtsrd.com/engineering/civil-engineering/7025/runoff-prediction-of-gharni-river-catchment-of-maharashtra-by-regressional-analysis-and-ann-tool-box/warish-khan
Ingrid is a web-based database and analytics platform that utilizes the latest in data manipulation technology to provide detailed operation indicators and benchmarks on fossil power generation.
Modeling Count-based Raster Data with ArcGIS and RAzavea
This presentation outlines the conceptual framework for building regression models of event counts where the unit of analysis is small. It explains how ArcGIS for Desktop can be used to build raster data sets that are modeled as generalized linear models within the open source R package.
Learn how to get started making Leaflet maps through R statistical software. Sounds crazy? Maybe. But the R package leafletR allows people familiar with R, but maybe not so much with HTML and Javascript coding, to make a basic Leaflet map (interactive, slipping web map) quickly with minimal knowledge of other programming languages.
Example code posted here: https://github.com/MicheleTobias/RCode
Why limit yourself to just one GIS program? It's good to have options. This workshop will introduce QGIS, a powerful free and open source GIS software, and teach basic skills in QGIS. In the first half of the session, we will work through the training materials available from QGIS.org and in the second half, we will divide into groups for learning new skills in more depth, such as web mapping, spatial databases, or plug-in development. A laptop computer is required for this session and we recommend you install QGIS 2.6 before hand.
Using R to Visualize Spatial Data: R as GIS - Guy LansleyGuy Lansley
This talk demonstrates some of the benefits of using R to visualize spatial data efficiently and clearly.
It was originally presented by Guy Lansley (UCL and the Consumer Data Research Centre) to the GIS for Social Data and Crisis Mapping Workshop at the University of Kent.
A brief (and most definitely incomplete) introduction to the world of open source GIS. Here I present some reasons open source options are useful and then give a brief introduction to the tools I use most: QGIS, PostGIS, and R. This talk was presented at the California Natural Resources Agency GIS Day on November 13, 2014.
Slide show for the webinar on "Spatial Data Science with R" organized for the GeoDevelopers.org community. The video of the webinar and all the related materials including source code and sample data can be downloaded from this link: http://amsantac.co/blog/en/2016/08/07/spatial-data-science-r.html
In this webinar I talked about Data Science in the context of its application to spatial data and explained how we can use the R language for the analysis of geographic information within the different stages of a data science workflow, from the import and processing of spatial data to visualization and publication of results.
This interdisciplinary tutorial was presented at the 2017 IEEE International Conference on Data Engineering in San Diego.
Reference:
Andreas Züfle, Goce Trajcevski, Dieter Pfoser, Matthew T. Rice, Matthias Renz, Timothy Leslie, Paul Delamater and Tobias Emrich. Handling Uncertainty in Geo-Spatial Data. 33rd International Conference on Data Engineering (ICDE). 2017.
The climate and earth sciences have recently undergone a rapid transformation from a data-poor
to a data-rich environment. In particular, massive amount of data about Earth and its
environment is now continuously being generated by a large number of Earth observing satellites
as well as physics-based earth system models running on large-scale computational platforms.
These massive and information-rich datasets offer huge potential for understanding how the
Earth's climate and ecosystem have been changing and how they are being impacted by humans’
actions. This talk will discuss various challenges involved in analyzing these massive data sets
as well as opportunities they present for both advancing machine learning as well as the science
of climate change in the context of monitoring the state of the tropical forests and surface water
on a global scale.
Presentation about geochemical research data access and publication provided to the Australian Geochemistry Network by Kerstin Lehnert of EarthChem and the Astromaterials Data System
Emerald Ash Borer Identification using DronesUAS Colorado
Presentation by Dan Staley of Arbor Drone and Loren Anderson of Spectrabotics for the Rocky Mountain UAS Professionals Meetup on Wednesday, August 16, 2017 at the Esri Broomfield office.
Estimating soil organic carbon changes: is it feasible?ExternalEvents
This presentation was presented during the Plenary 1, GSOC17 – Setting the scientific scene for GSOC17 of the Global Symposium on Soil Organic Carbon that took place in Rome 21-23 March 2017. The presentation was made by Ms. Eleanor Milne from Colorado State University - USA, in FAO Hq, Rome
QGIS Plugin Development is Not Scary: Lessons Learned from Literature MapperMichele Tobias
FOSS4G 2021 Buenos Aires
This is the story of how one QGIS plugin came to be and the lessons we learned along the way. The Literature Mapper QGIS Plugin was created to fill a need: academic journal articles are often about a specific location (this is common in fields such as ecology, archaeology, and history), but there was no method for connecting location data to a citation manager. We built the tool we needed from the idea stage (a paper map hand annotated in pencil), to prototype, to freely available code in the QGIS Plugin repository, to a tool that is steadily gaining users. In this talk, we will describe our experience developing the Literature Mapper QGIS plugin – all the ups and downs – to explain the process and encourage more people to try making their own plugin.
QGIS & the 240 Wine Regions: A Tale of Large Scale Collaborative DigitizingMichele Tobias
Once upon a time, researchers in need of spatial boundary data for the American Viticultural Areas (AVAs) paid high prices for data with little methods documentation. Researchers were sad and often avoided asking research questions that would require them to use this data. An intrepid team of librarians and data experts at the University of California Davis sought to make US wine region data freely available, embarking on a massive digitizing effort using US Federal records and maps, QGIS, geojson, and GitHub, to make polygons for more than 200 AVAs. Along their journey, they joined forces with University of California Santa Barbara and members of the mapping community battling software updates, long distance communications, and learning new software. For their efforts, they were richly rewarded with a well-documented open data set, a work flow that can (and has been!) applied to manage similar projects, and offers of more digitizing help from other universities! This talk will tell their story and explain how you can join them on the rest of their journey.
Project Home: https://github.com/UCDavisLibrary/ava
Learn to use Inkscape to create custom markers for QGIS. This method can be used for points, line markers, SVG fills, and north arrows. This talk was originally presented at FOSS4G 2018 in Boston, MA.
This presentation is a very beginning level introduction to GIS that was initially intended for a university employee audience. It focuses on what GIS data structure so that Librarians can identify when their patrons might want to explore GIS research options.
An introduction to Inkscape for both artists and scientists. These are the slides, but a big portion of this talk was live demo which can't be captured in the slides.
FOSS4G North America 2016
Sometimes your map needs a little extra polish. In this talk, I will outline my workflow for bringing maps from QGIS into Inkscape and exporting to commonly used formats to produces a finished professional-quality map. It will include "do's" and "don'ts" to help you develop your own workflow and avoid common pitfalls, as well as some features unique to Inkscape such as filters.
Drones have recently received a lot of media attention for their use as a surveillance tool. Their utility for video and still aerial photography is undeniable, but legislation threatens to restrict the use of drones even for scientific purposes. But kites are rarely subject to the same restrictions, even if they are used for similar purposes. Additionally, kites fly in windy conditions that would ground a drone and flight times are limited by arm muscle endurance, not by battery life. Processing the photos from either a drone or a kite, however, follows largely the same workflow. I will present a low-cost aerial photography platform that uses a kite to lift the sensors and discuss free and open source photo processing options including stitching and georeferencing.
Open Source Work-flow for Surface Interpolation with Curvilinear AnisotropyMichele Tobias
GitHub repository for the project: https://github.com/MicheleTobias/CurvilinearAnisotropy
Traditional approaches to interpolating a surface from point samples often assume that if anisotropy is present in the data, it is along a straight line. However, this assumption breaks down for many data-sets, such as river bathymetry, elevations near coastlines, or levels of pollutants along roads. I will present a work-flow using open source tools to make use of the curvilinear anisotropy present in many data-sets by transforming the curved data-set into a straight line (QGIS and PostGIS), applying an interpolation to the transformed data (with R... or use SAGA, GRASS, or other program with interpolation tools), and finally re-bending the interpolated surface back to the data's original shape (PostGIS).
Prevalence of Toxoplasma gondii infection in domestic animals in District Ban...Open Access Research Paper
Toxoplasma gondii is an intracellular zoonotic protozoan parasite, infect both humans and animals population worldwide. It can also cause abortion and inborn disease in humans and livestock population. In the present study total of 313 domestic animals were screened for Toxoplasma gondii infection. Of which 45 cows, 55 buffalos, 68 goats, 60 sheep and 85 shaver chicken were tested. Among these 40 (88.88%) cows were negative and 05 (11.12%) were positive. Similarly 55 (92.72%) buffalos were negative and 04 (07.28%) were positive. In goats 68 (98.52%) were negative and 01 (01.48%) was recorded positive. In sheep and shaver chicken the infection were not recorded.
Willie Nelson Net Worth: A Journey Through Music, Movies, and Business Venturesgreendigital
Willie Nelson is a name that resonates within the world of music and entertainment. Known for his unique voice, and masterful guitar skills. and an extraordinary career spanning several decades. Nelson has become a legend in the country music scene. But, his influence extends far beyond the realm of music. with ventures in acting, writing, activism, and business. This comprehensive article delves into Willie Nelson net worth. exploring the various facets of his career that have contributed to his large fortune.
Follow us on: Pinterest
Introduction
Willie Nelson net worth is a testament to his enduring influence and success in many fields. Born on April 29, 1933, in Abbott, Texas. Nelson's journey from a humble beginning to becoming one of the most iconic figures in American music is nothing short of inspirational. His net worth, which estimated to be around $25 million as of 2024. reflects a career that is as diverse as it is prolific.
Early Life and Musical Beginnings
Humble Origins
Willie Hugh Nelson was born during the Great Depression. a time of significant economic hardship in the United States. Raised by his grandparents. Nelson found solace and inspiration in music from an early age. His grandmother taught him to play the guitar. setting the stage for what would become an illustrious career.
First Steps in Music
Nelson's initial foray into the music industry was fraught with challenges. He moved to Nashville, Tennessee, to pursue his dreams, but success did not come . Working as a songwriter, Nelson penned hits for other artists. which helped him gain a foothold in the competitive music scene. His songwriting skills contributed to his early earnings. laying the foundation for his net worth.
Rise to Stardom
Breakthrough Albums
The 1970s marked a turning point in Willie Nelson's career. His albums "Shotgun Willie" (1973), "Red Headed Stranger" (1975). and "Stardust" (1978) received critical acclaim and commercial success. These albums not only solidified his position in the country music genre. but also introduced his music to a broader audience. The success of these albums played a crucial role in boosting Willie Nelson net worth.
Iconic Songs
Willie Nelson net worth is also attributed to his extensive catalog of hit songs. Tracks like "Blue Eyes Crying in the Rain," "On the Road Again," and "Always on My Mind" have become timeless classics. These songs have not only earned Nelson large royalties but have also ensured his continued relevance in the music industry.
Acting and Film Career
Hollywood Ventures
In addition to his music career, Willie Nelson has also made a mark in Hollywood. His distinctive personality and on-screen presence have landed him roles in several films and television shows. Notable appearances include roles in "The Electric Horseman" (1979), "Honeysuckle Rose" (1980), and "Barbarosa" (1982). These acting gigs have added a significant amount to Willie Nelson net worth.
Television Appearances
Nelson's char
"Understanding the Carbon Cycle: Processes, Human Impacts, and Strategies for...MMariSelvam4
The carbon cycle is a critical component of Earth's environmental system, governing the movement and transformation of carbon through various reservoirs, including the atmosphere, oceans, soil, and living organisms. This complex cycle involves several key processes such as photosynthesis, respiration, decomposition, and carbon sequestration, each contributing to the regulation of carbon levels on the planet.
Human activities, particularly fossil fuel combustion and deforestation, have significantly altered the natural carbon cycle, leading to increased atmospheric carbon dioxide concentrations and driving climate change. Understanding the intricacies of the carbon cycle is essential for assessing the impacts of these changes and developing effective mitigation strategies.
By studying the carbon cycle, scientists can identify carbon sources and sinks, measure carbon fluxes, and predict future trends. This knowledge is crucial for crafting policies aimed at reducing carbon emissions, enhancing carbon storage, and promoting sustainable practices. The carbon cycle's interplay with climate systems, ecosystems, and human activities underscores its importance in maintaining a stable and healthy planet.
In-depth exploration of the carbon cycle reveals the delicate balance required to sustain life and the urgent need to address anthropogenic influences. Through research, education, and policy, we can work towards restoring equilibrium in the carbon cycle and ensuring a sustainable future for generations to come.
Characterization and the Kinetics of drying at the drying oven and with micro...Open Access Research Paper
The objective of this work is to contribute to valorization de Nephelium lappaceum by the characterization of kinetics of drying of seeds of Nephelium lappaceum. The seeds were dehydrated until a constant mass respectively in a drying oven and a microwawe oven. The temperatures and the powers of drying are respectively: 50, 60 and 70°C and 140, 280 and 420 W. The results show that the curves of drying of seeds of Nephelium lappaceum do not present a phase of constant kinetics. The coefficients of diffusion vary between 2.09.10-8 to 2.98. 10-8m-2/s in the interval of 50°C at 70°C and between 4.83×10-07 at 9.04×10-07 m-8/s for the powers going of 140 W with 420 W the relation between Arrhenius and a value of energy of activation of 16.49 kJ. mol-1 expressed the effect of the temperature on effective diffusivity.
WRI’s brand new “Food Service Playbook for Promoting Sustainable Food Choices” gives food service operators the very latest strategies for creating dining environments that empower consumers to choose sustainable, plant-rich dishes. This research builds off our first guide for food service, now with industry experience and insights from nearly 350 academic trials.
UNDERSTANDING WHAT GREEN WASHING IS!.pdfJulietMogola
Many companies today use green washing to lure the public into thinking they are conserving the environment but in real sense they are doing more harm. There have been such several cases from very big companies here in Kenya and also globally. This ranges from various sectors from manufacturing and goes to consumer products. Educating people on greenwashing will enable people to make better choices based on their analysis and not on what they see on marketing sites.
Climate Change All over the World .pptxsairaanwer024
Climate change refers to significant and lasting changes in the average weather patterns over periods ranging from decades to millions of years. It encompasses both global warming driven by human emissions of greenhouse gases and the resulting large-scale shifts in weather patterns. While climate change is a natural phenomenon, human activities, particularly since the Industrial Revolution, have accelerated its pace and intensity