Download as ODP, PPTX
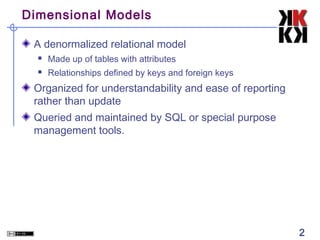
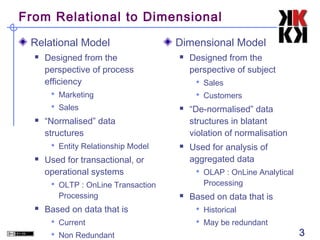
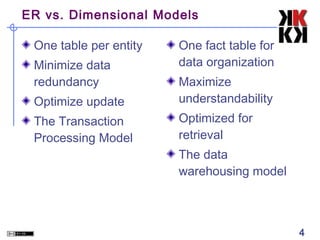
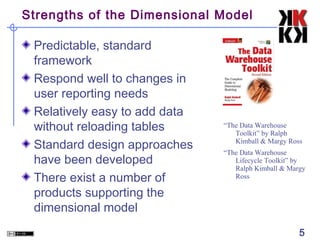
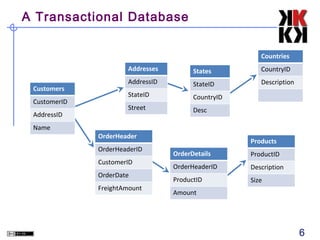
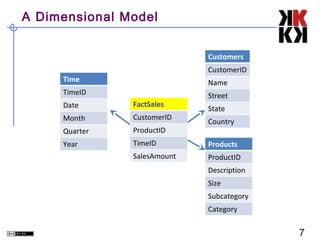
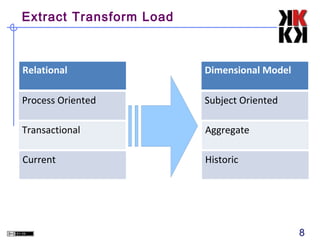
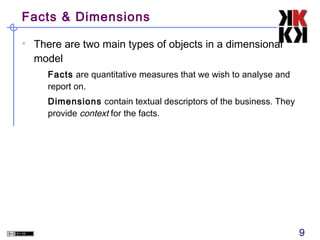
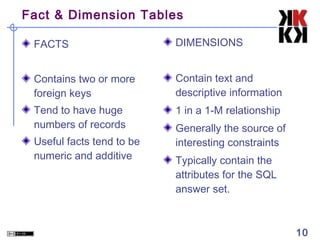
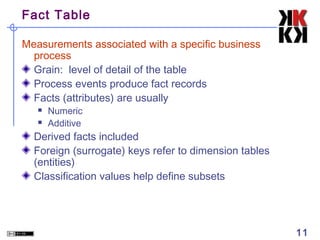
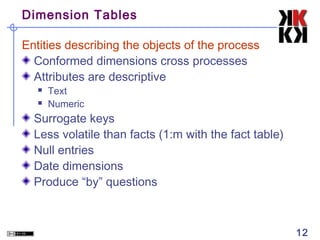
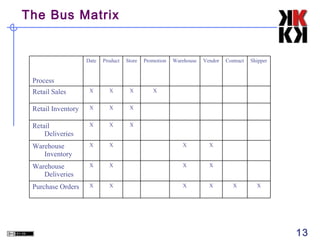
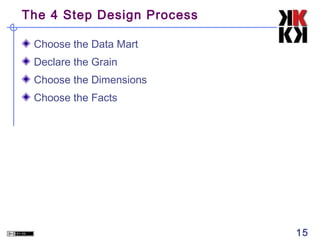
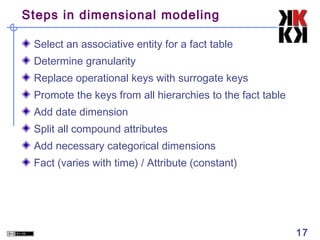
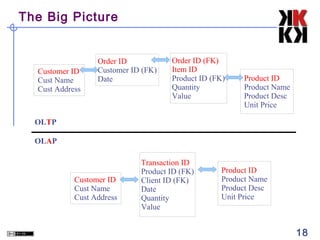
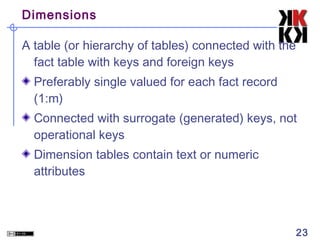
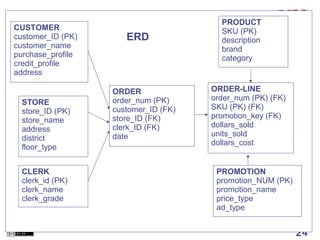
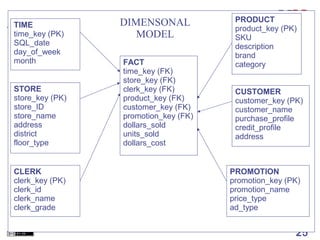
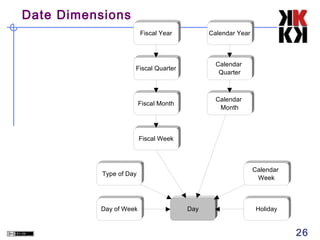
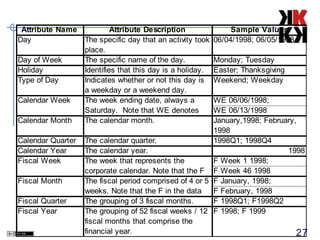
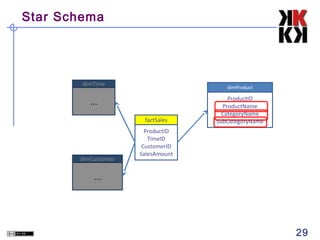
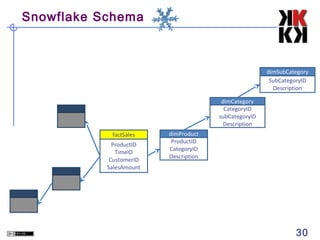

Business Information Systems covers dimensional analysis and dimensional models. Dimensional models organize data into fact and dimension tables for understandability and ease of reporting rather than update efficiency. Facts are measures associated with business processes, while dimensions provide context. Dimensional modeling involves selecting fact tables, determining granularity, adding surrogate keys, date dimensions, and other necessary dimensions. This provides a standardized framework that responds well to changing reporting needs.