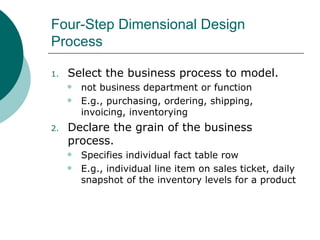
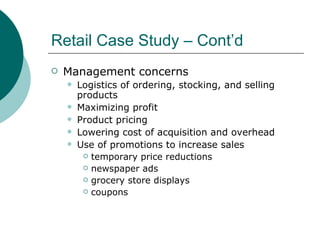
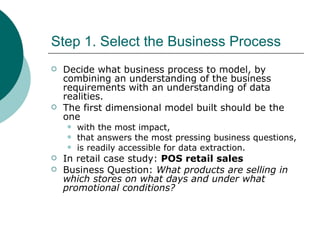
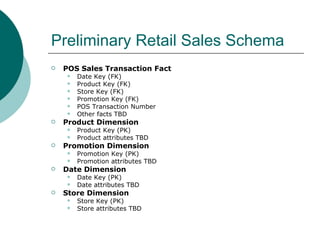
Retail Sales Kimball & Ross, Chapter 2
Overview Four-step dimensional design process Transaction-level fact tables Additive and non-additive facts Sample dimension table attributes Causal dimensions Degenerate dimensions Extending an existing dimension model Snowflaking dimension attributes Avoiding the “too many dimensions” trap Surrogate keys
Four-Step Dimensional Design Process  Select the business process to model. not business department or function  E.g., purchasing, ordering, shipping, invoicing, inventorying Declare the grain of the business process. Specifies individual fact table row E.g., individual line item on sales ticket, daily snapshot of the inventory levels for a product
Four-Step Dimensional Design Process Choose the dimensions that apply for each fact table row. Q:  How do business people describe the data that results from the business process? E.g., date, product, store, customer, transaction type Identify the numeric (measured) facts that will populate each fact table row. Q:  What are we measuring? Typical facts are numeric additive figures E.g., quantity ordered, dollar cost amount In making decisions regarding the 4 steps, consider both the user requirements as well as the realities of the source data
Retail Case Study Large grocery chain: 100 grocery stores over 5 regions Each store: Departments: grocery, frozen foods, dairy, meat, produce, bakery, floral, health/beauty aids, etc. 60,000 products (SKUs = stock keeping units) on shelves 55,000 SKUs with UPCs 5,000 SKUs without UPCs but with assigned SKU numbers Data is collected: from cash registers into a point-of-sale (POS) system  at back door where vendors make deliveries
Retail Case Study – Cont’d Management concerns Logistics of ordering, stocking, and selling products Maximizing profit Product pricing Lowering cost of acquisition and overhead Use of promotions to increase sales temporary price reductions newspaper ads grocery store displays coupons
Step 1. Select the Business Process Decide what business process to model, by combining an understanding of the business requirements with an understanding of data realities. The first dimensional model built should be the one  with the most impact,  that answers the most pressing business questions, is readily accessible for data extraction. In retail case study:  POS retail sales Business Question:  What products are selling in which stores on what days and under what promotional conditions?
Step 2. Declare the Grain What level of data detail should be made available in the dimensional model? Choose the most atomic information captured by the business process. Atomic data Most detailed, cannot be subdivided Facilitates ad hoc, unexpected usage and ability to drill down to details Case study grain:  individual line item on a POS transaction
Step 3. Choose the Dimensions A careful grain statement determines the primary dimensions. It is then usually possible to add additional dimensions. If an additional desired dimension violates the grain by causing additional fact rows to be generated, then the grain statement must be revised to accommodate this dimension. Case study dimensions: date, product, store, promotion
Preliminary Retail Sales Schema POS Sales Transaction Fact Date Key (FK) Product Key (FK) Store Key (FK) Promotion Key (FK) POS Transaction Number Other facts TBD Product Dimension Product Key (PK) Product attributes TBD Promotion Dimension Promotion Key (PK) Promotion attributes TBD Date Dimension Date Key (PK) Date attributes TBD Store Dimension Store Key (PK) Store attributes TBD
Step 4. Identify the Facts  Picking the business measurements for the fact table: true to the grain.  Case study - Facts collected by POS system: Sales quantity, sales price/unit, sales $ amount, standard cost $ amount Gross Profit = cost – sales Recommendation: Include in fact table even though it can be calculated.  Eliminates the possibility of user error. For non-additive measurements such as percentages and ratios (e.g., gross margin) store the numerator (gross profit) and denominator ($ revenue) in the fact table. The ratio can  be calculated in a data access tool for any slice of the fact table.  Caution : Calculate the ratio of the sums,  not  the sum of the ratios
Date Dimension Ubiquitous in every data mart  See Figure 2.4, p. 39 Use verbose, self-explanatory values rather than coded values.  They are used as column headers in reports.  By decoding in the database, we ensure consistency across different application environments.  E.g., Holiday Indicator – use values: Holiday, Nonholiday; as opposed to Y/N Date Key should be an integer rather than a date data type Data warehouses need an explicit date dimension table to describe fiscal periods, seasons, holidays, weekends, and other calendar calculations that are not supported by the SQL date function. If transaction time is of interest, we may need a separate Time Dimension table
Product Dimension Describes every SKU in the store Fill this dimension with as many descriptive attributes as possible. “ Robust dimension attributes deliver robust analytic slicing and dicing capabilities.” Hierarchies = groups of attributes Merchandise hierarchy SKUs roll up to brands to categories to departments. Each is a many-to-one relationship Although there will be redundancy, no need to normalize.  Given the relative size of the dimension (as compared to the fact table) space saving is minimal.
Store Dimension The store dimension: Store Key (PK), Store Name, Store Number (Natural Key), Store Address, … Possible to represent multiple hierarchies in a dimension table Store to any geographic attribute (e.g., ZIP, county, state) Store to store district to region
Promotion Dimension Describes the promotion conditions under which a product is sold Called a  “causal dimension”  – describes factors thought to cause a change in product sales (price reductions, ads, displays, coupons) Could keep all 4 causal mechanisms in a single dimension They are highly correlated, so not much difference in space requirements More efficient browsing for finding out how various promotions are used together …  or split into 4 separate dimensions May be more understandable to business Administration may be more straightforward To avoid null keys in the fact table (violation of referential integrity), for line items not being promoted include a row in the promotion dimension to indicate “No Promotion in Effect”
Factless Fact Table Q: Which products were under promotion but did not sell? Cannot answer yet. POS sales fact table has only products that were sold Answer:  Create Promotion Coverage Factless Fact Table Factless Fact Table = has no measurement metrics Contains date, product, store, and promotion keys Two-step process to answer Q: Query Promotion Coverage table: products under promotion on given date From POS Sales Fact table: products sold Answer is the set difference of above
Degenerate Dimension (DD) Dimension keys used in fact table without corresponding dimension tables In case study:  POS Transaction # Still useful for grouping by transaction Common DDs:  order numbers, invoice numbers Fact table primary key:  Product Key and POS Transaction Number
Retail Schema Extensibility Original schema extends gracefully because POS transaction data was modeled at its most granular level. Premature aggregation limits ability to extend if new dimensions do not apply to higher grain Case study new dimensions: Frequent Shopper Clerk Time of Day
Schema Extensibility Dimensional models can handle extensions without invalidating existing applications: New dimension attributes  – simply add columns to dimension table.  If new attribute is only available after point in time, populate old dimension records with something like “Not Available” New dimensions  – add foreign field keys to fact table New measured facts  – add to fact table.  If not at the same grain, then need separate fact table Dimension becoming more granular  – create new dimension.  May imply more granular fact table, in which case, may have to rebuild the fact table. Addition of a  completely new data source involving existing and new dimensions  – usually needs new fact table
Resisting Dimension Normalization Snowflaking  = Dimension table normalization Redundant attributes are removed from the denormalized dimension table and are placed in normalized secondary dimension tables Fully snowflaked schema = 3NF ER diagram The dimension tables must not be normalized, and should remain as flat tables. Numerous tables and joins usually translate into slower query performance. Efforts to normalize any of the tables in a dimensional database solely  in order to save disk space  are a waste of time. Disk space savings gained by normalizing the dimension tables are typically less than one percent of the total disk space needed for the overall schema. Normalized dimension tables destroy the ability to browse within a dimension or across dimensions (e.g., list package types for each brand in a category). SQL needed becomes too complex. The fact table is naturally normalized.
Too Many Dimensions Too many dimensions increase space requirements for the fact table. A very large number of dimensions typically means that several dimensions are not completely independent and should be combined. A single hierarchy should not be captured in separate dimensions.
Surrogate Keys Surrogate keys are integers assigned sequentially as needed to populate a dimension.  They serve to join dimension tables to the fact table. Avoid embedding intelligence in the data warehouse keys. Benefits: Surrogate keys buffer the DW environment from operational changes.  What happens when operations decide to recycle account numbers after some period of inactivity?  Fine for operational systems, but problematic for DW if it is using account numbers as a PK. Can more easily integrate data from multiple operational systems, even if they lack consistent source keys. Performance advantages because small size of surrogate keys leads to smaller fact tables Surrogate keys are used to support one of the primary techniques for handling changes in dimension table attributes (Chapter 4).
Acknowledgements Ralph Kimball & Margy Ross

Modelado Dimensional 4 Etapas

  • 1.
    Retail Sales Kimball& Ross, Chapter 2
  • 2.
    Overview Four-step dimensionaldesign process Transaction-level fact tables Additive and non-additive facts Sample dimension table attributes Causal dimensions Degenerate dimensions Extending an existing dimension model Snowflaking dimension attributes Avoiding the “too many dimensions” trap Surrogate keys
  • 3.
    Four-Step Dimensional DesignProcess Select the business process to model. not business department or function E.g., purchasing, ordering, shipping, invoicing, inventorying Declare the grain of the business process. Specifies individual fact table row E.g., individual line item on sales ticket, daily snapshot of the inventory levels for a product
  • 4.
    Four-Step Dimensional DesignProcess Choose the dimensions that apply for each fact table row. Q: How do business people describe the data that results from the business process? E.g., date, product, store, customer, transaction type Identify the numeric (measured) facts that will populate each fact table row. Q: What are we measuring? Typical facts are numeric additive figures E.g., quantity ordered, dollar cost amount In making decisions regarding the 4 steps, consider both the user requirements as well as the realities of the source data
  • 5.
    Retail Case StudyLarge grocery chain: 100 grocery stores over 5 regions Each store: Departments: grocery, frozen foods, dairy, meat, produce, bakery, floral, health/beauty aids, etc. 60,000 products (SKUs = stock keeping units) on shelves 55,000 SKUs with UPCs 5,000 SKUs without UPCs but with assigned SKU numbers Data is collected: from cash registers into a point-of-sale (POS) system at back door where vendors make deliveries
  • 6.
    Retail Case Study– Cont’d Management concerns Logistics of ordering, stocking, and selling products Maximizing profit Product pricing Lowering cost of acquisition and overhead Use of promotions to increase sales temporary price reductions newspaper ads grocery store displays coupons
  • 7.
    Step 1. Selectthe Business Process Decide what business process to model, by combining an understanding of the business requirements with an understanding of data realities. The first dimensional model built should be the one with the most impact, that answers the most pressing business questions, is readily accessible for data extraction. In retail case study: POS retail sales Business Question: What products are selling in which stores on what days and under what promotional conditions?
  • 8.
    Step 2. Declarethe Grain What level of data detail should be made available in the dimensional model? Choose the most atomic information captured by the business process. Atomic data Most detailed, cannot be subdivided Facilitates ad hoc, unexpected usage and ability to drill down to details Case study grain: individual line item on a POS transaction
  • 9.
    Step 3. Choosethe Dimensions A careful grain statement determines the primary dimensions. It is then usually possible to add additional dimensions. If an additional desired dimension violates the grain by causing additional fact rows to be generated, then the grain statement must be revised to accommodate this dimension. Case study dimensions: date, product, store, promotion
  • 10.
    Preliminary Retail SalesSchema POS Sales Transaction Fact Date Key (FK) Product Key (FK) Store Key (FK) Promotion Key (FK) POS Transaction Number Other facts TBD Product Dimension Product Key (PK) Product attributes TBD Promotion Dimension Promotion Key (PK) Promotion attributes TBD Date Dimension Date Key (PK) Date attributes TBD Store Dimension Store Key (PK) Store attributes TBD
  • 11.
    Step 4. Identifythe Facts Picking the business measurements for the fact table: true to the grain. Case study - Facts collected by POS system: Sales quantity, sales price/unit, sales $ amount, standard cost $ amount Gross Profit = cost – sales Recommendation: Include in fact table even though it can be calculated. Eliminates the possibility of user error. For non-additive measurements such as percentages and ratios (e.g., gross margin) store the numerator (gross profit) and denominator ($ revenue) in the fact table. The ratio can be calculated in a data access tool for any slice of the fact table. Caution : Calculate the ratio of the sums, not the sum of the ratios
  • 12.
    Date Dimension Ubiquitousin every data mart See Figure 2.4, p. 39 Use verbose, self-explanatory values rather than coded values. They are used as column headers in reports. By decoding in the database, we ensure consistency across different application environments. E.g., Holiday Indicator – use values: Holiday, Nonholiday; as opposed to Y/N Date Key should be an integer rather than a date data type Data warehouses need an explicit date dimension table to describe fiscal periods, seasons, holidays, weekends, and other calendar calculations that are not supported by the SQL date function. If transaction time is of interest, we may need a separate Time Dimension table
  • 13.
    Product Dimension Describesevery SKU in the store Fill this dimension with as many descriptive attributes as possible. “ Robust dimension attributes deliver robust analytic slicing and dicing capabilities.” Hierarchies = groups of attributes Merchandise hierarchy SKUs roll up to brands to categories to departments. Each is a many-to-one relationship Although there will be redundancy, no need to normalize. Given the relative size of the dimension (as compared to the fact table) space saving is minimal.
  • 14.
    Store Dimension Thestore dimension: Store Key (PK), Store Name, Store Number (Natural Key), Store Address, … Possible to represent multiple hierarchies in a dimension table Store to any geographic attribute (e.g., ZIP, county, state) Store to store district to region
  • 15.
    Promotion Dimension Describesthe promotion conditions under which a product is sold Called a “causal dimension” – describes factors thought to cause a change in product sales (price reductions, ads, displays, coupons) Could keep all 4 causal mechanisms in a single dimension They are highly correlated, so not much difference in space requirements More efficient browsing for finding out how various promotions are used together … or split into 4 separate dimensions May be more understandable to business Administration may be more straightforward To avoid null keys in the fact table (violation of referential integrity), for line items not being promoted include a row in the promotion dimension to indicate “No Promotion in Effect”
  • 16.
    Factless Fact TableQ: Which products were under promotion but did not sell? Cannot answer yet. POS sales fact table has only products that were sold Answer: Create Promotion Coverage Factless Fact Table Factless Fact Table = has no measurement metrics Contains date, product, store, and promotion keys Two-step process to answer Q: Query Promotion Coverage table: products under promotion on given date From POS Sales Fact table: products sold Answer is the set difference of above
  • 17.
    Degenerate Dimension (DD)Dimension keys used in fact table without corresponding dimension tables In case study: POS Transaction # Still useful for grouping by transaction Common DDs: order numbers, invoice numbers Fact table primary key: Product Key and POS Transaction Number
  • 18.
    Retail Schema ExtensibilityOriginal schema extends gracefully because POS transaction data was modeled at its most granular level. Premature aggregation limits ability to extend if new dimensions do not apply to higher grain Case study new dimensions: Frequent Shopper Clerk Time of Day
  • 19.
    Schema Extensibility Dimensionalmodels can handle extensions without invalidating existing applications: New dimension attributes – simply add columns to dimension table. If new attribute is only available after point in time, populate old dimension records with something like “Not Available” New dimensions – add foreign field keys to fact table New measured facts – add to fact table. If not at the same grain, then need separate fact table Dimension becoming more granular – create new dimension. May imply more granular fact table, in which case, may have to rebuild the fact table. Addition of a completely new data source involving existing and new dimensions – usually needs new fact table
  • 20.
    Resisting Dimension NormalizationSnowflaking = Dimension table normalization Redundant attributes are removed from the denormalized dimension table and are placed in normalized secondary dimension tables Fully snowflaked schema = 3NF ER diagram The dimension tables must not be normalized, and should remain as flat tables. Numerous tables and joins usually translate into slower query performance. Efforts to normalize any of the tables in a dimensional database solely in order to save disk space are a waste of time. Disk space savings gained by normalizing the dimension tables are typically less than one percent of the total disk space needed for the overall schema. Normalized dimension tables destroy the ability to browse within a dimension or across dimensions (e.g., list package types for each brand in a category). SQL needed becomes too complex. The fact table is naturally normalized.
  • 21.
    Too Many DimensionsToo many dimensions increase space requirements for the fact table. A very large number of dimensions typically means that several dimensions are not completely independent and should be combined. A single hierarchy should not be captured in separate dimensions.
  • 22.
    Surrogate Keys Surrogatekeys are integers assigned sequentially as needed to populate a dimension. They serve to join dimension tables to the fact table. Avoid embedding intelligence in the data warehouse keys. Benefits: Surrogate keys buffer the DW environment from operational changes. What happens when operations decide to recycle account numbers after some period of inactivity? Fine for operational systems, but problematic for DW if it is using account numbers as a PK. Can more easily integrate data from multiple operational systems, even if they lack consistent source keys. Performance advantages because small size of surrogate keys leads to smaller fact tables Surrogate keys are used to support one of the primary techniques for handling changes in dimension table attributes (Chapter 4).
  • 23.