The document discusses decision support, data warehousing, and online analytical processing (OLAP). It outlines the evolution of decision support from batch reporting in the 1960s to modern data warehousing with OLAP engines. Key aspects covered include the differences between OLTP and OLAP systems, data warehouse architecture including star schemas, and approaches to OLAP including relational and multidimensional servers.
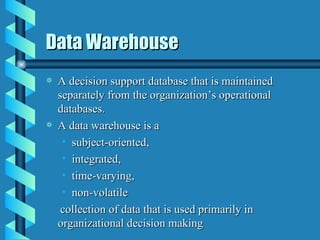
![Decision Support, Data Warehousing, and OLAP Anindya Datta Director, iXL Center for E-Commerce Georgia Institute of Technology [email_address]](https://image.slidesharecdn.com/datawarehouse-110824002816-phpapp01/85/Data-Warehouse-1-320.jpg)
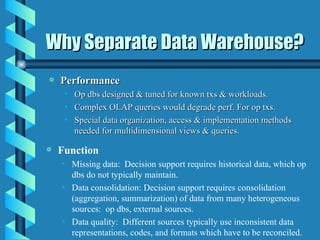
![Decision Support, Data Warehousing, and OLAP Anindya Datta Director, iXL Center for E-Commerce Georgia Institute of Technology [email_address]](https://image.slidesharecdn.com/datawarehouse-110824002816-phpapp01/75/Data-Warehouse-1-2048.jpg)
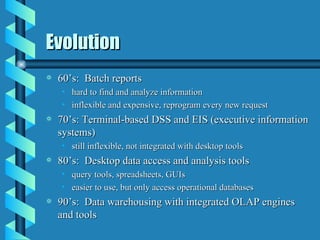
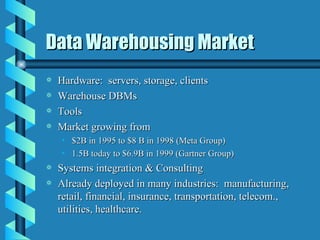
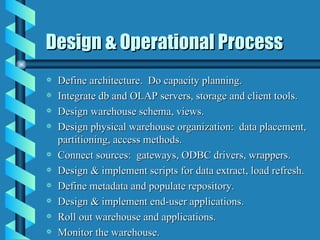
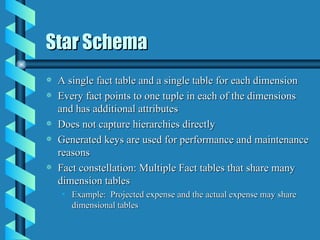
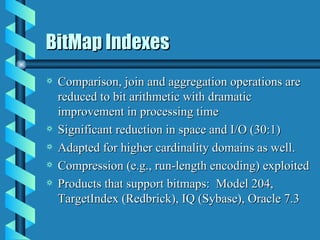
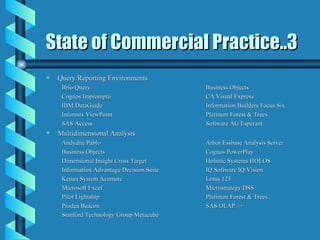
![State of Commercial Practice Products and Vendors [Datamation, May 15, 1996; R.C. Barquin, H.A. Edelstein: Planning and Designin gthe Data Warehous. Prentice Hall. 1997] Connectivity to sources Apertus CA-Ingres Gateway Information Builders EDA/SQL IBM Data Jioner Informix Enterprise Gateway Microsoft ODBC Oracle Open Connect Platinum Infohub SAS Connect Software AG Entire Sybase Enterprise Connect Trinzic InfoHub Data extract, clean, transfomr, refresh CA-Ingres Replicator Carleton Passport Evolutionary Tech Inc. ETI-Extract Harte-Hanks Trillium IBM Data Joiner, Data Propagator Oracle 7 Platinum InfoRefiner, InfroPump Praxis OmniReplicator Prism Warehouse Manager Redbrick TMU SAS Access Software AG Souorcepoint Sybase Replication Server Trinzic InfoPump](https://image.slidesharecdn.com/datawarehouse-110824002816-phpapp01/85/Data-Warehouse-43-320.jpg)


![Getting Started with Apache Spark: Big Data Made Simple [Free Meetup]](https://cdn.slidesharecdn.com/ss_thumbnails/apachesparkgettingstarted-260203175547-8361bcc3-thumbnail.jpg?width=640&height=640&fit=bounds)


