Downloaded 955 times


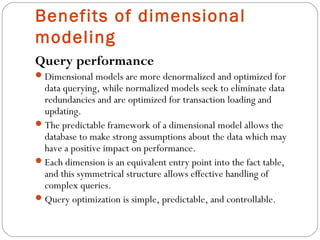
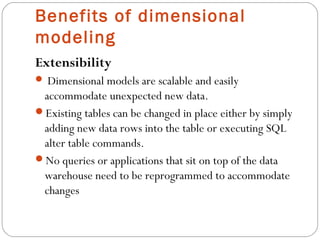
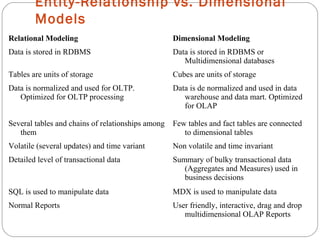
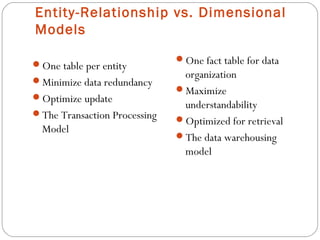
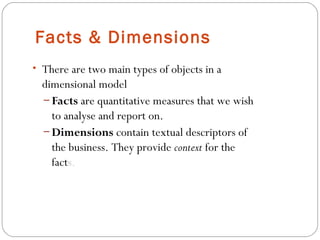
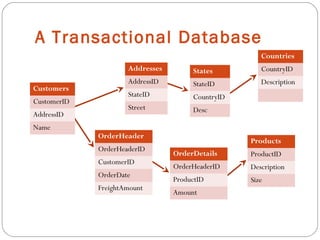
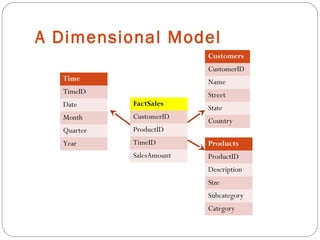
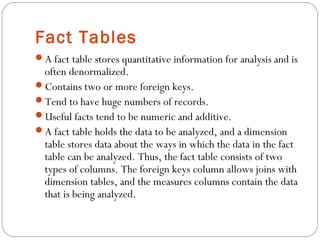
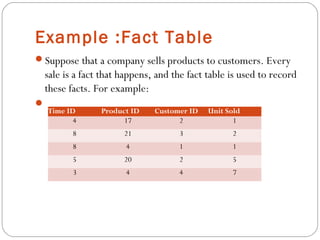

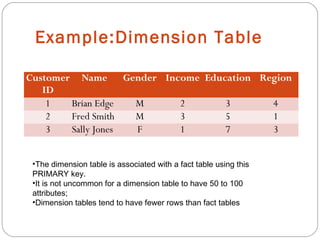
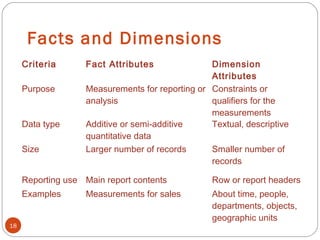
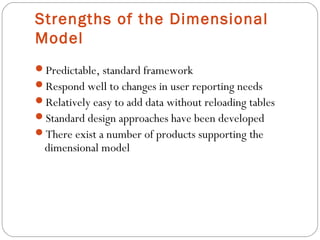
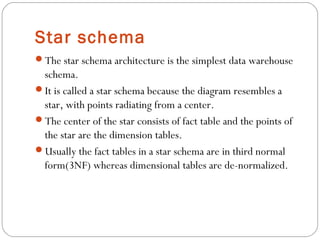
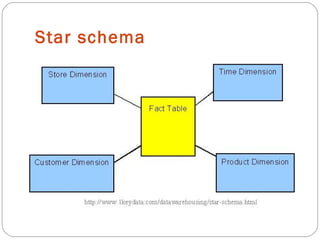
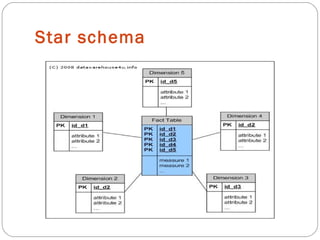
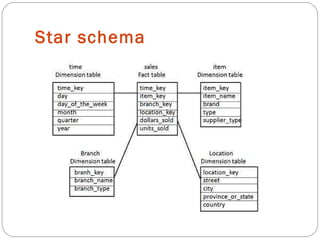
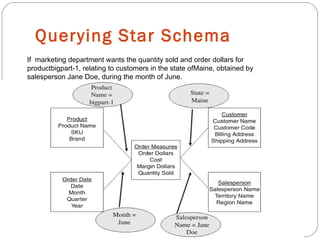
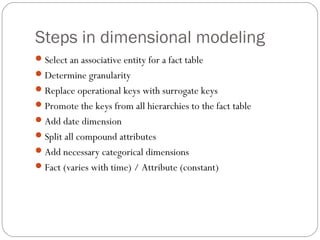
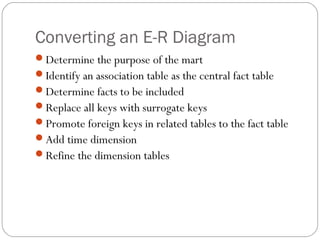
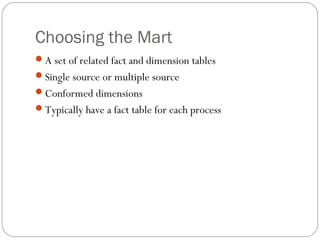
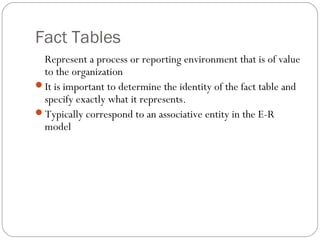
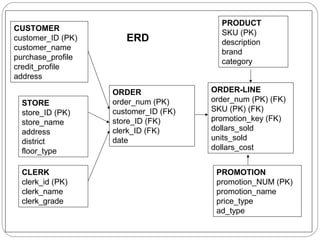
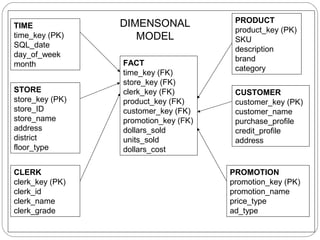
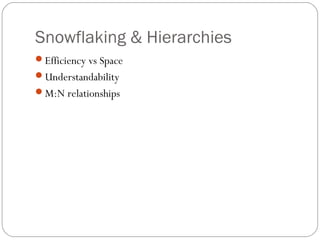
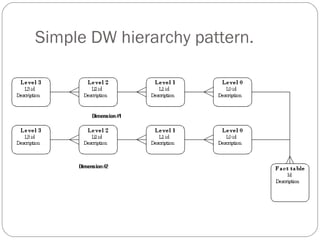
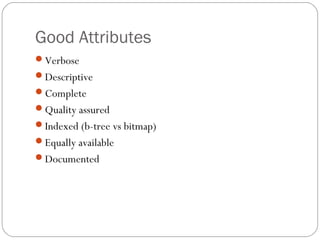
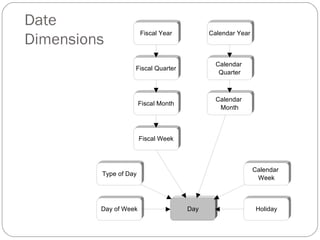
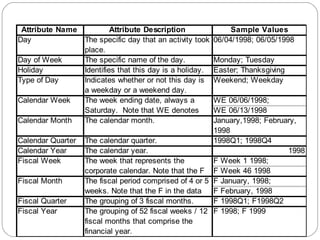
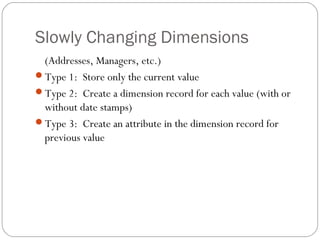
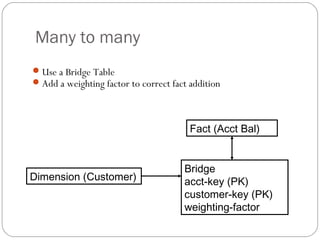

The document discusses dimensional modeling concepts used in data warehouse design. Dimensional modeling organizes data into facts and dimensions. Facts are measures that are analyzed, while dimensions provide context for the facts. The dimensional model uses star and snowflake schemas to store data in denormalized tables optimized for querying. Key aspects covered include fact and dimension tables, slowly changing dimensions, and handling many-to-many and recursive relationships.