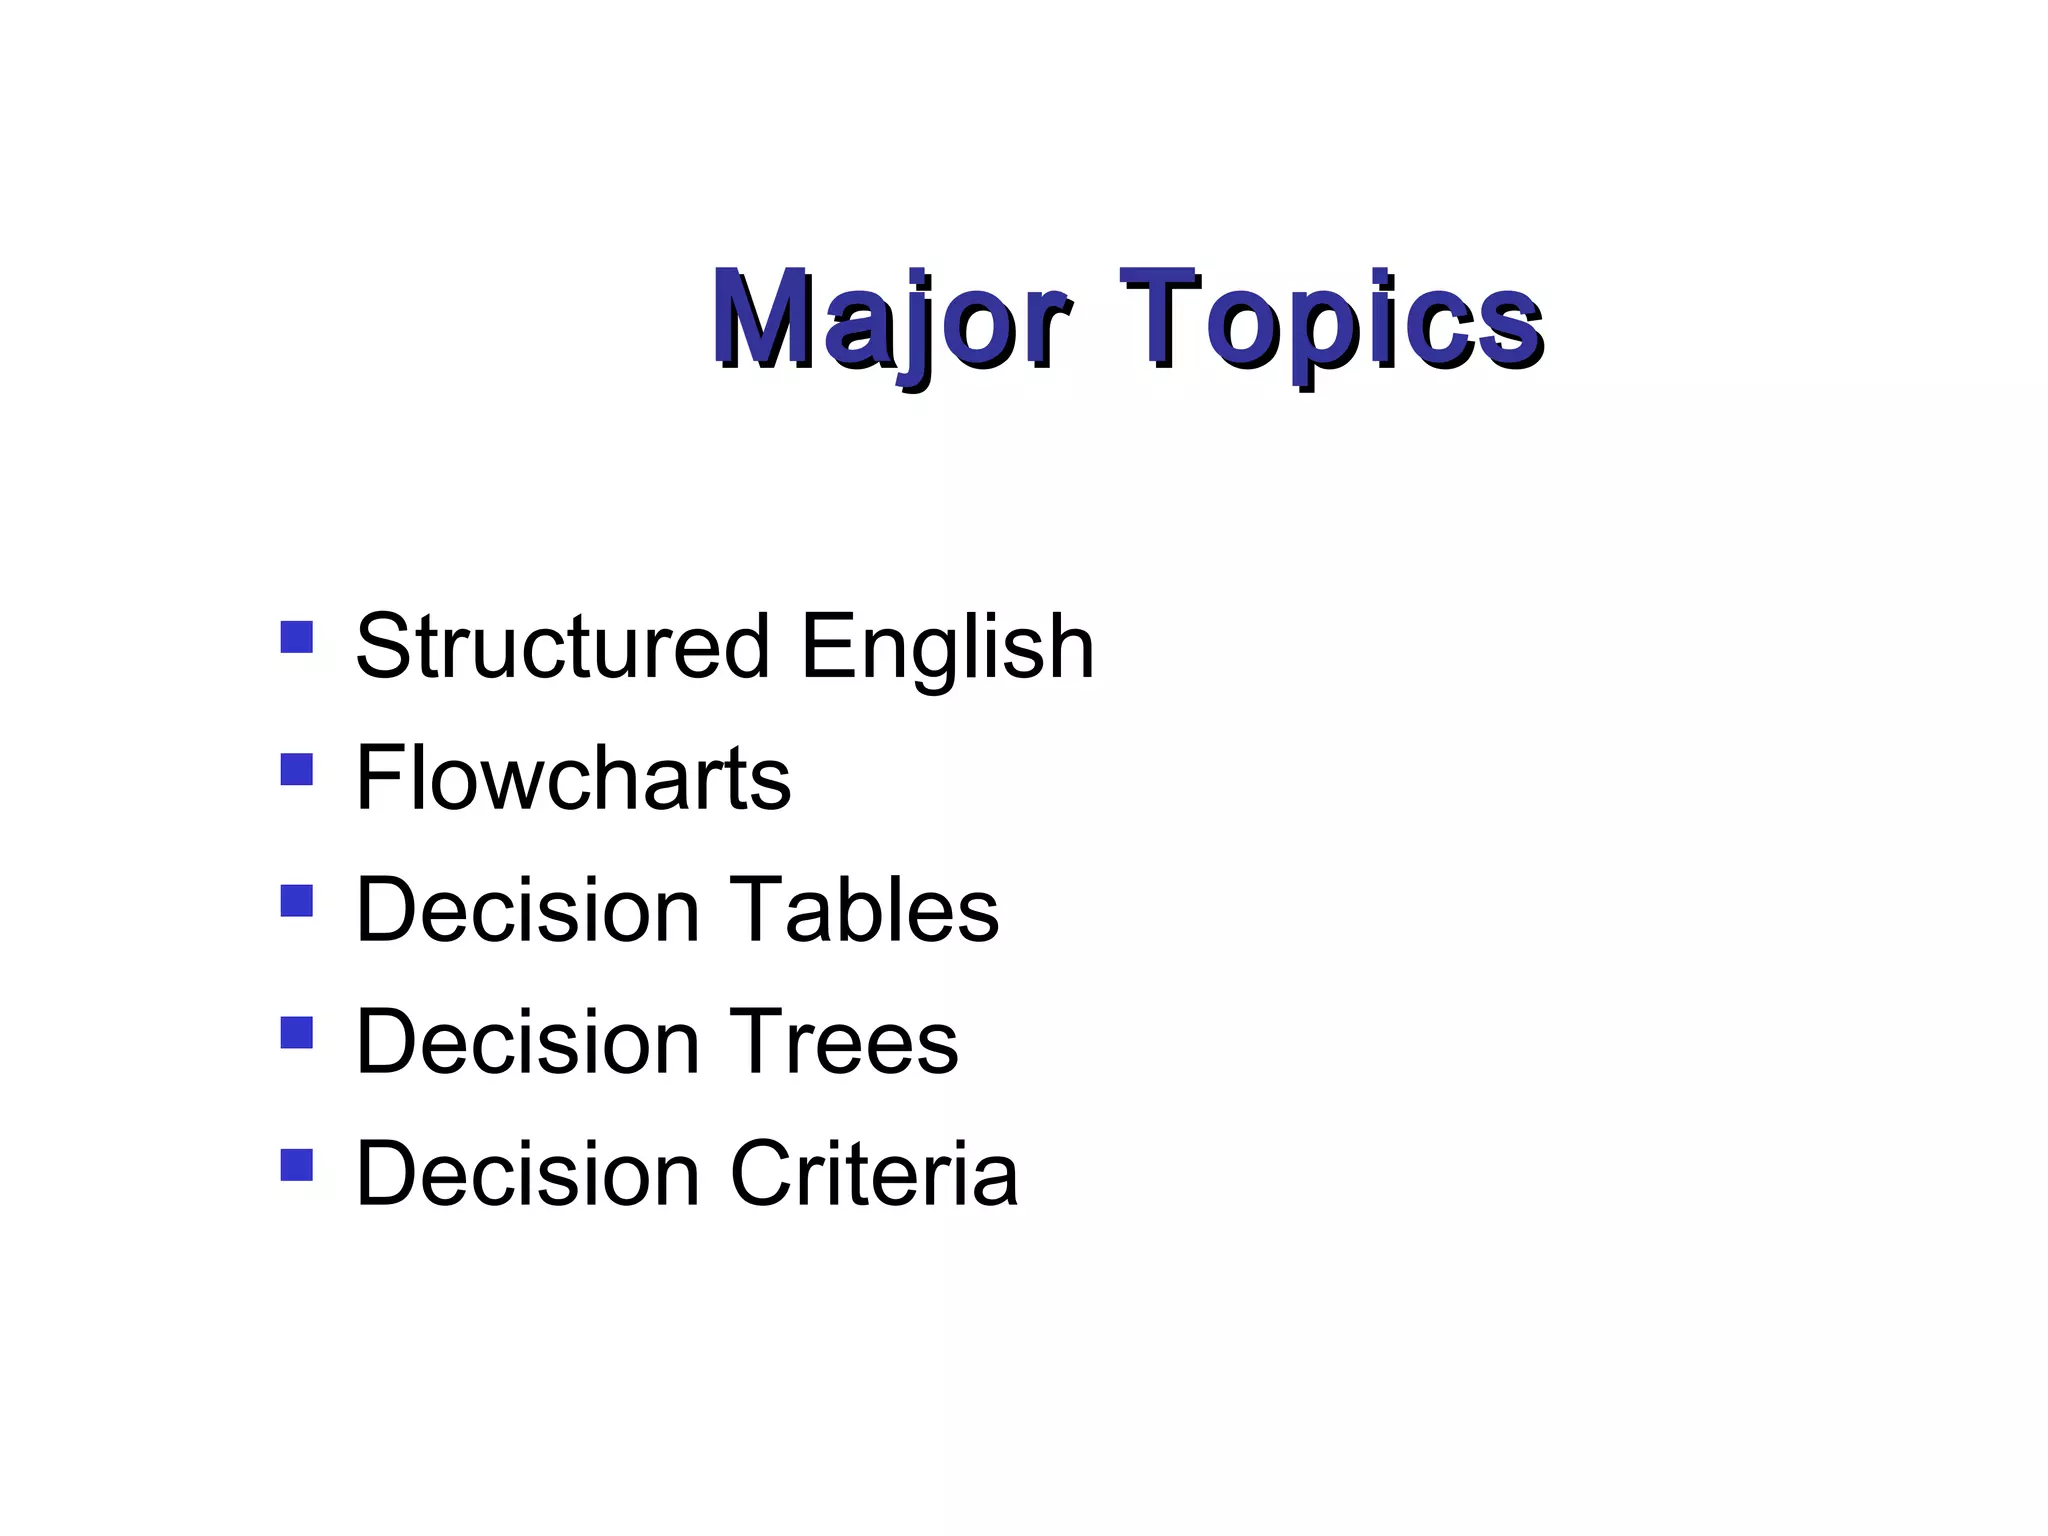
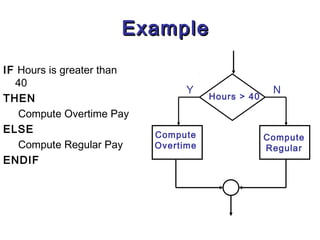
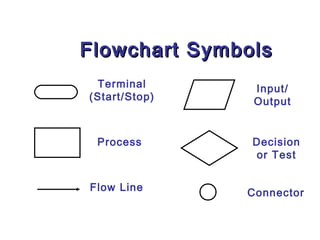
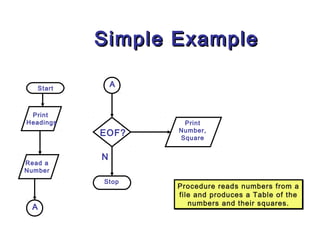
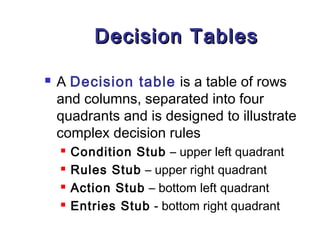
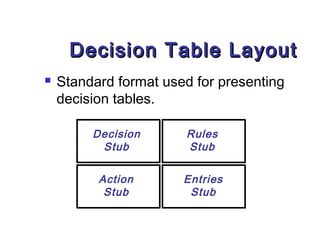
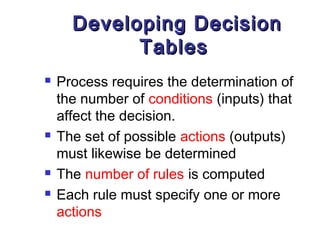
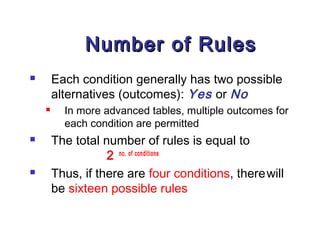
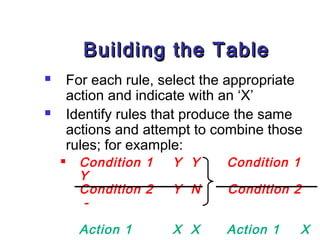
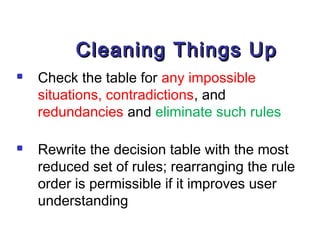
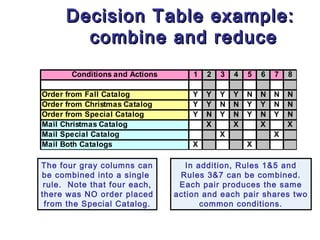
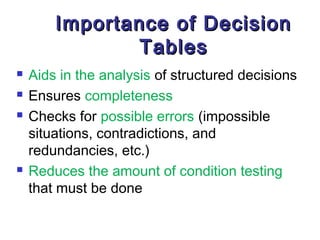
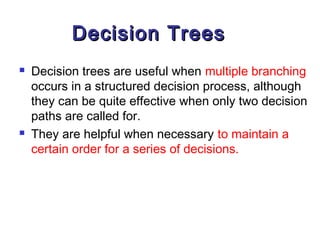
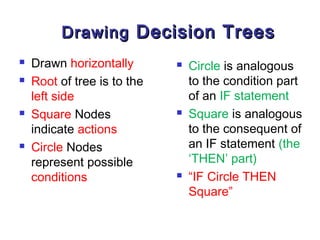
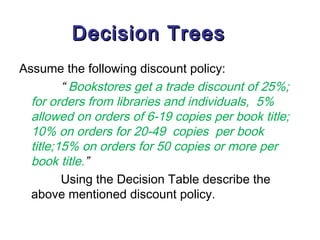
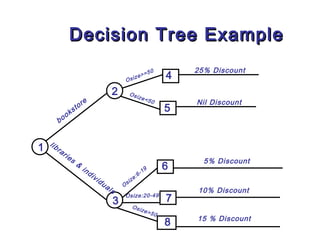
This document discusses various techniques for structuring decisions: structured English, flowcharts, decision tables, and decision trees. It provides examples and explanations of each technique. Structured English uses an IF/THEN statement format. Flowcharts show the sequence of steps using standard symbols. Decision tables illustrate decision rules in a table format. Decision trees use a branching diagram to represent multiple conditional decisions. The document emphasizes that these techniques help ensure decisions are complete, avoid errors, and reduce necessary condition testing.
Query processing and Query OptimizationNiraj Gandha
This presentation on query processing and query optimization is made with many efforts. According to me, I have used the most basic/ fundamental examples and topics for the explanation.
Query processing and Query OptimizationNiraj Gandha
This presentation on query processing and query optimization is made with many efforts. According to me, I have used the most basic/ fundamental examples and topics for the explanation.
Software Engineering- ERD DFD Decision Tree and TableNishu Rastogi
Second half of Unit 2 of BCA 401 as per Invertis University, Syllabus
It includes introduction to ERD, DFD, Decision Tree and Table with examples and exercise.
Software Engineering- ERD DFD Decision Tree and TableNishu Rastogi
Second half of Unit 2 of BCA 401 as per Invertis University, Syllabus
It includes introduction to ERD, DFD, Decision Tree and Table with examples and exercise.
discuss about System system analysis, system design, system analyst's role, Development of System through analysis, SDLC, Case Tools of SAD, Implementation, etc.
Data Base Design & Normalization: Functional dependencies, normal forms, first, second, 8 third
normal forms, BCNF, inclusion dependence, loss less join decompositions, normalization using
FD, MVD, and JDs, alternative approaches to database design
1. Major Topics
Structured English
Flowcharts
Decision Tables
Decision Trees
Decision Criteria
2. Structured English
Structured English is a technique
used to describe algorithmic procedures
and is sometimes considered an
alternative to flowcharts.
3. Example
IF Hours is greater than
40
Y N
THEN Hours > 40
Compute Overtime Pay
ELSE Compute Compute
Compute Regular Pay Overtime Regular
ENDIF
4. What are Flowcharts?
They describe a procedure or program by
specifying the sequence diagrammatically in
which individual steps must be executed.
An ideal means for documenting complex
algorithms so that users can refer to them as
procedural guides.
6. Simple Example
Start
A
Print
Headings Print
Number,
EOF? Square
N
Read a
Number
Stop
Procedure reads numbers from a
file and produces a Table of the
numbers and their squares.
A
7. Decision Tables
A Decision table is a table of rows
and columns, separated into four
quadrants and is designed to illustrate
complex decision rules
Condition Stub – upper left quadrant
Rules Stub – upper right quadrant
Action Stub – bottom left quadrant
Entries Stub - bottom right quadrant
8. Decision Table Layout
Standard format used for presenting
decision tables.
Decision Rules
Stub Stub
Action Entries
Stub Stub
9. Decision Table Example
1 2 3 4
Like Boss? Y Y N N
20% Pay Raise? Y N Y N
Stay Another Year X X
Quit after 2 Months X
Quit next Week X
10. Developing Decision
Tables
Process requires the determination of
the number of conditions (inputs) that
affect the decision.
The set of possible actions (outputs)
must likewise be determined
The number of rules is computed
Each rule must specify one or more
actions
11. Number of Rules
Each condition generally has two possible
alternatives (outcomes): Yes or No
In more advanced tables, multiple outcomes for
each condition are permitted
The total number of rules is equal to
2 no. of conditions
Thus, if there are four conditions, there will
be sixteen possible rules
12. Building the Table
For each rule, select the appropriate
action and indicate with an ‘X’
Identify rules that produce the same
actions and attempt to combine those
rules; for example:
Condition 1 Y Y Condition 1
Y
Condition 2 Y N Condition 2
-
Action 1 X X Action 1 X
13. Cleaning Things Up
Check the table for any impossible
situations, contradictions, and
redundancies and eliminate such rules
Rewrite the decision table with the most
reduced set of rules; rearranging the rule
order is permissible if it improves user
understanding
14. Decision Table example:
combine and reduce
Conditions and Actions 1 2 3 4 5 6 7 8
Order from Fall Catalog Y Y Y Y N N N N
Order from Christmas Catalog Y Y N N Y Y N N
Order from Special Catalog Y N Y N Y N Y N
Mail Christmas Catalog X X X X
Mail Special Catalog X X
Mail Both Catalogs X X
The four gray columns can In addition, Rules 1&5 and
be combined into a single Rules 3&7 can be combined.
rule. Note that four each, Each pair produces the same
there was NO order placed action and each pair shares two
from the Special Catalog. common conditions.
15. Decision Table example ~
Final Version
Conditions and Actions 1 2 3
Order from Fall Catalog -- -- --
Order from Christmas Catalog Y -- N
Order from Special Catalog Y N Y
Mail Christmas Catalog X
Mail Special Catalog X
Mail Both Catalogs X
Eliminates the need to check for every possible case.
16. Decision Table example:
checking for completeness and
accuracy
Conditions and Actions 1 2 3 4
Salary > $50,000 per year Y Y N N
Salary < $2,000 per month Y N Y N
Award Double Bonus X
Award Regular Bonus X
Award no Bonus X
Although the Y-N Combinations suggest a rule, in this
case, it is impossible for conditions 1 & 2 to exist
simultaneously. They are in complete contradiction
with each other. In the final version of the table,
Rule 1 will disappear and Rules -4 will become Rules
1-3.
17. Importance of Decision
Tables
Aids in the analysis of structured decisions
Ensures completeness
Checks for possible errors (impossible
situations, contradictions, and
redundancies, etc.)
Reduces the amount of condition testing
that must be done
18. Decision Trees
Decision trees are useful when multiple branching
occurs in a structured decision process, although
they can be quite effective when only two decision
paths are called for.
They are helpful when necessary to maintain a
certain order for a series of decisions.
19. Drawing Decision Trees
Drawn horizontally Circle is analogous
Root of tree is to the to the condition part
left side of an IF statement
Square Nodes Square is analogous
indicate actions to the consequent of
Circle Nodes an IF statement (the
represent possible ‘THEN’ part)
conditions “IF Circle THEN
Square”
20. Decision Trees
Assume the following discount policy:
“ Bookstores get a trade discount of 25%;
for orders from libraries and individuals, 5%
allowed on orders of 6-19 copies per book title;
10% on orders for 20-49 copies per book
title;15% on orders for 50 copies or more per
book title.”
Using the Decision Table describe the
above mentioned discount policy.
21. Decision Tree Example
50 25% Discount
O size
>= 4
2 Osi
ze<
re 50 Nil Discount
s to 5
ok
bo
1
lib
ra
ri
5% Discount
6
es
9
&
1
6-
in
:
ze
di
si
vi
O
du
10% Discount
al
Osize:2 0-49
7
s
3 Osi
ze>
50
15 % Discount
8