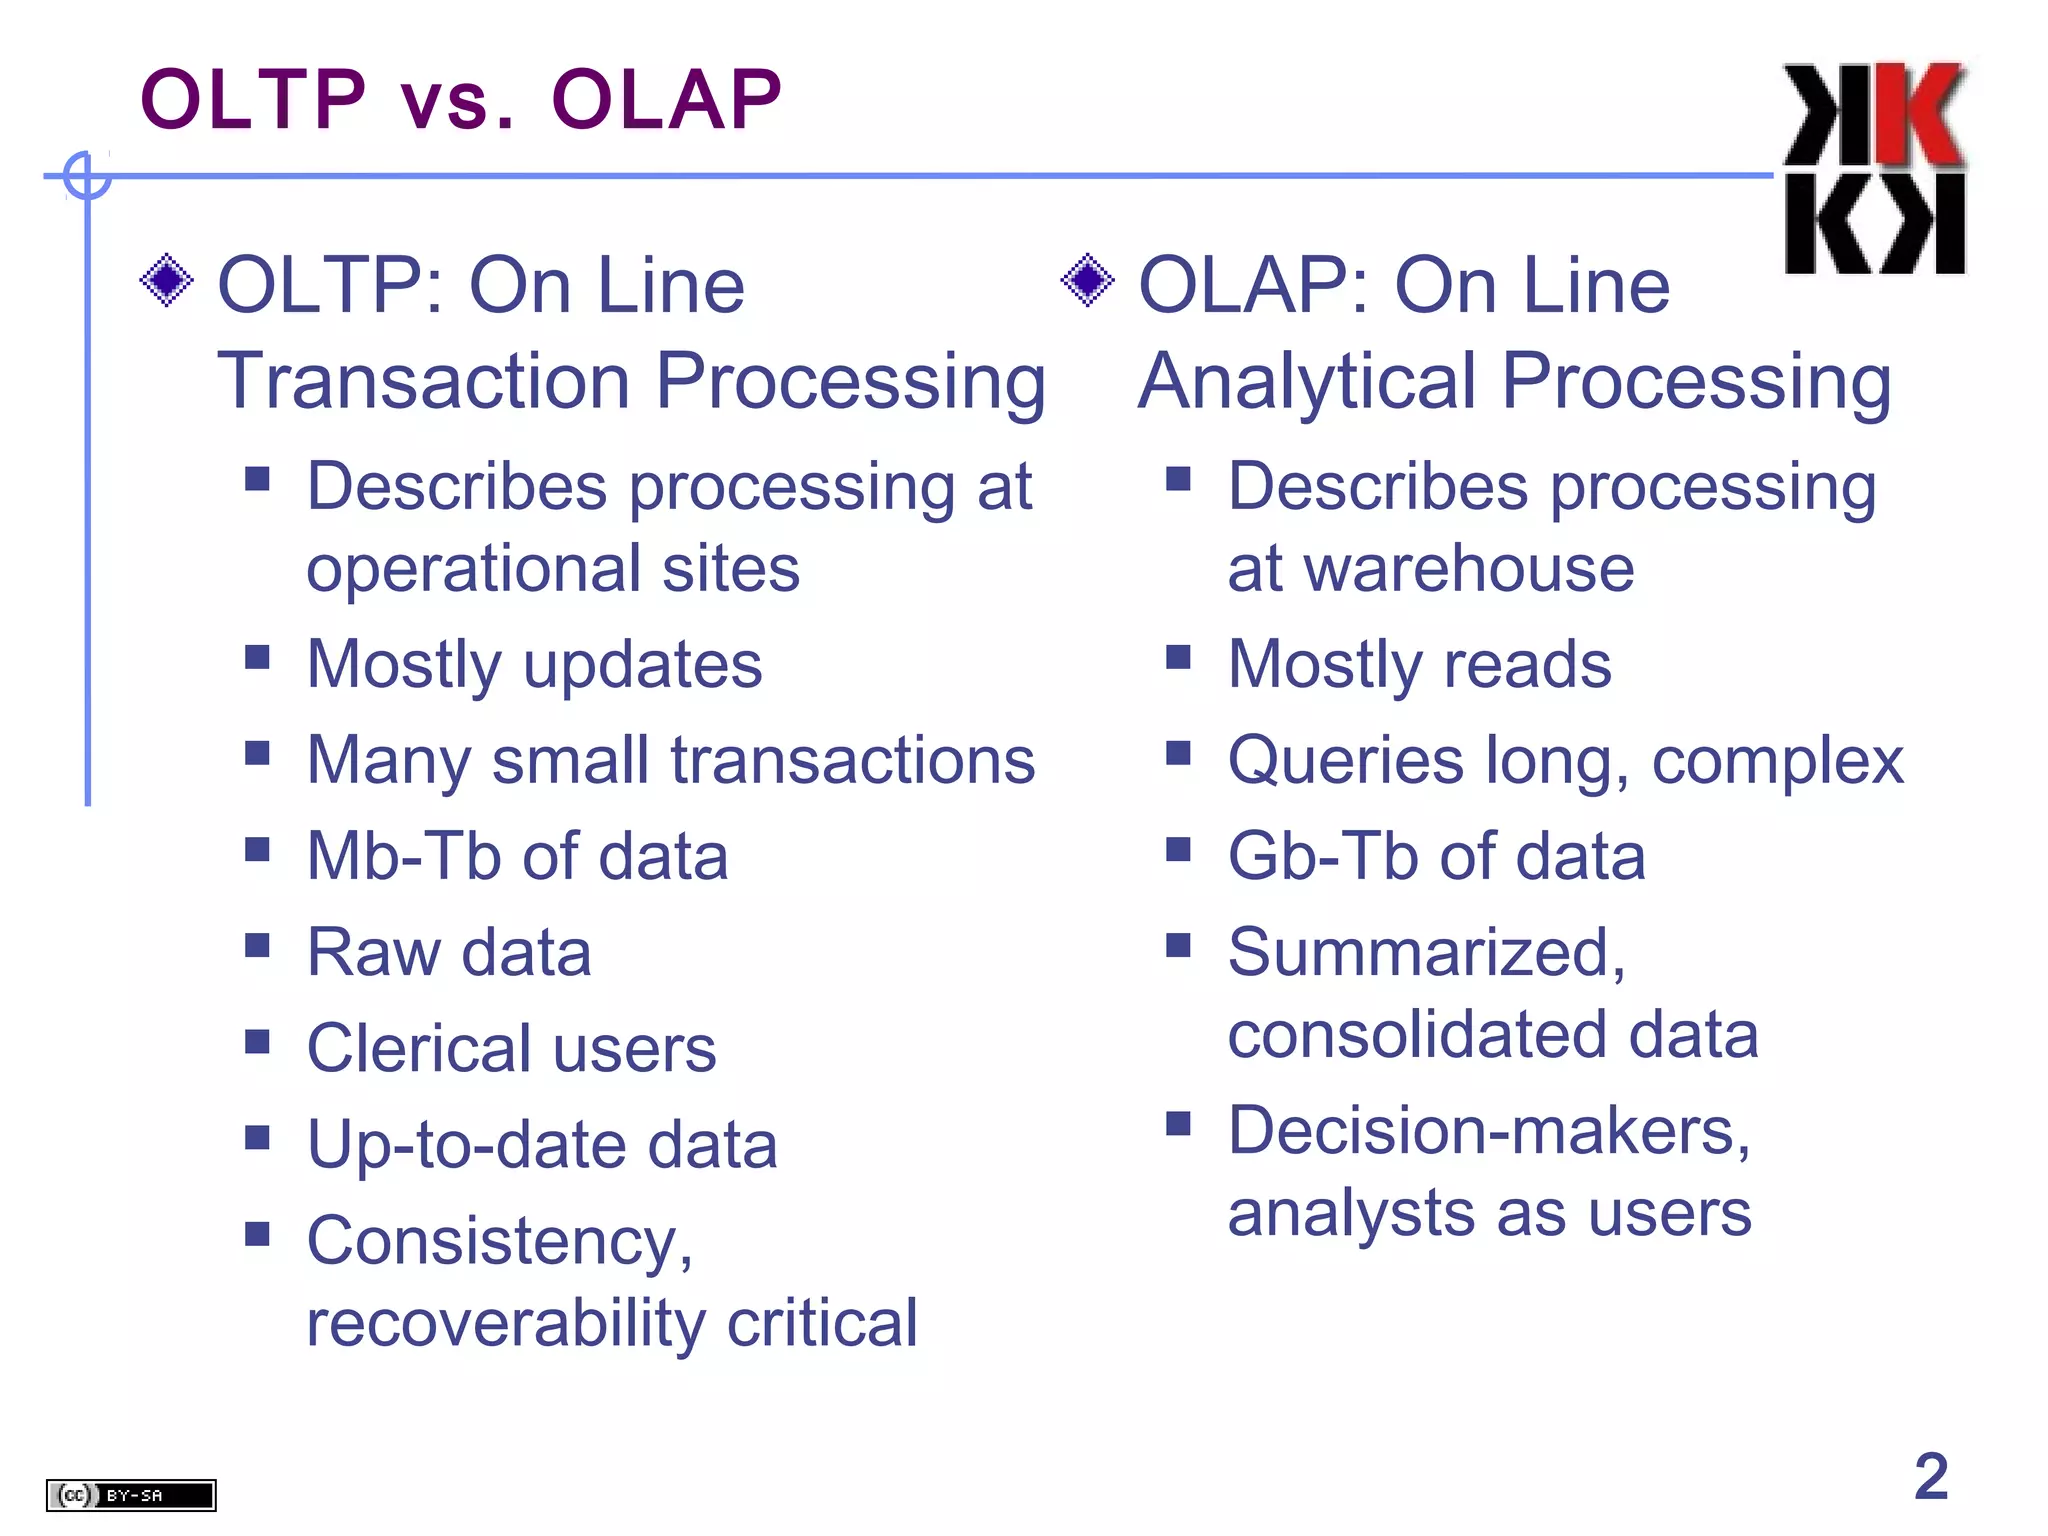
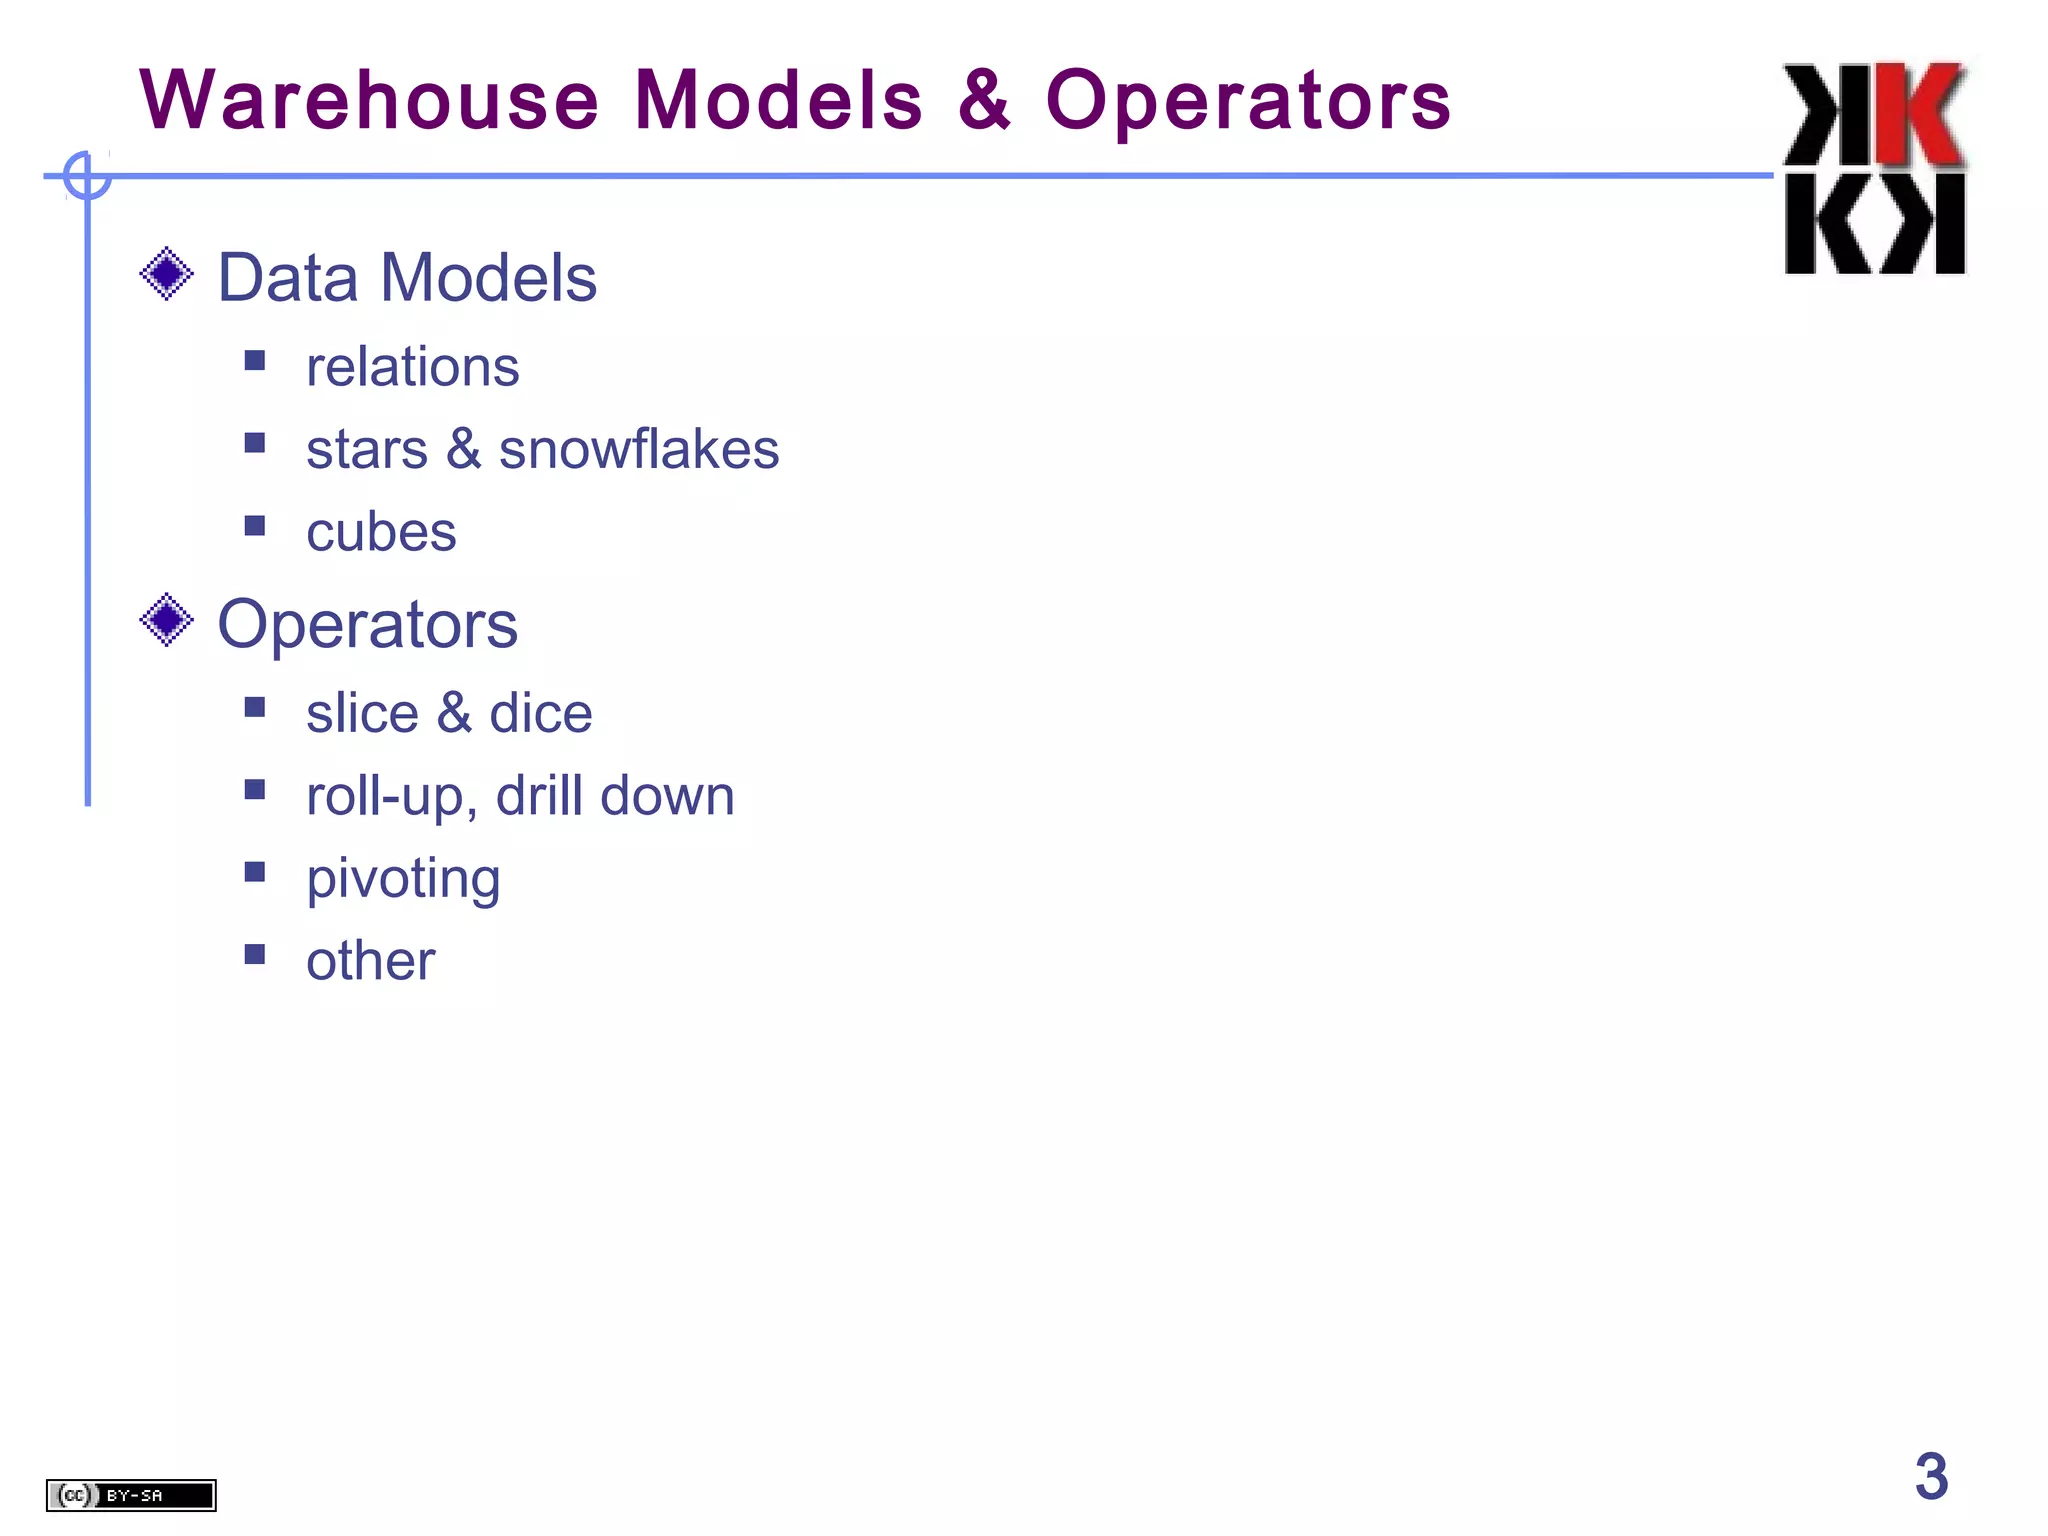
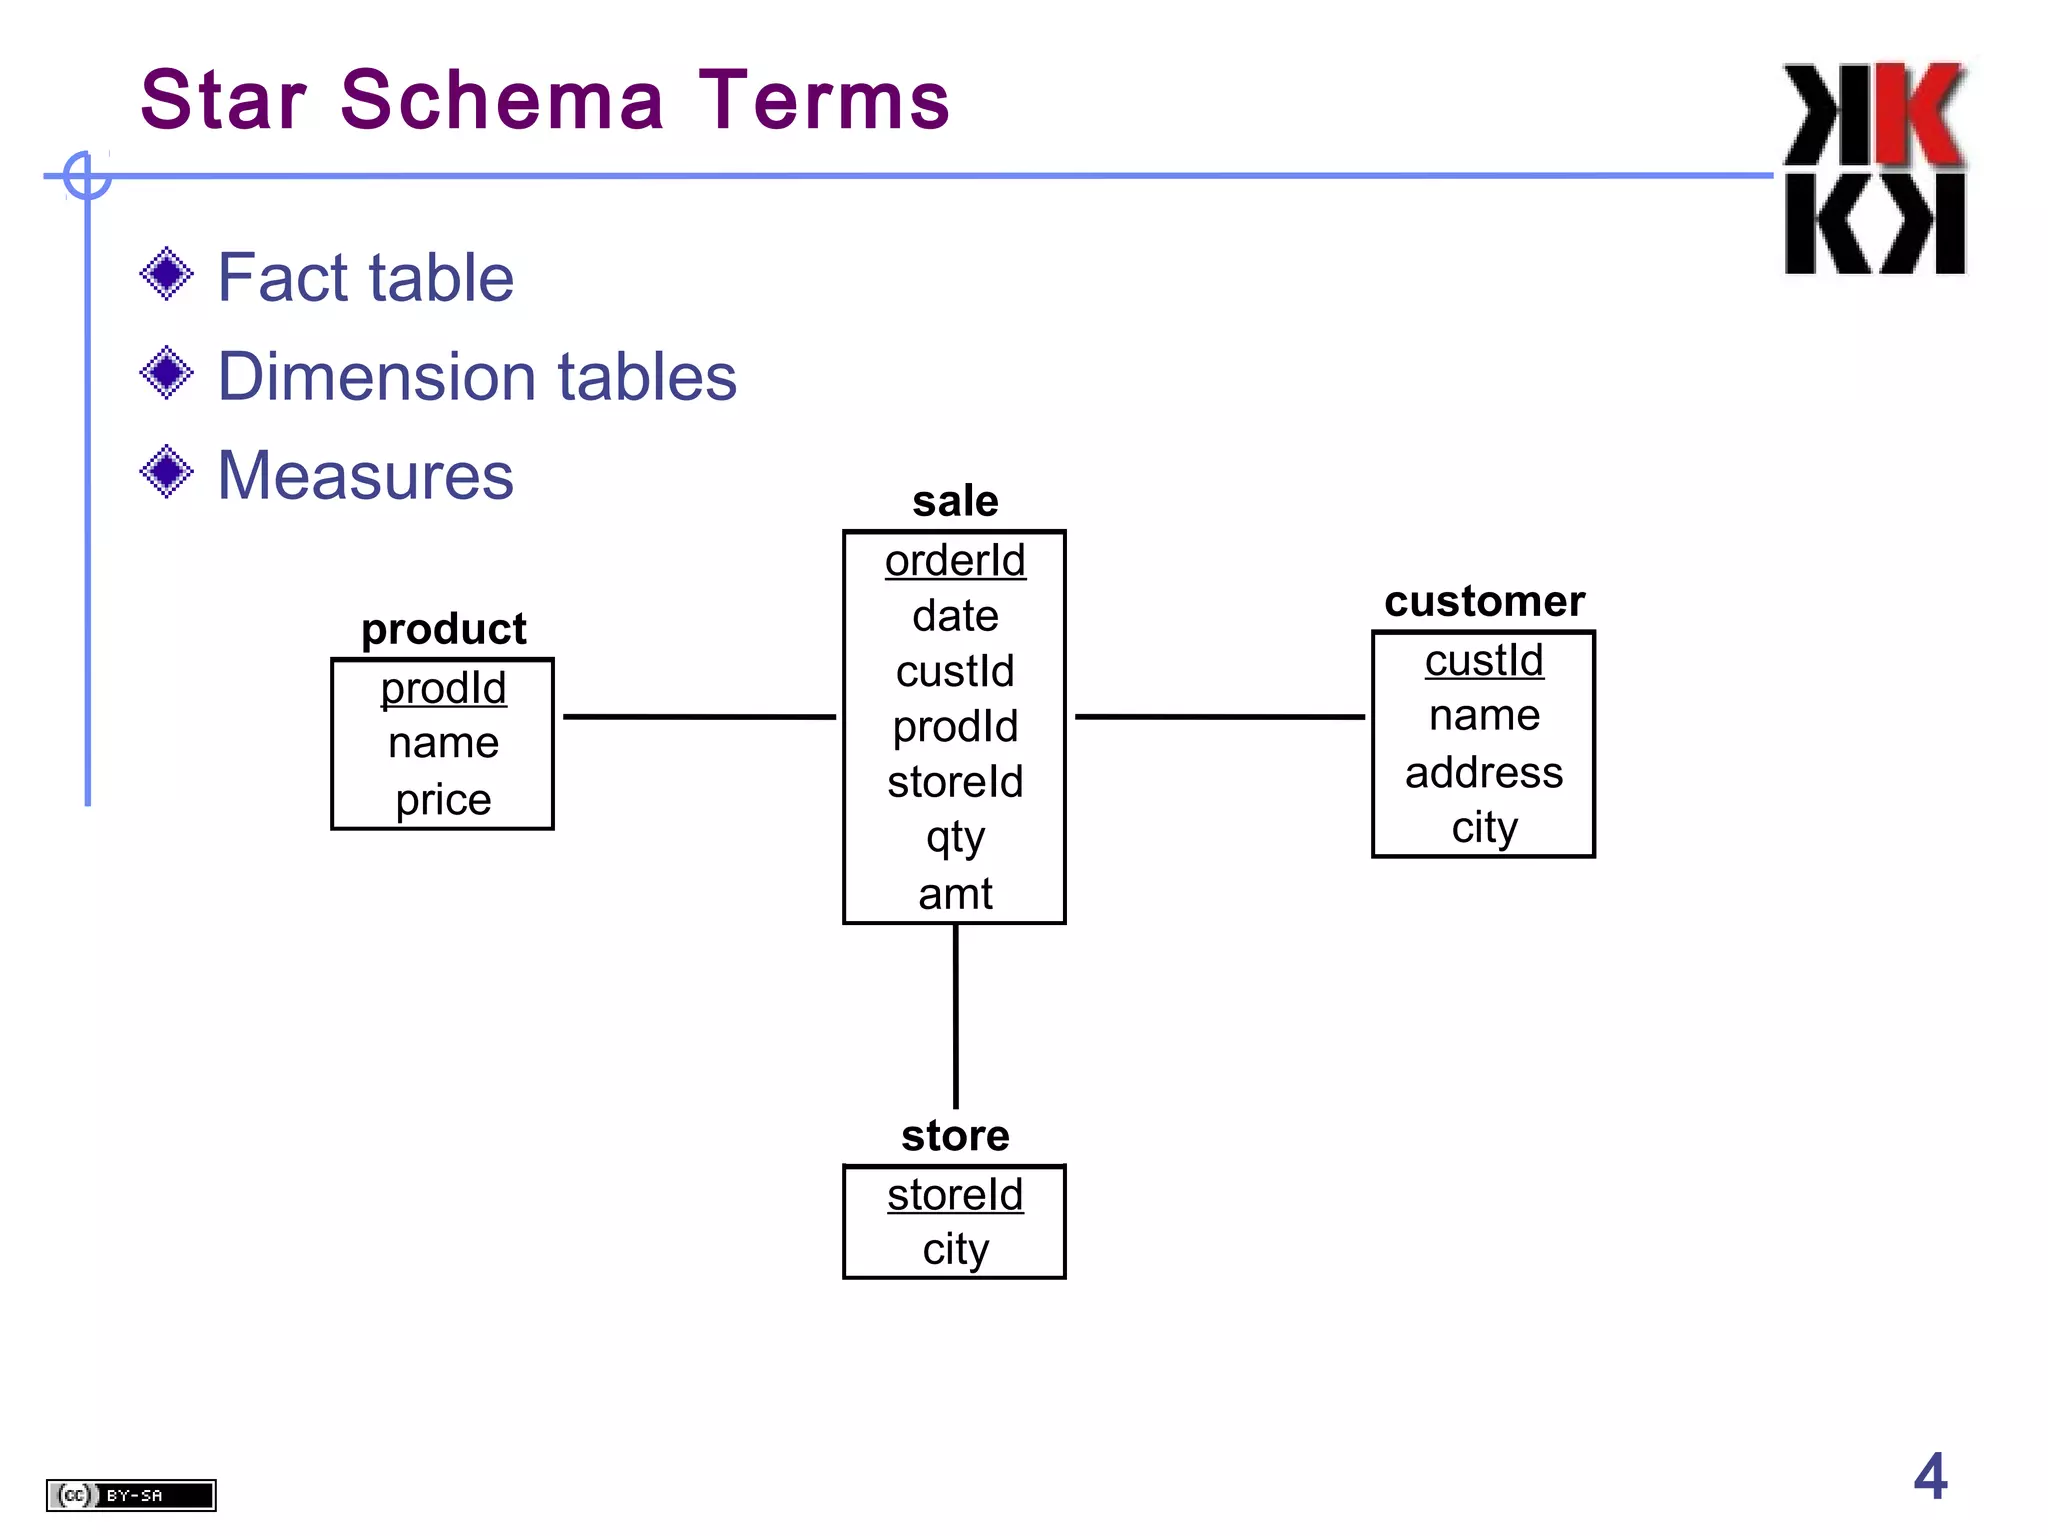
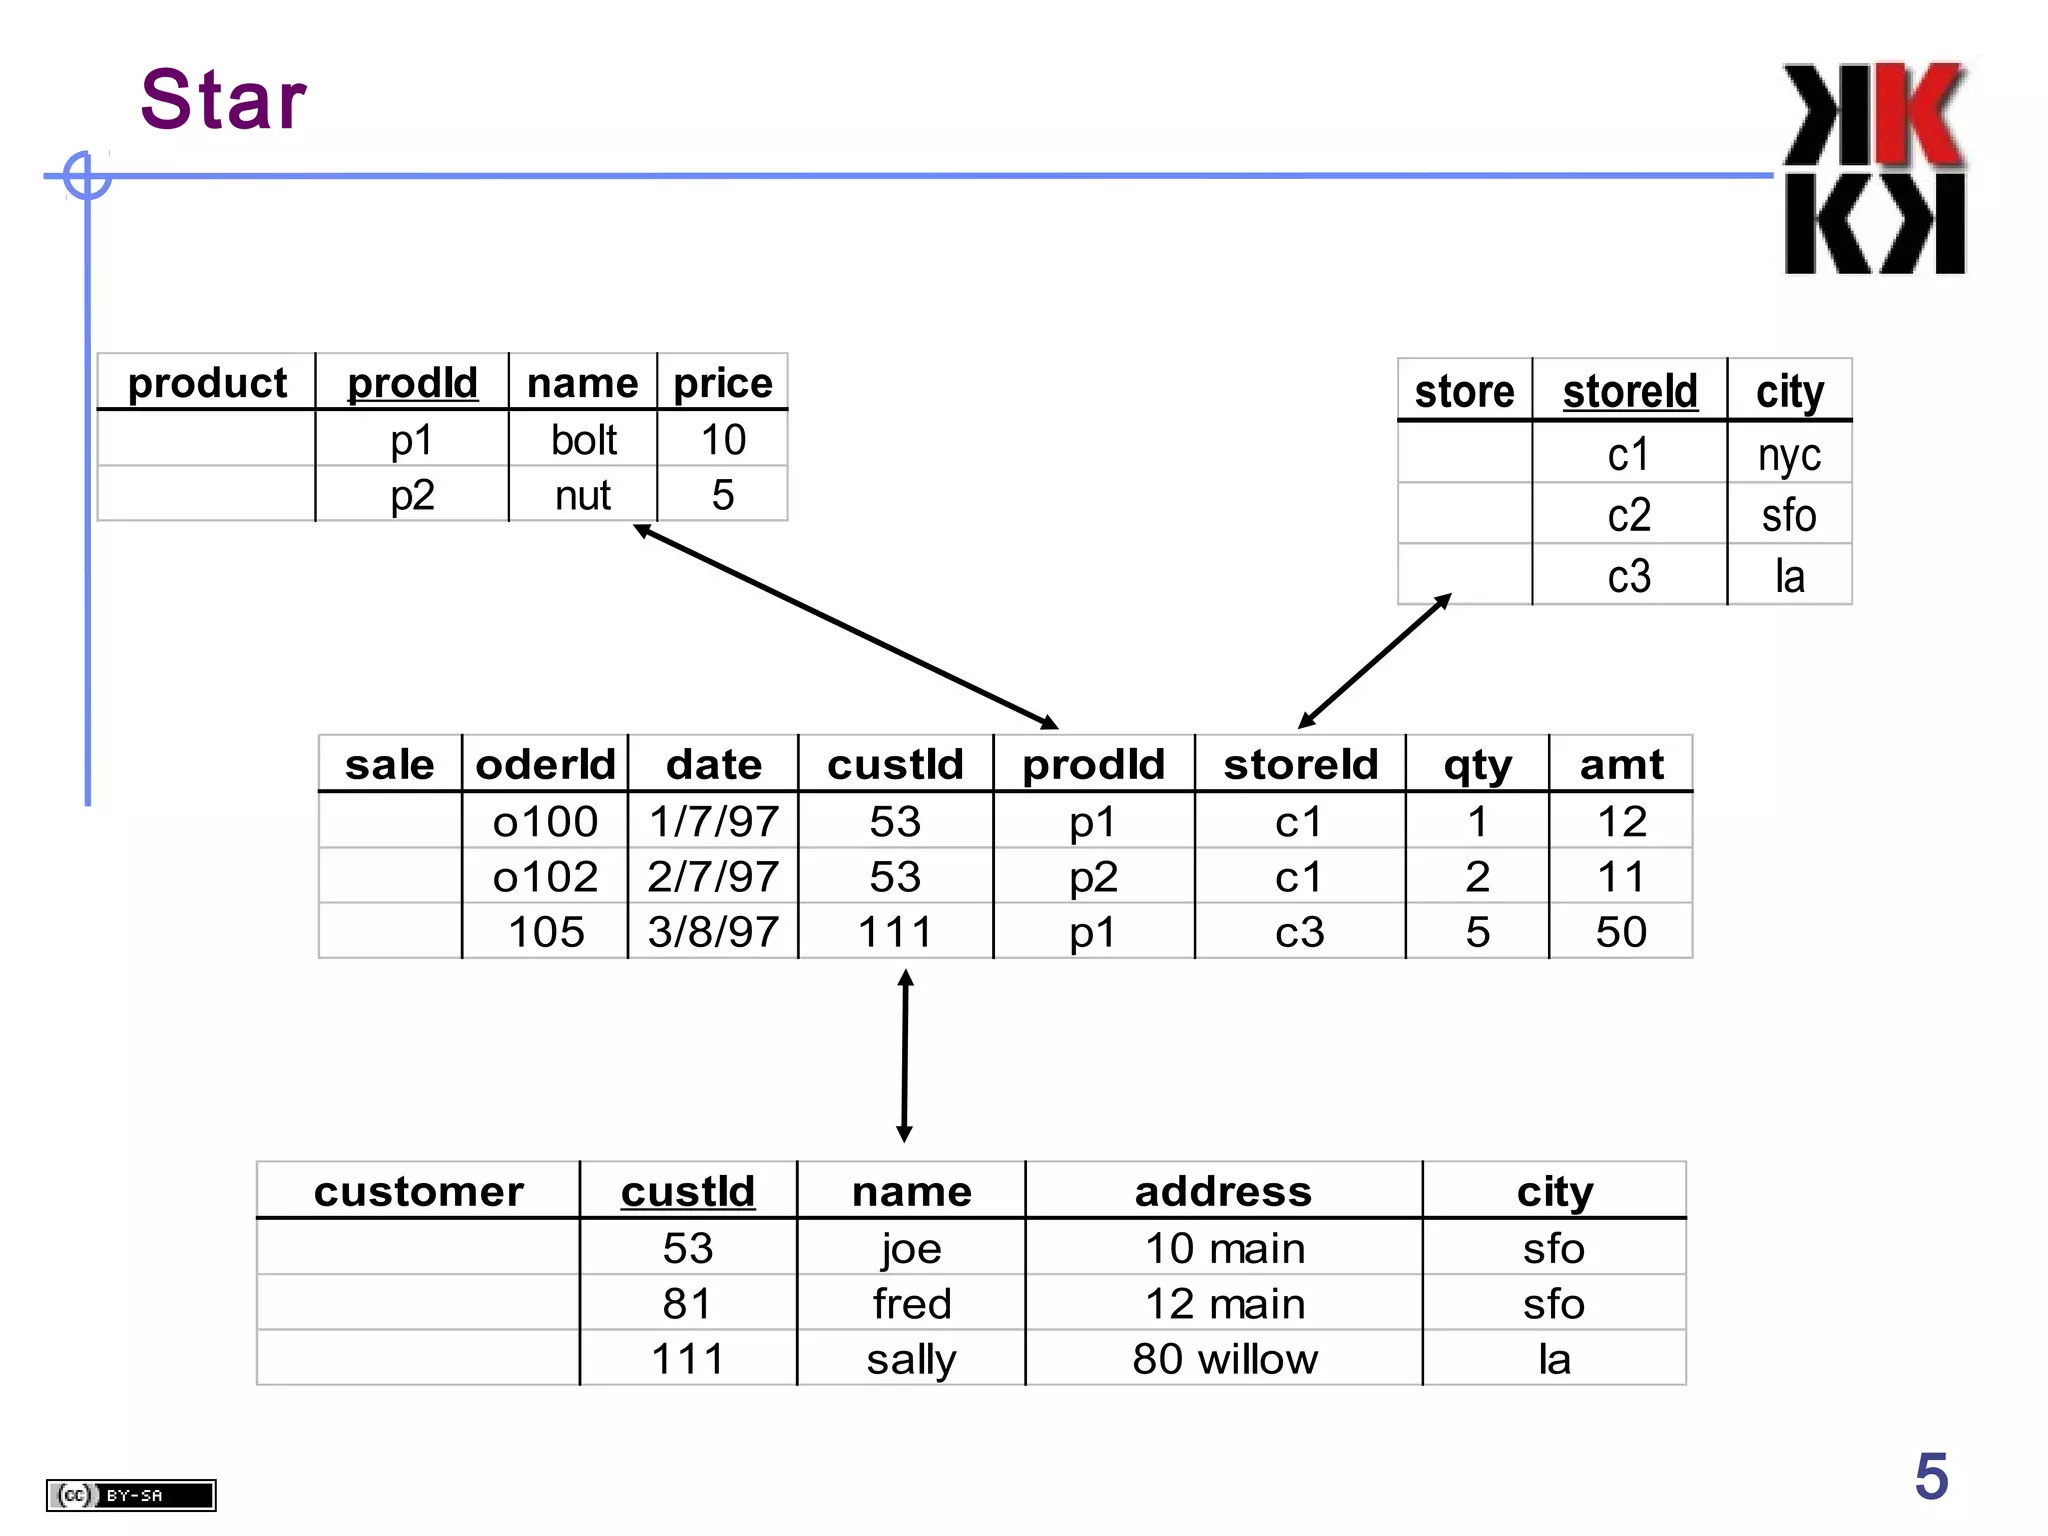
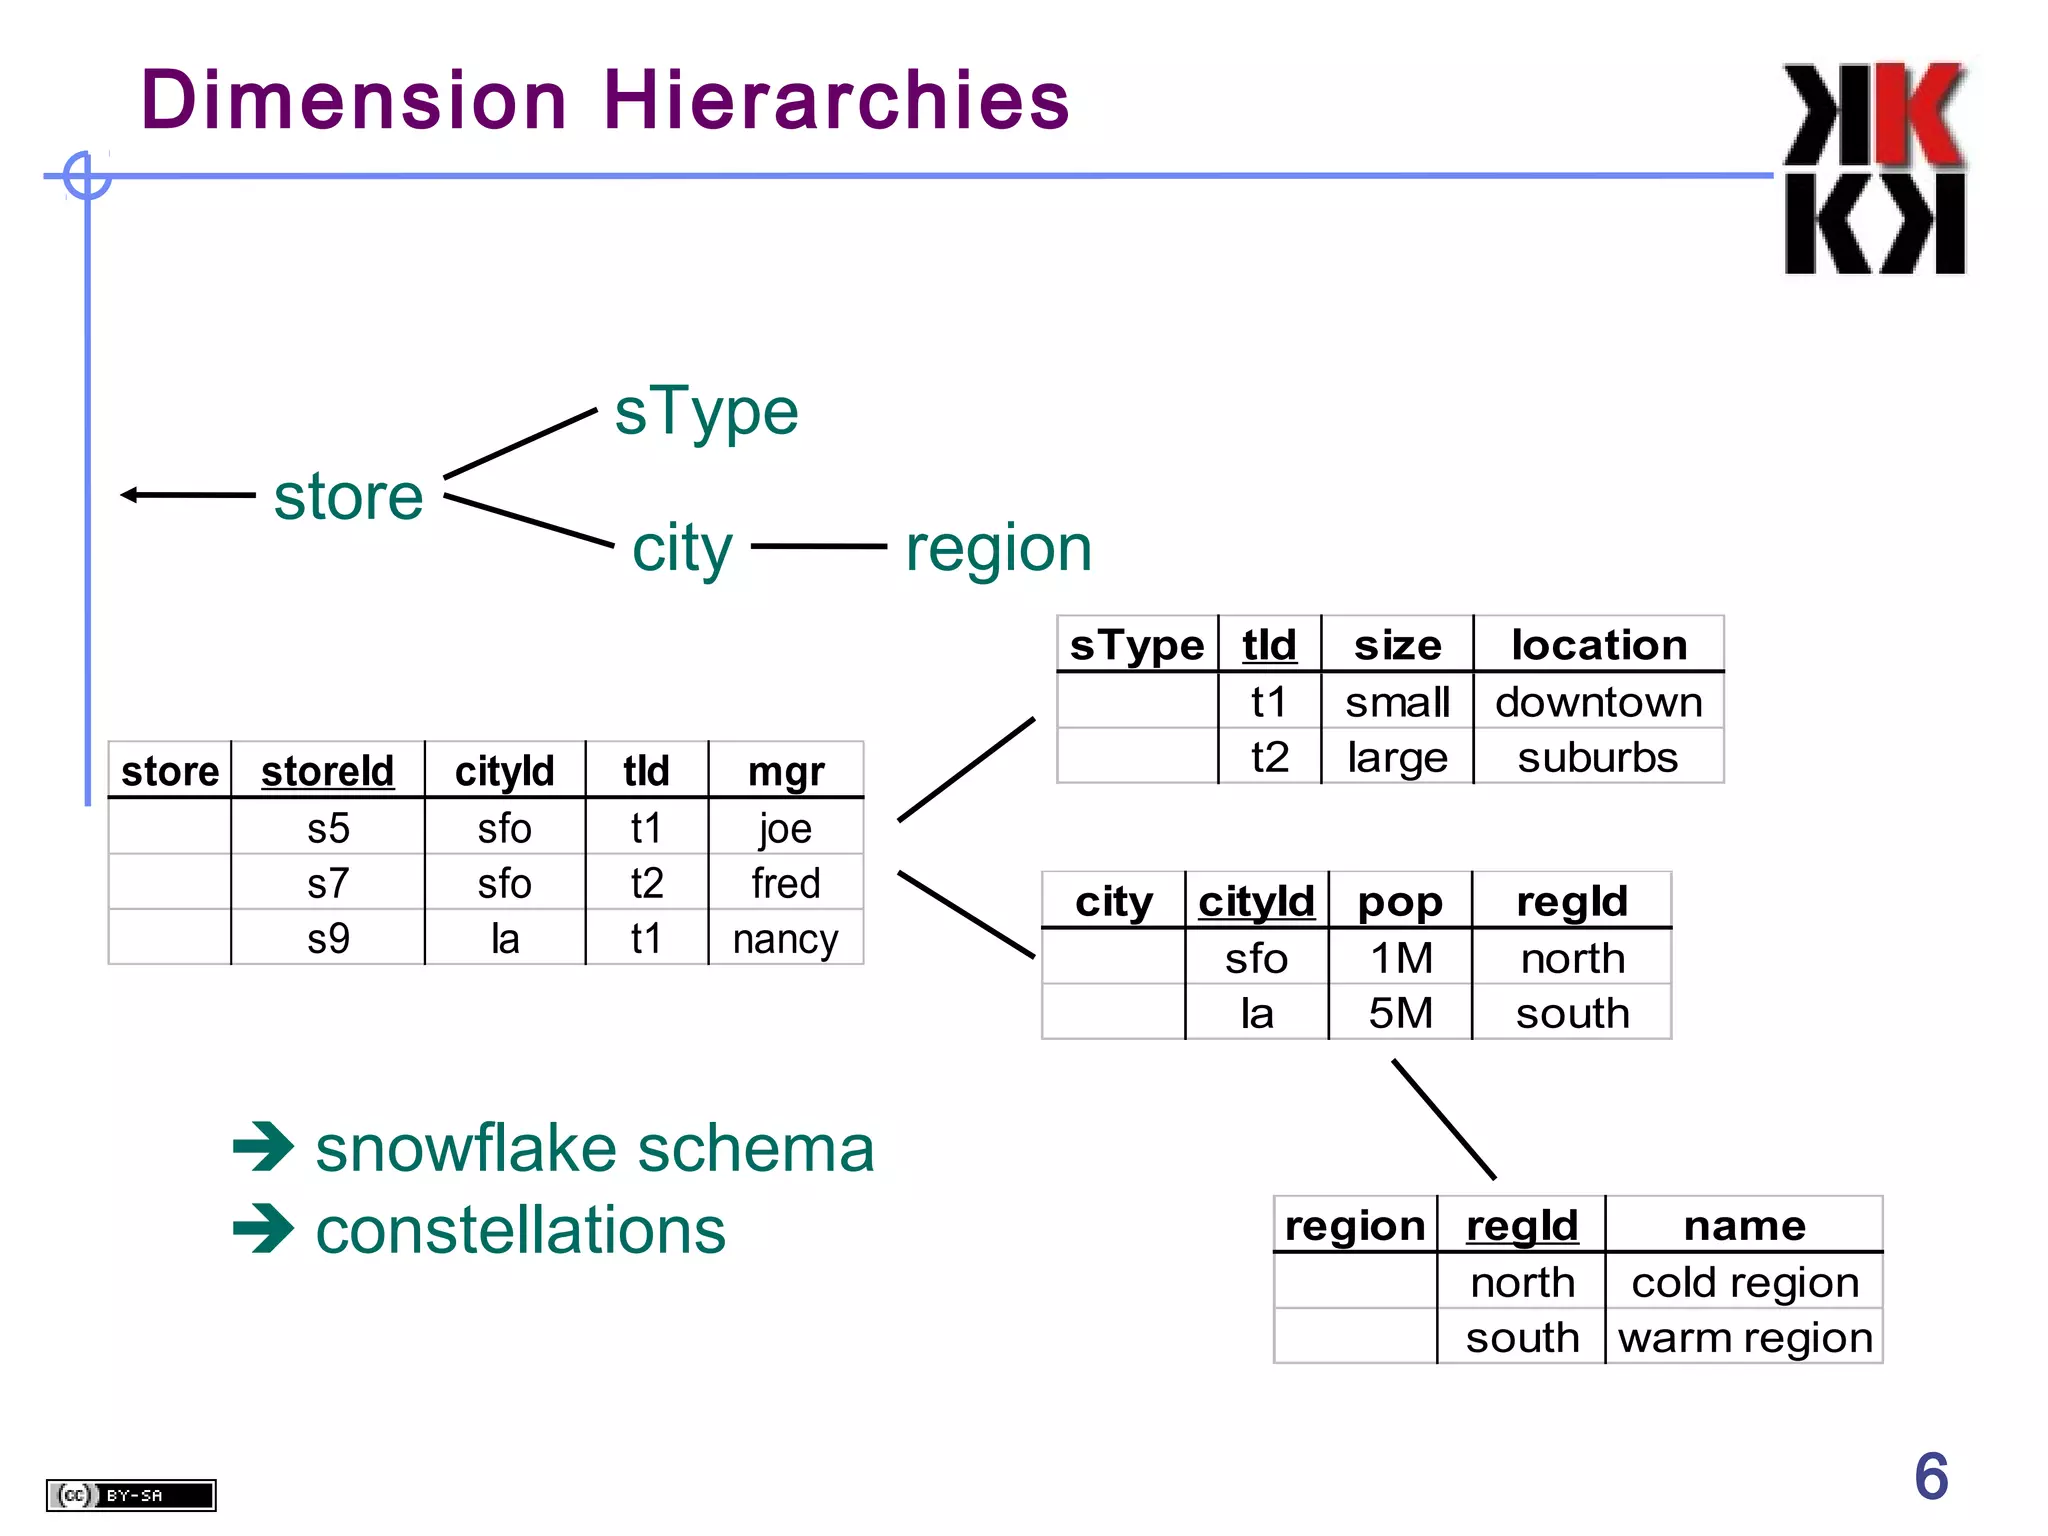
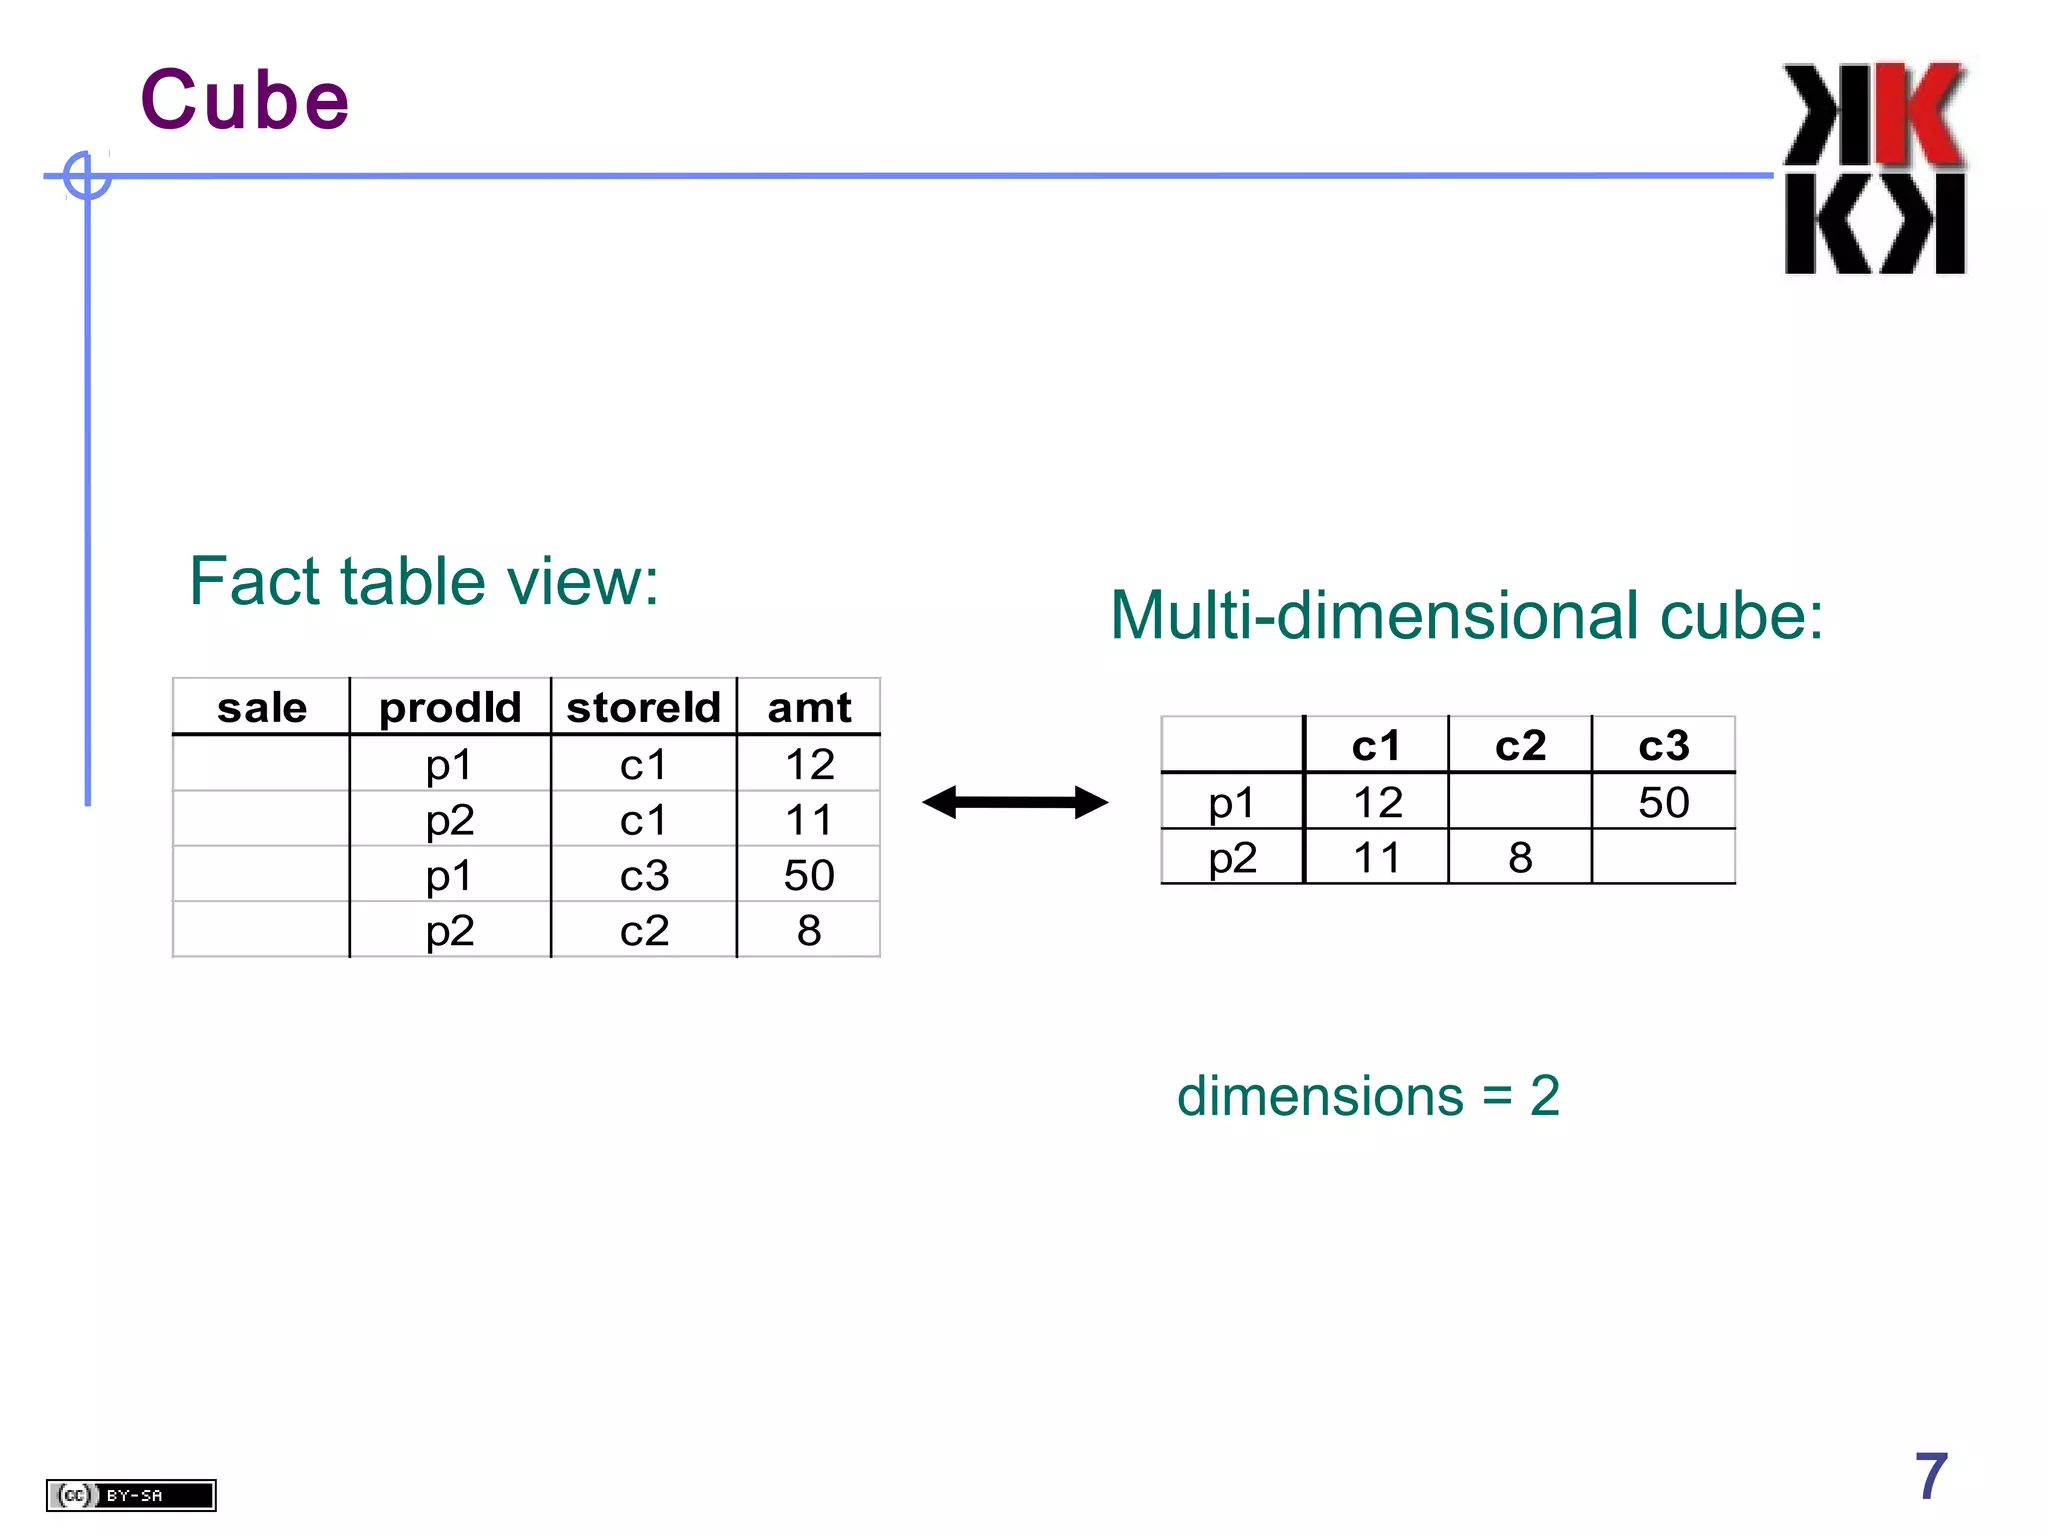
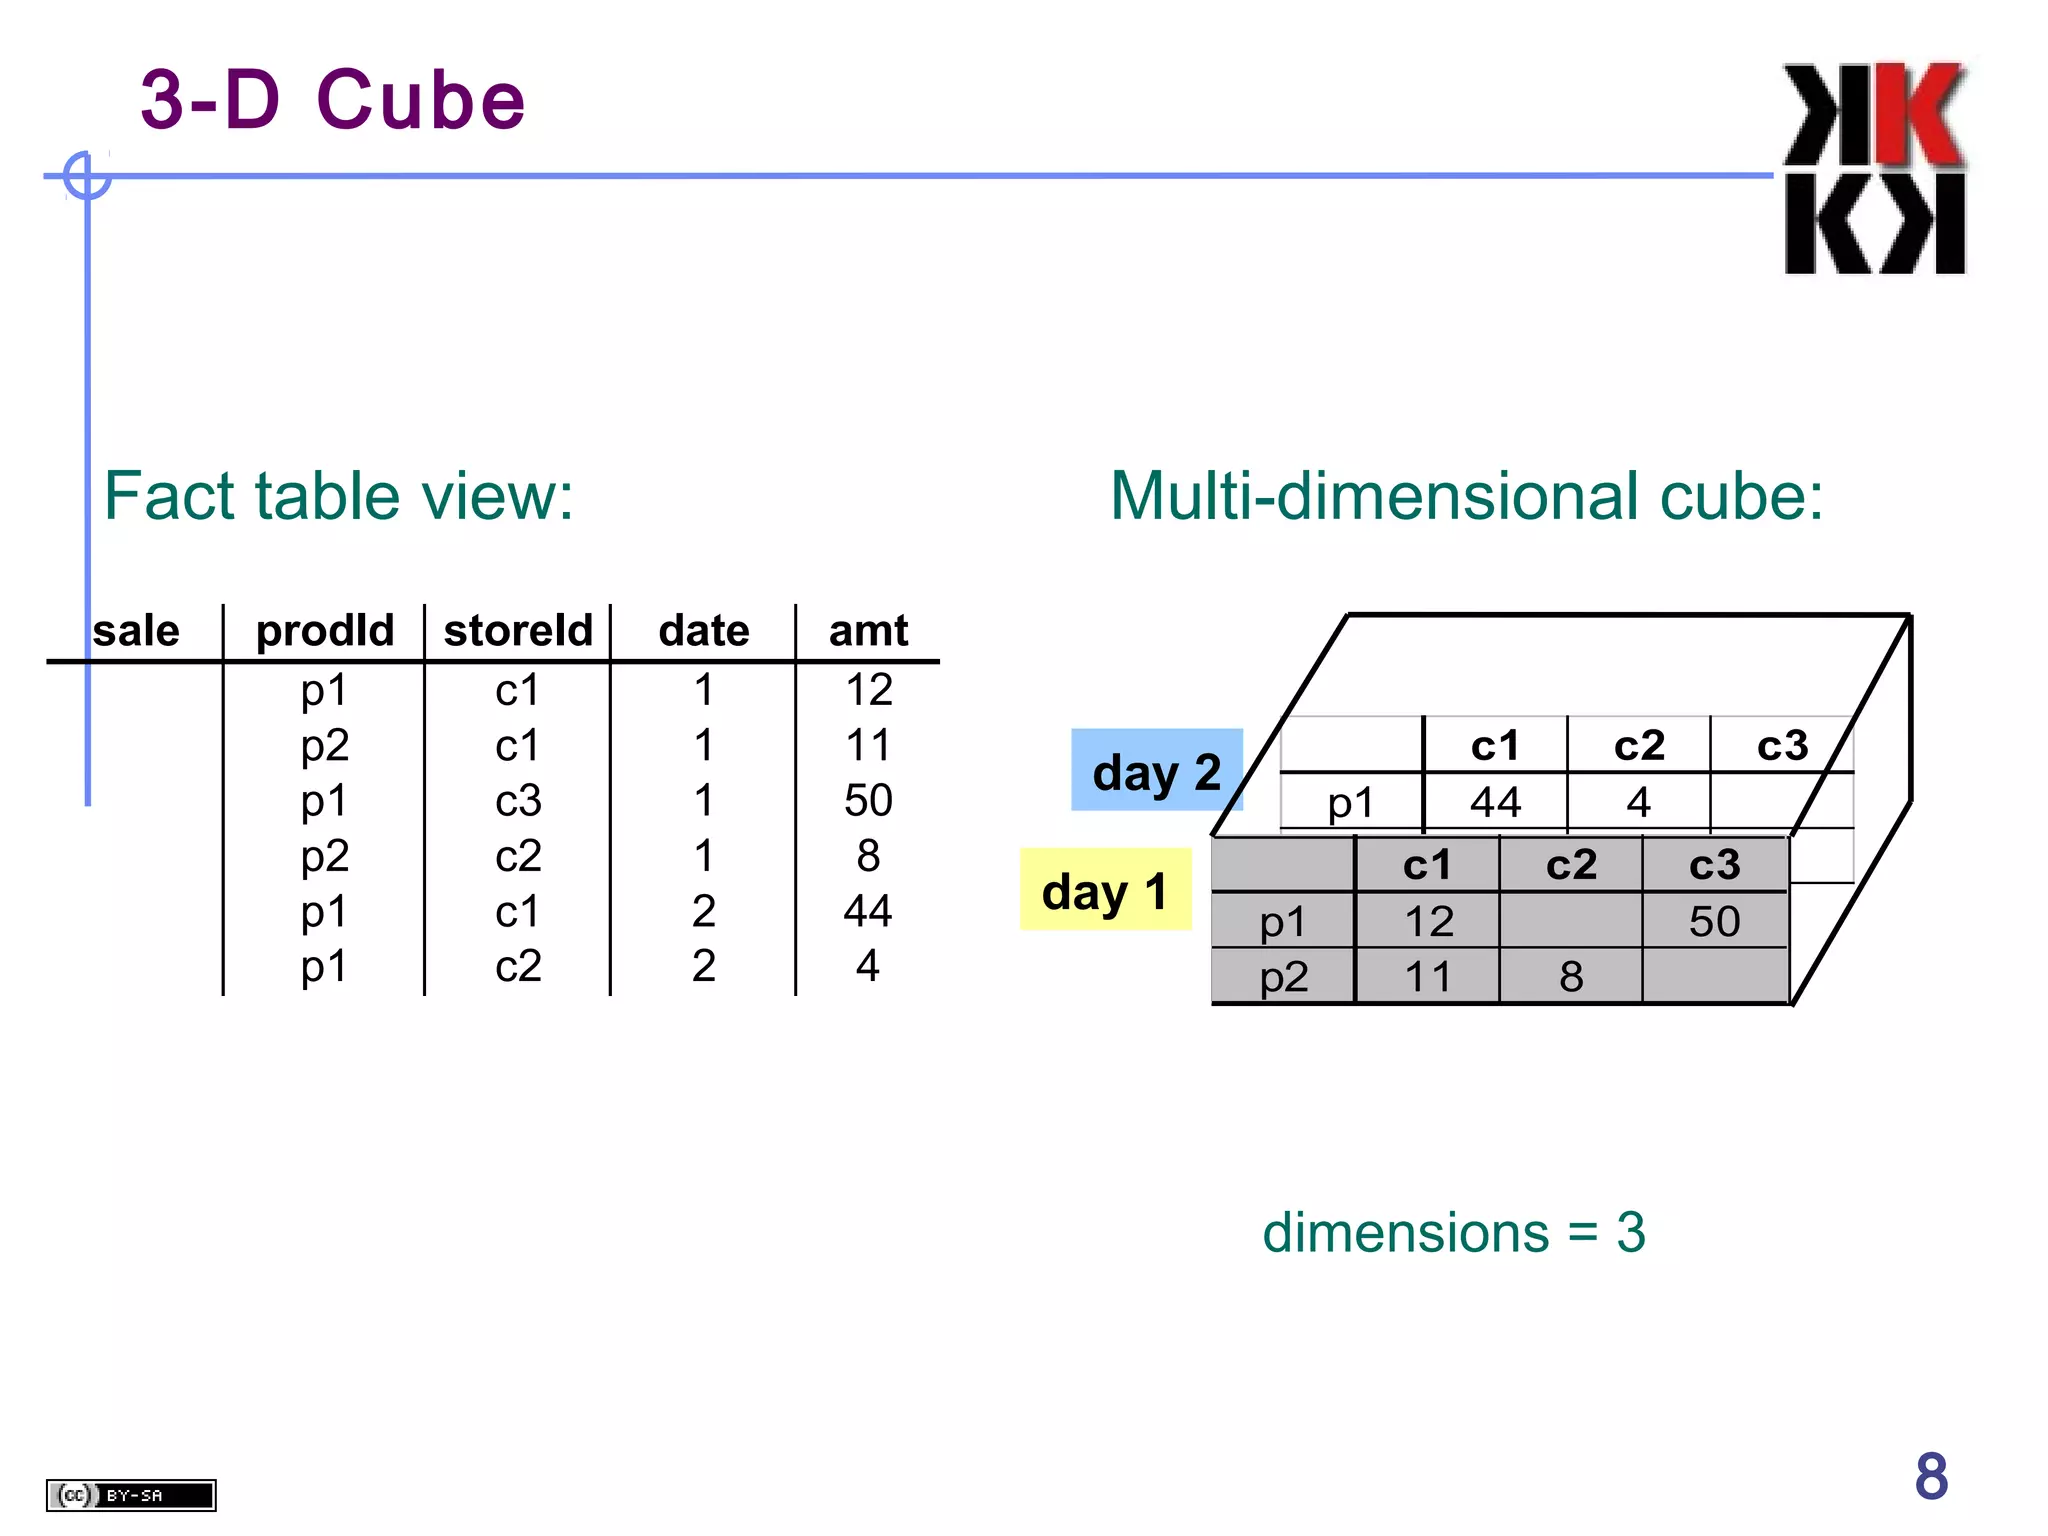
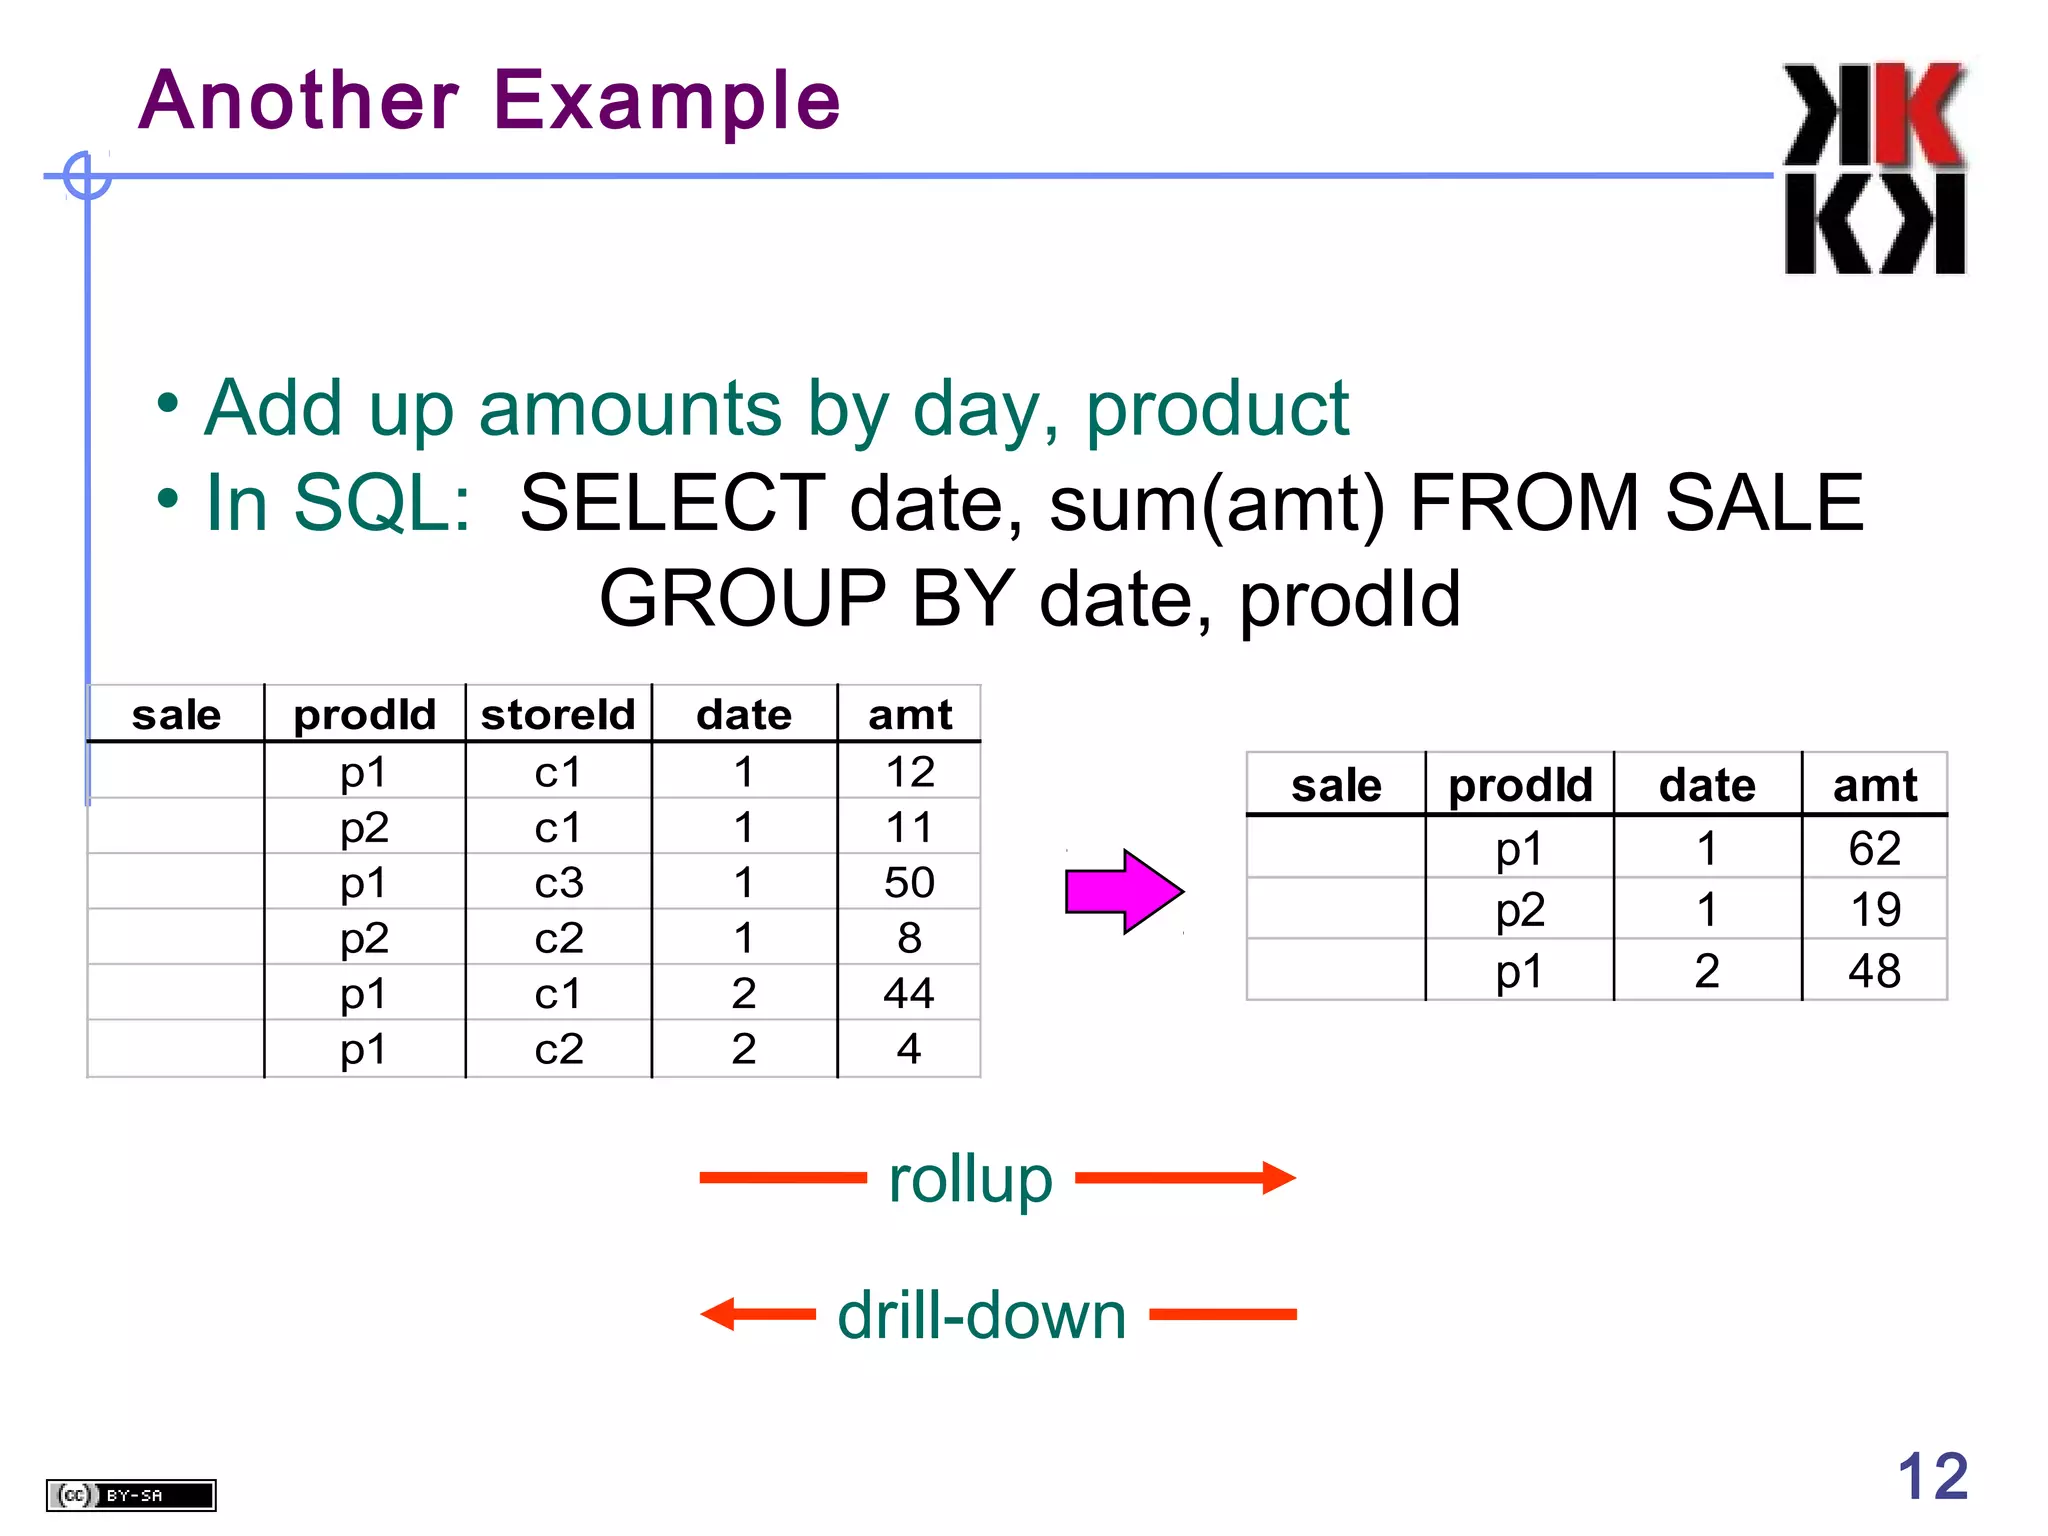
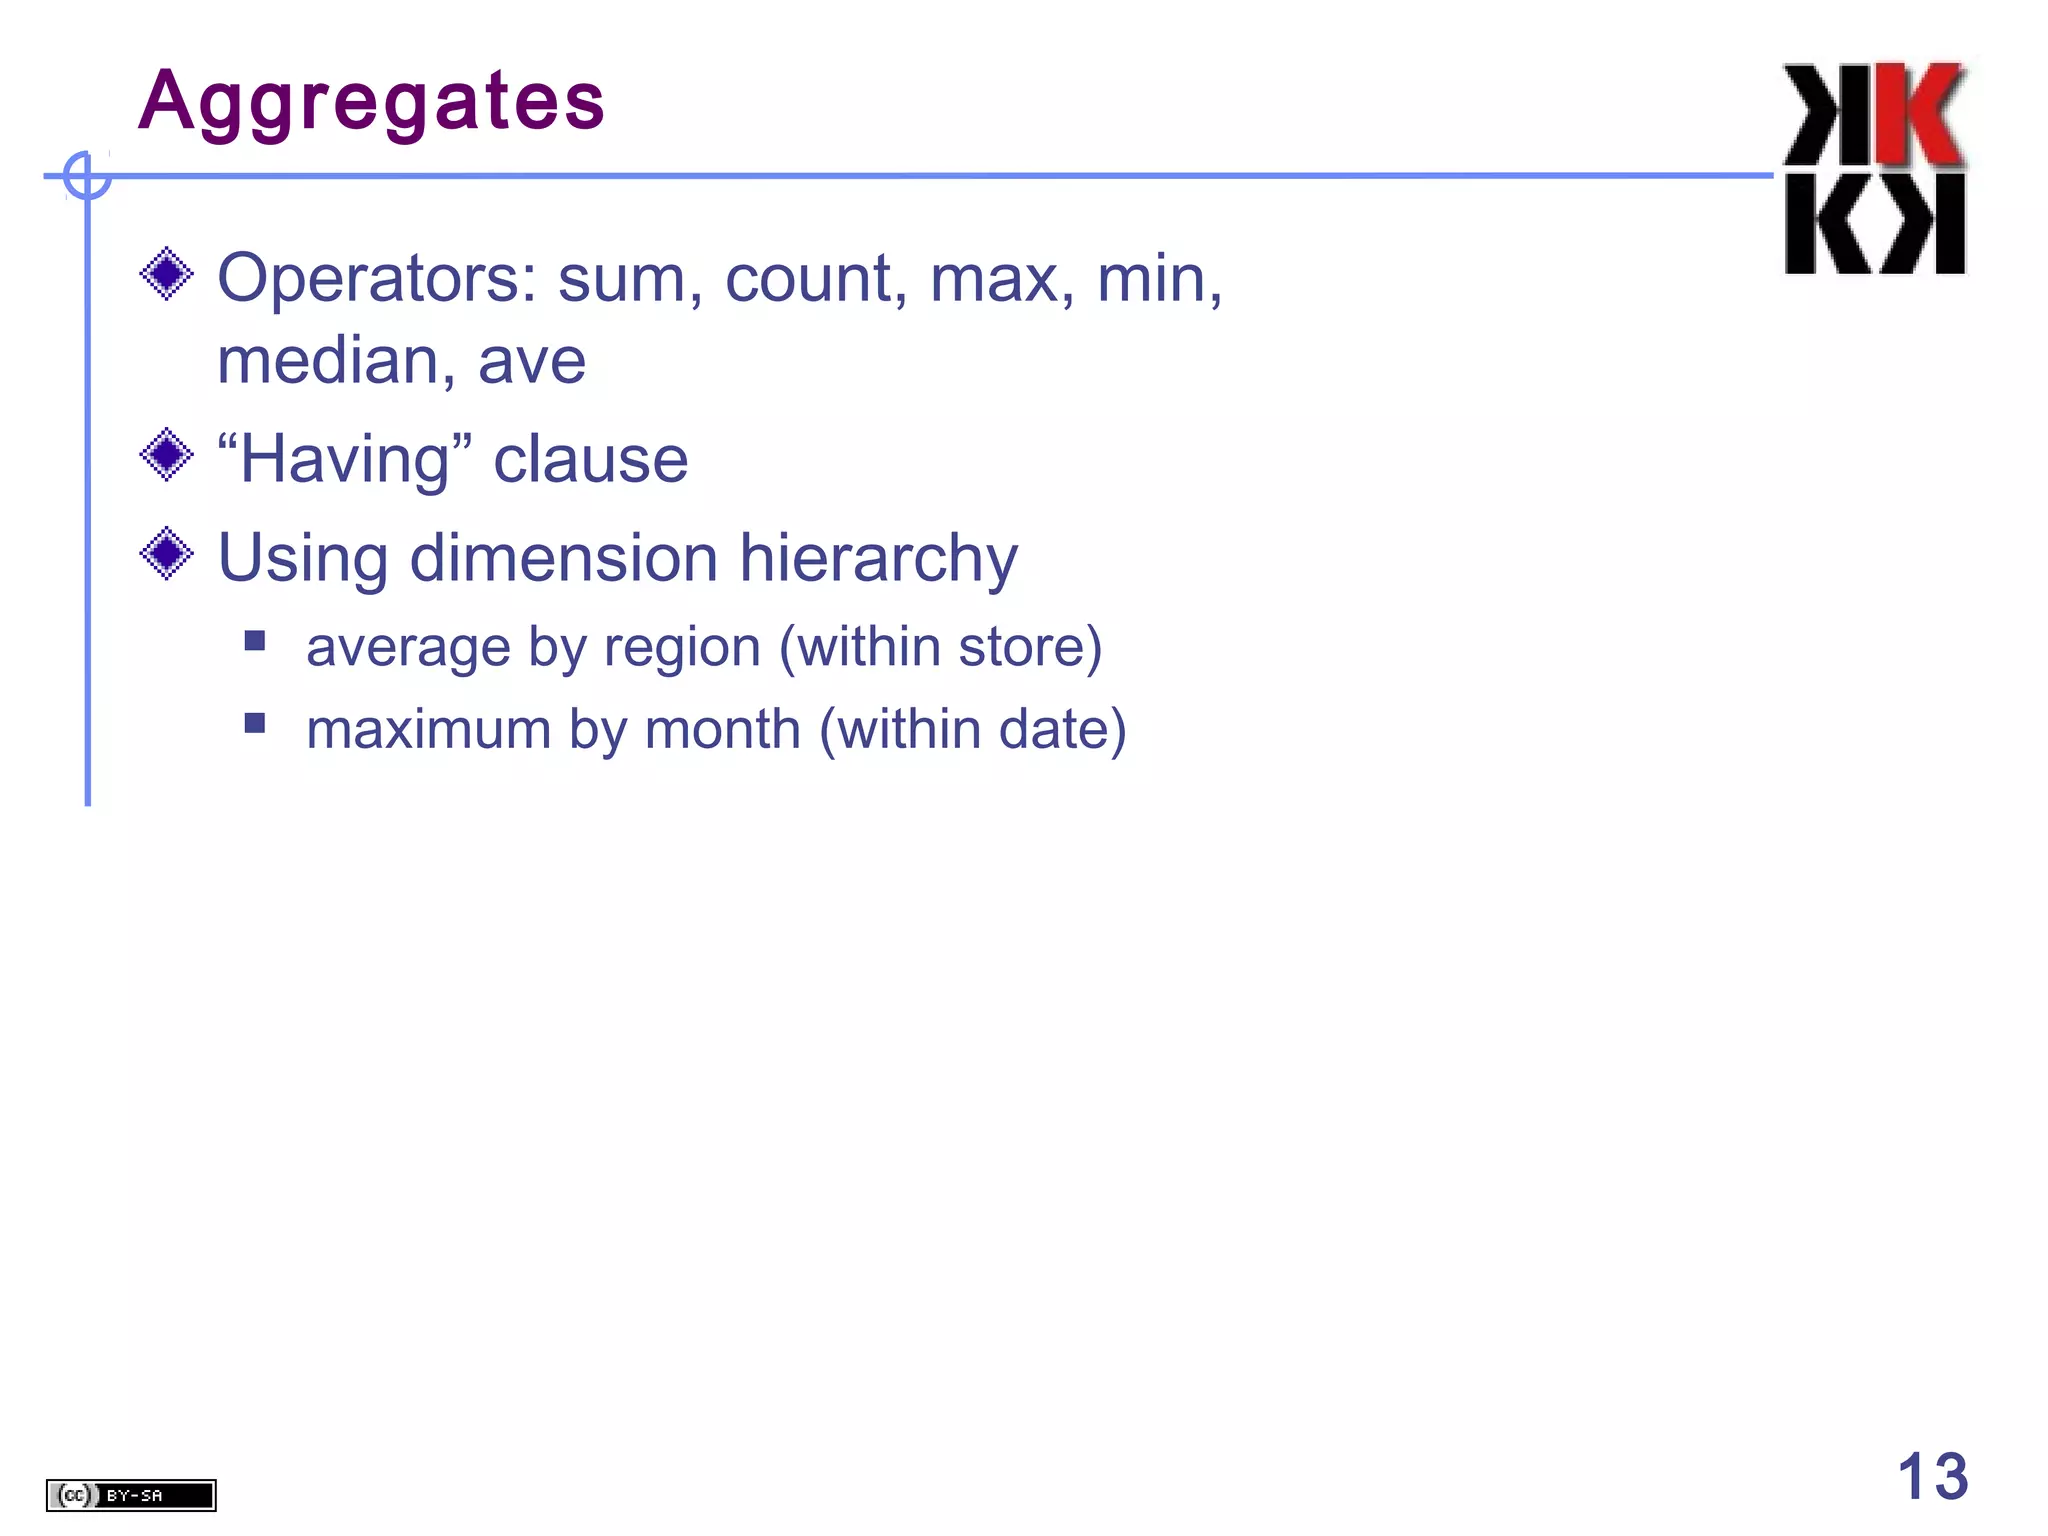
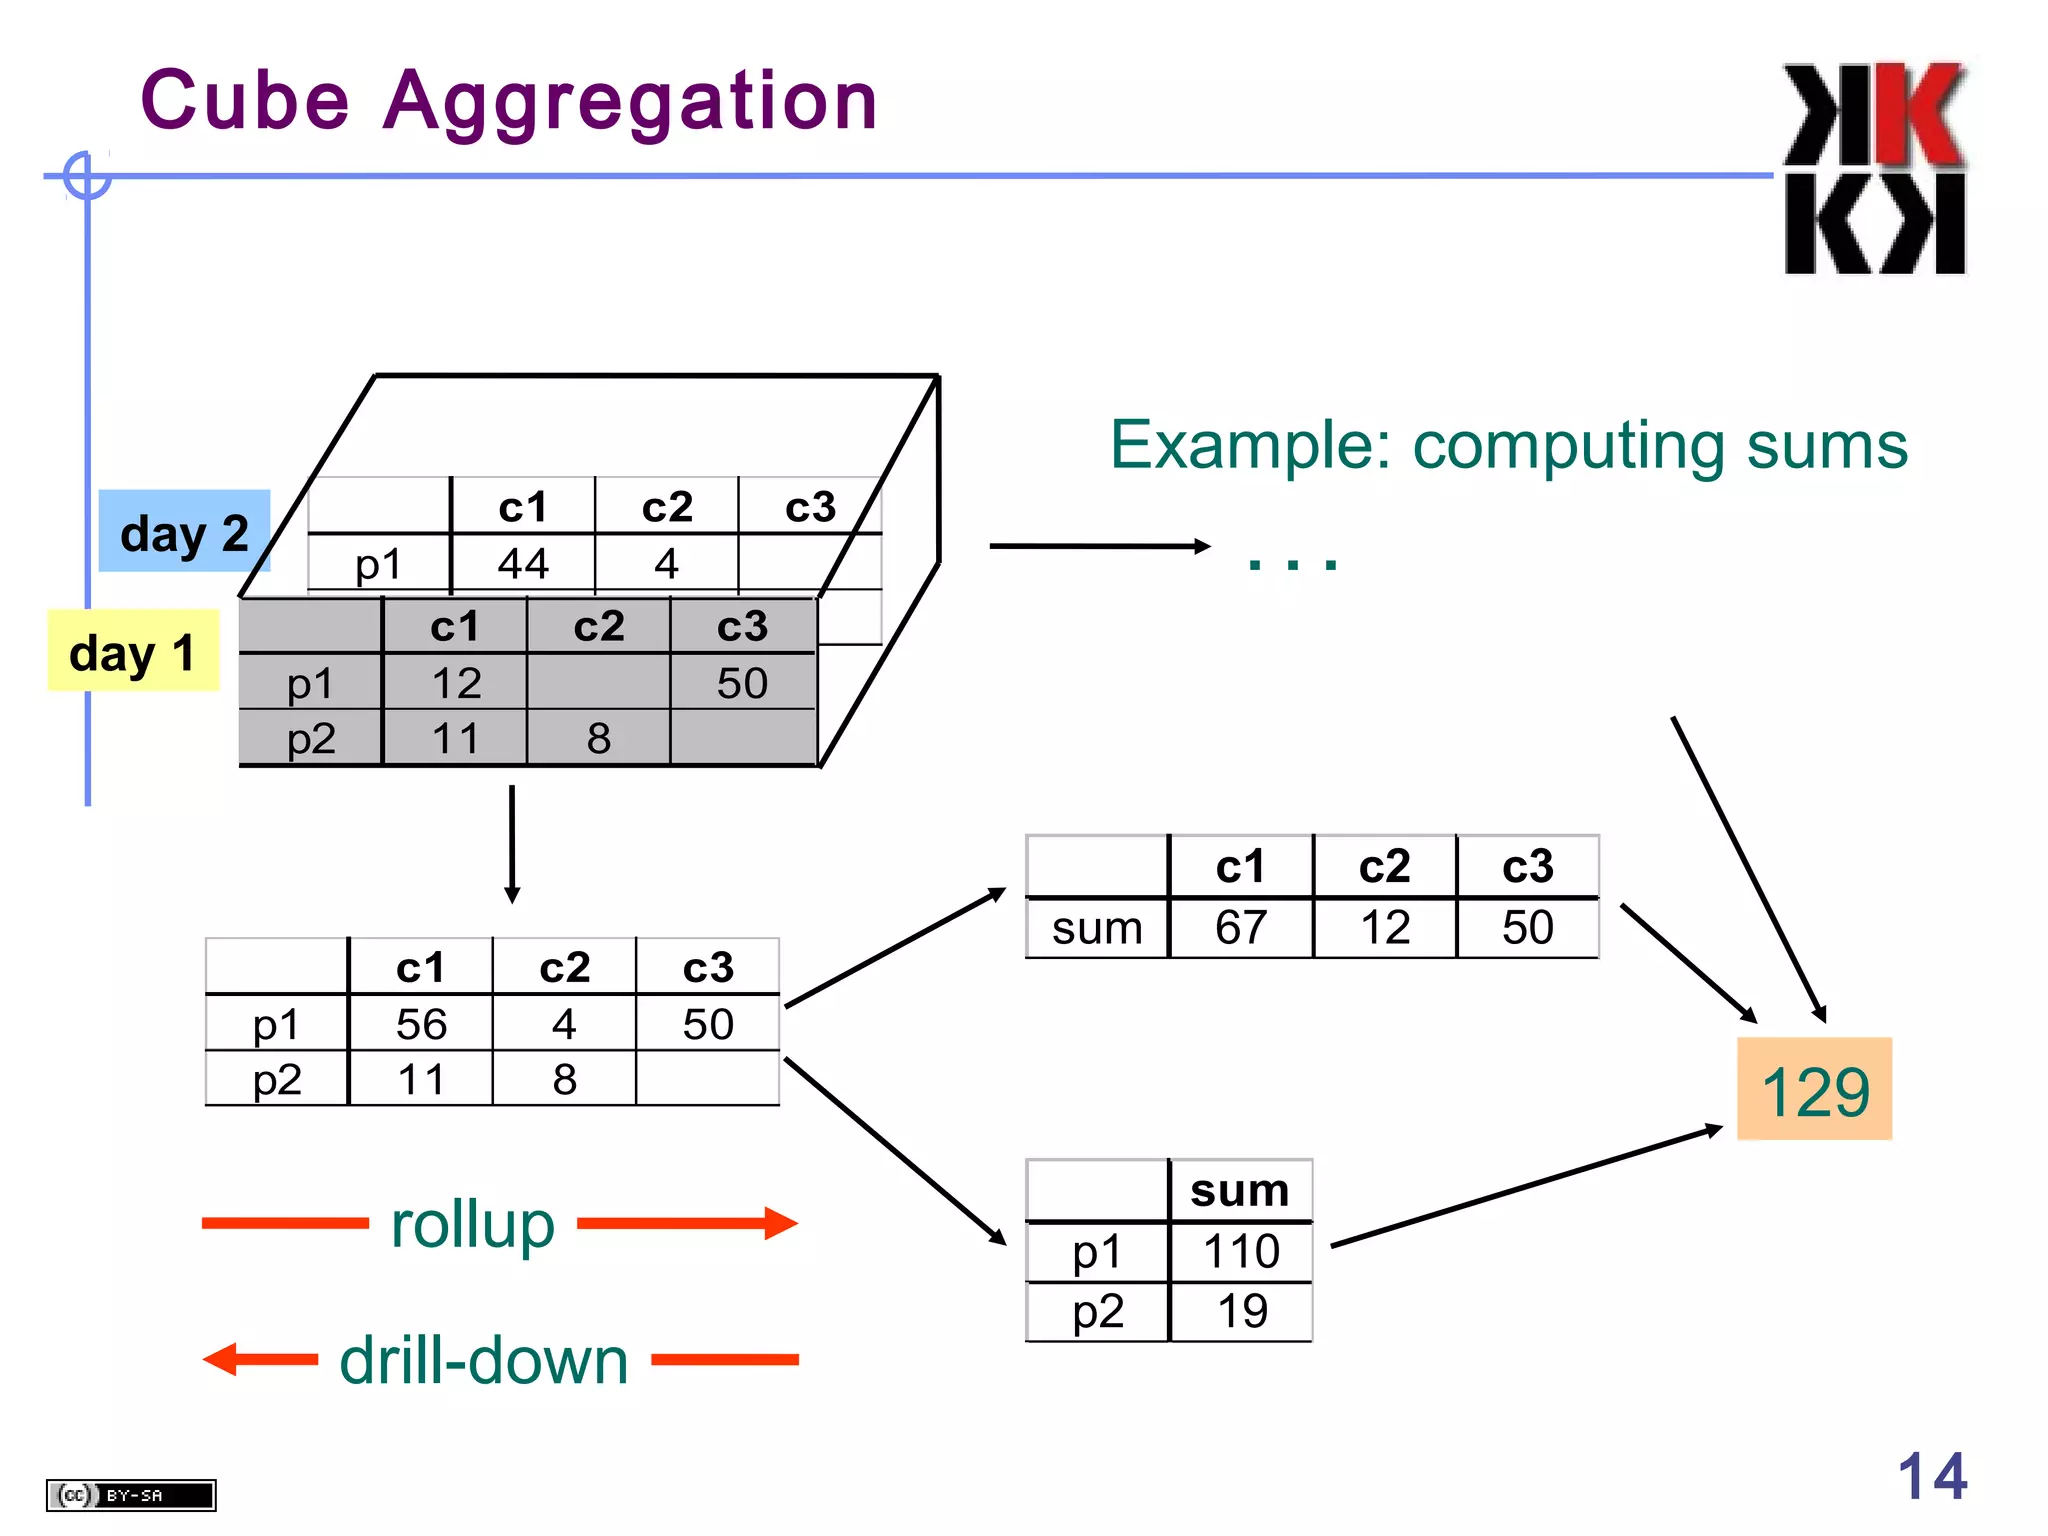
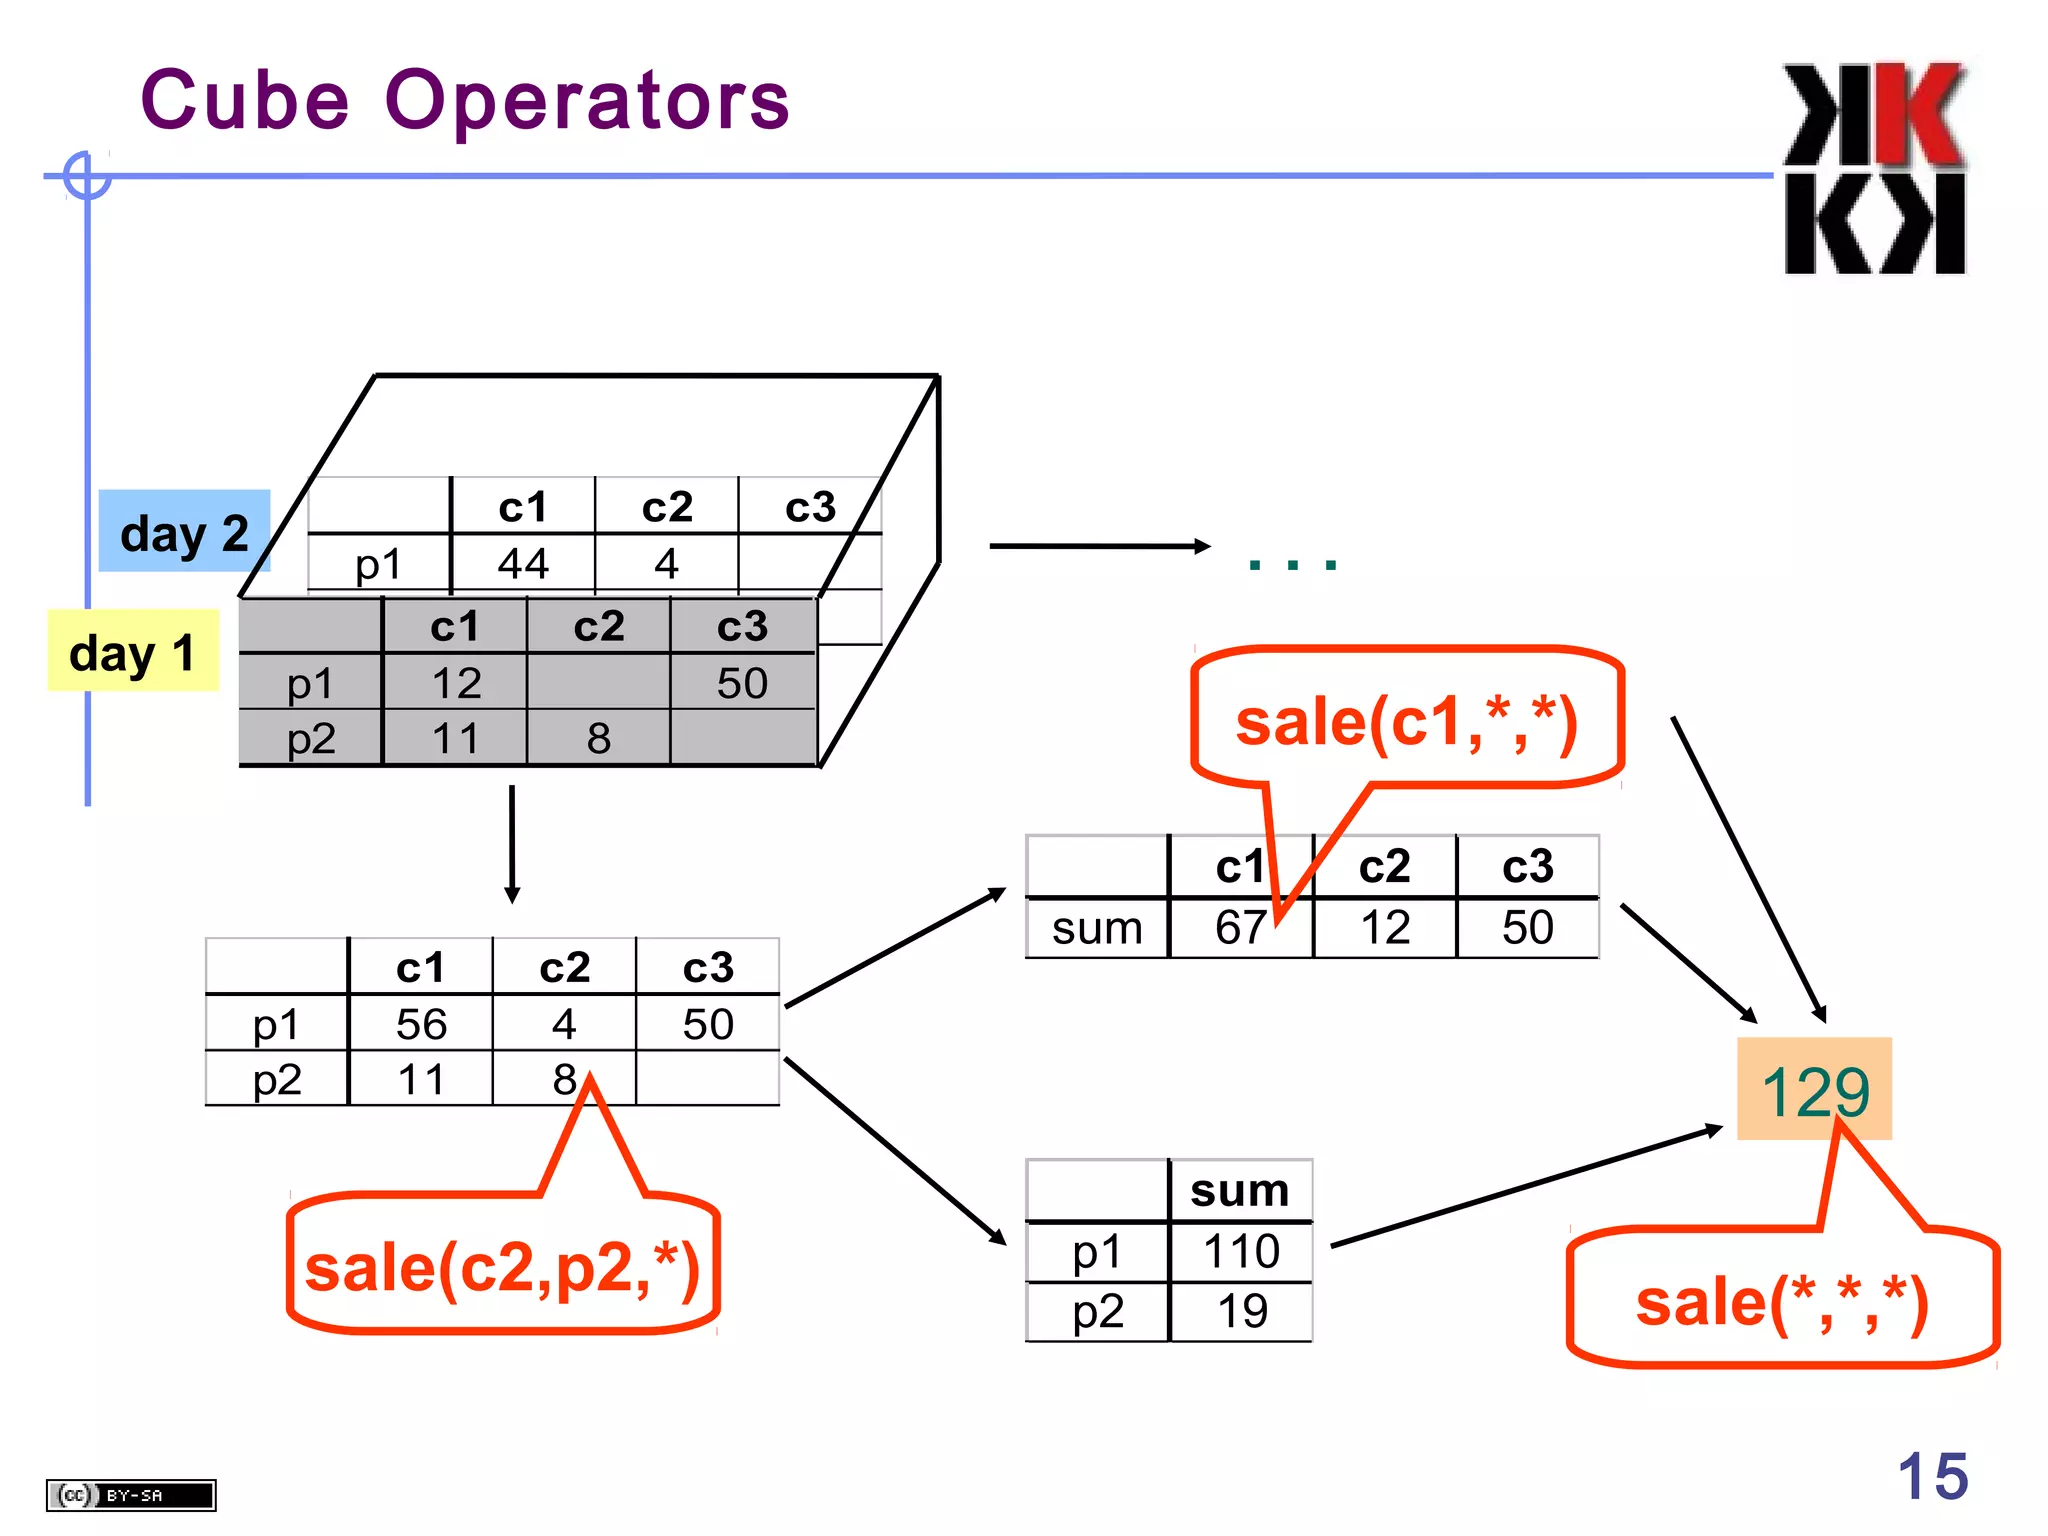
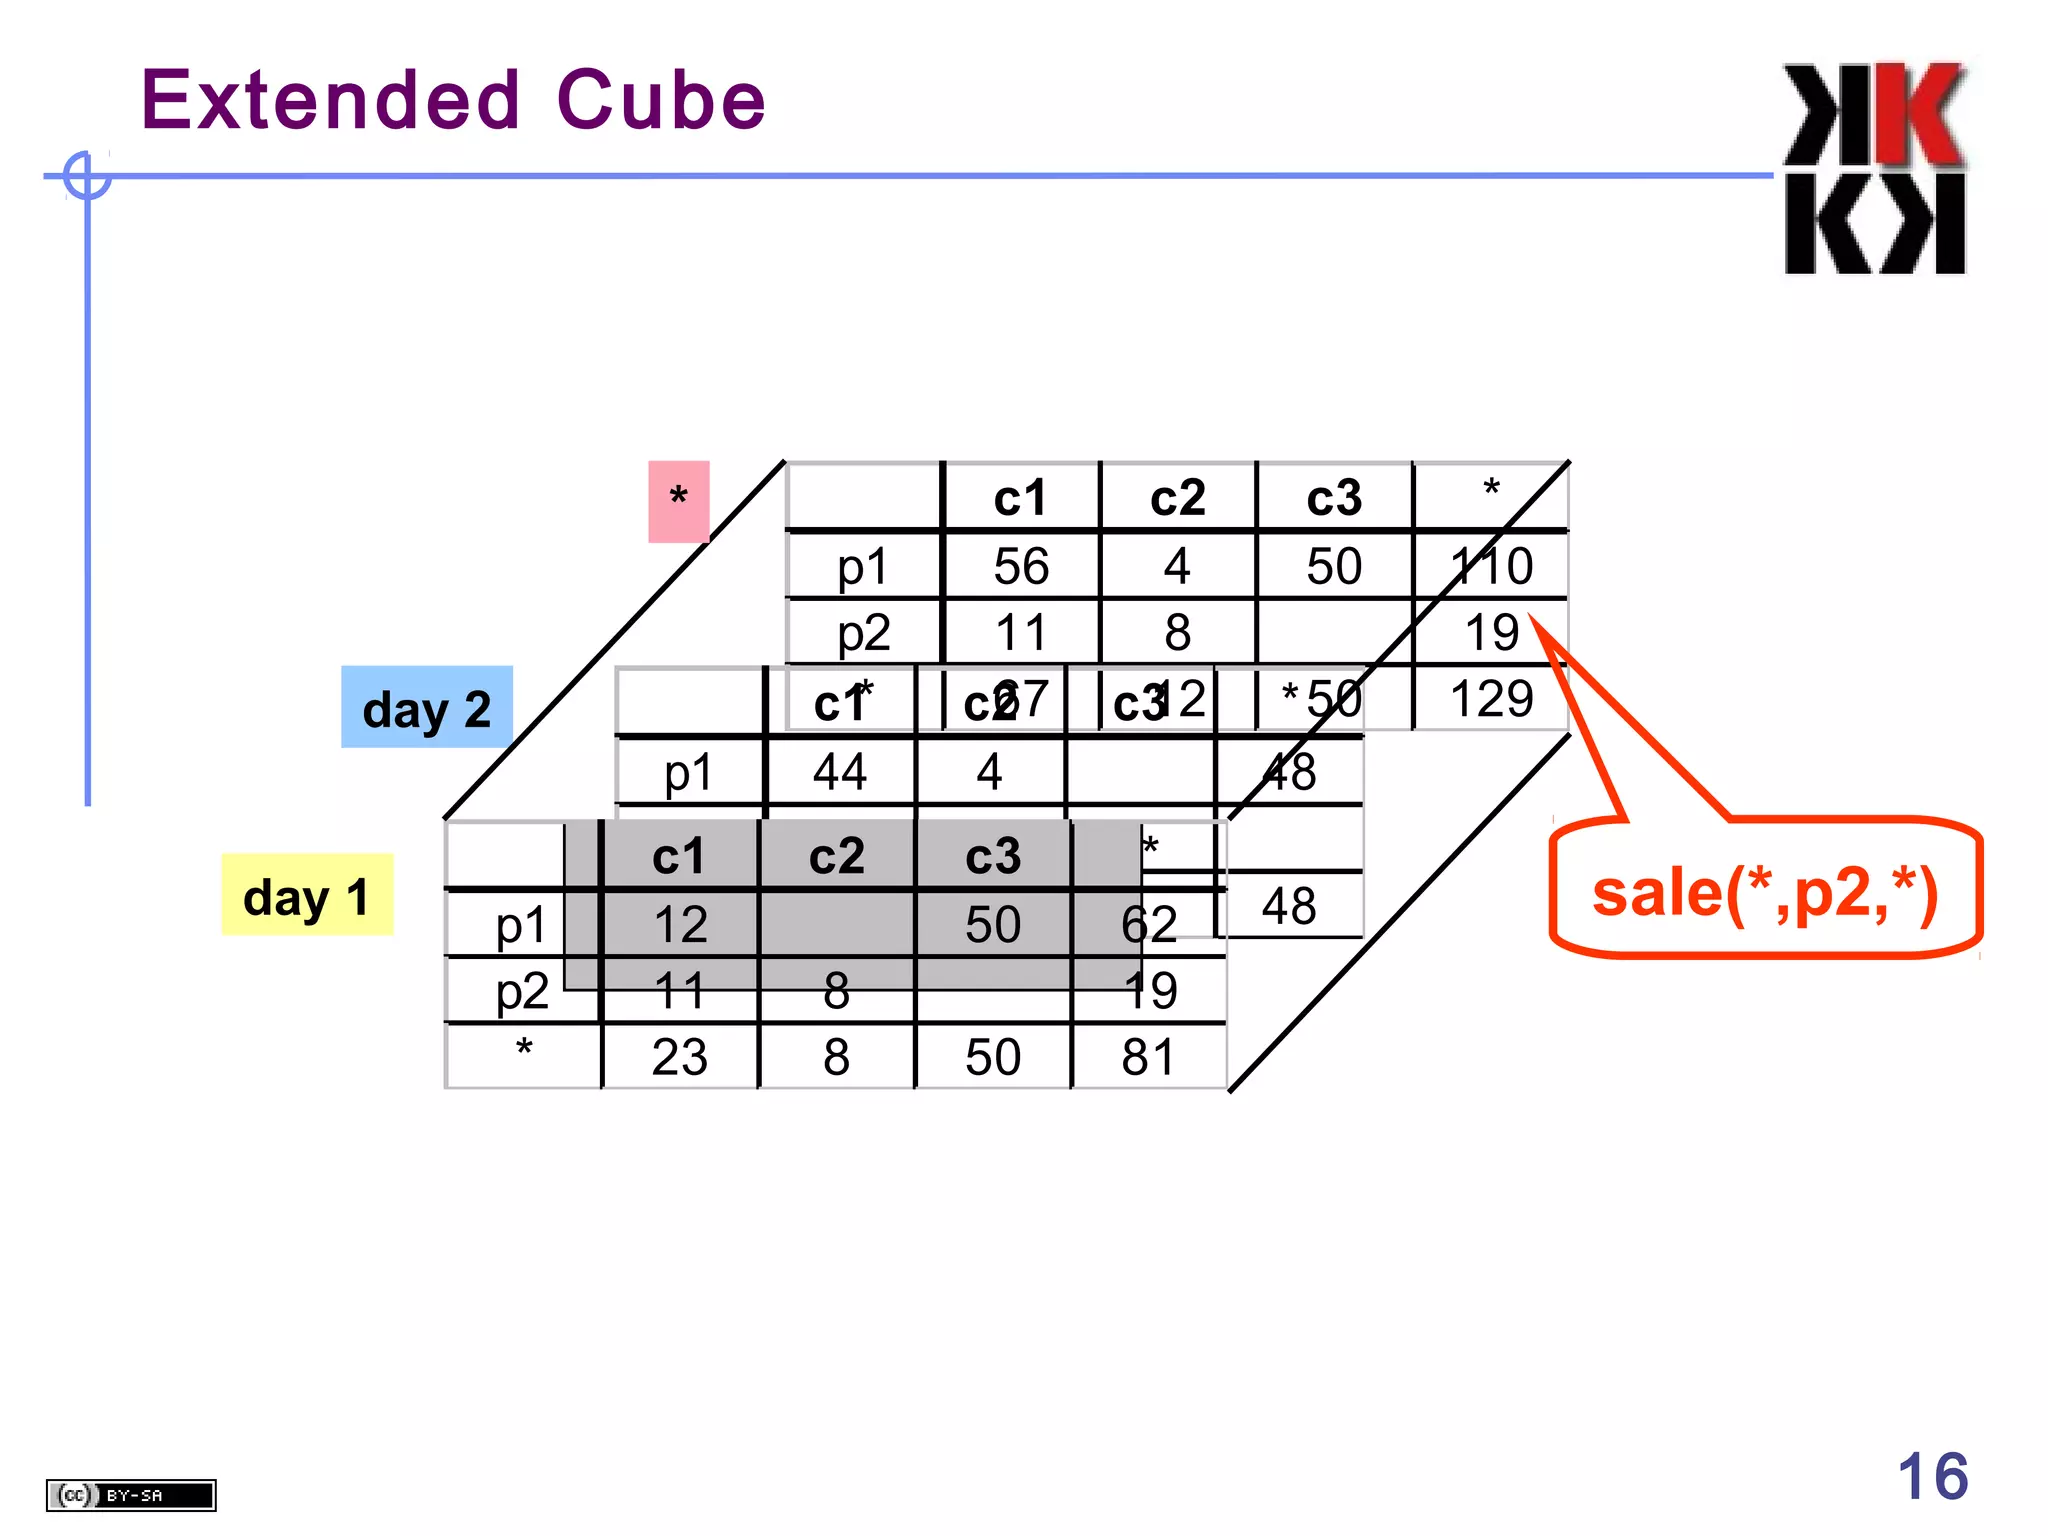
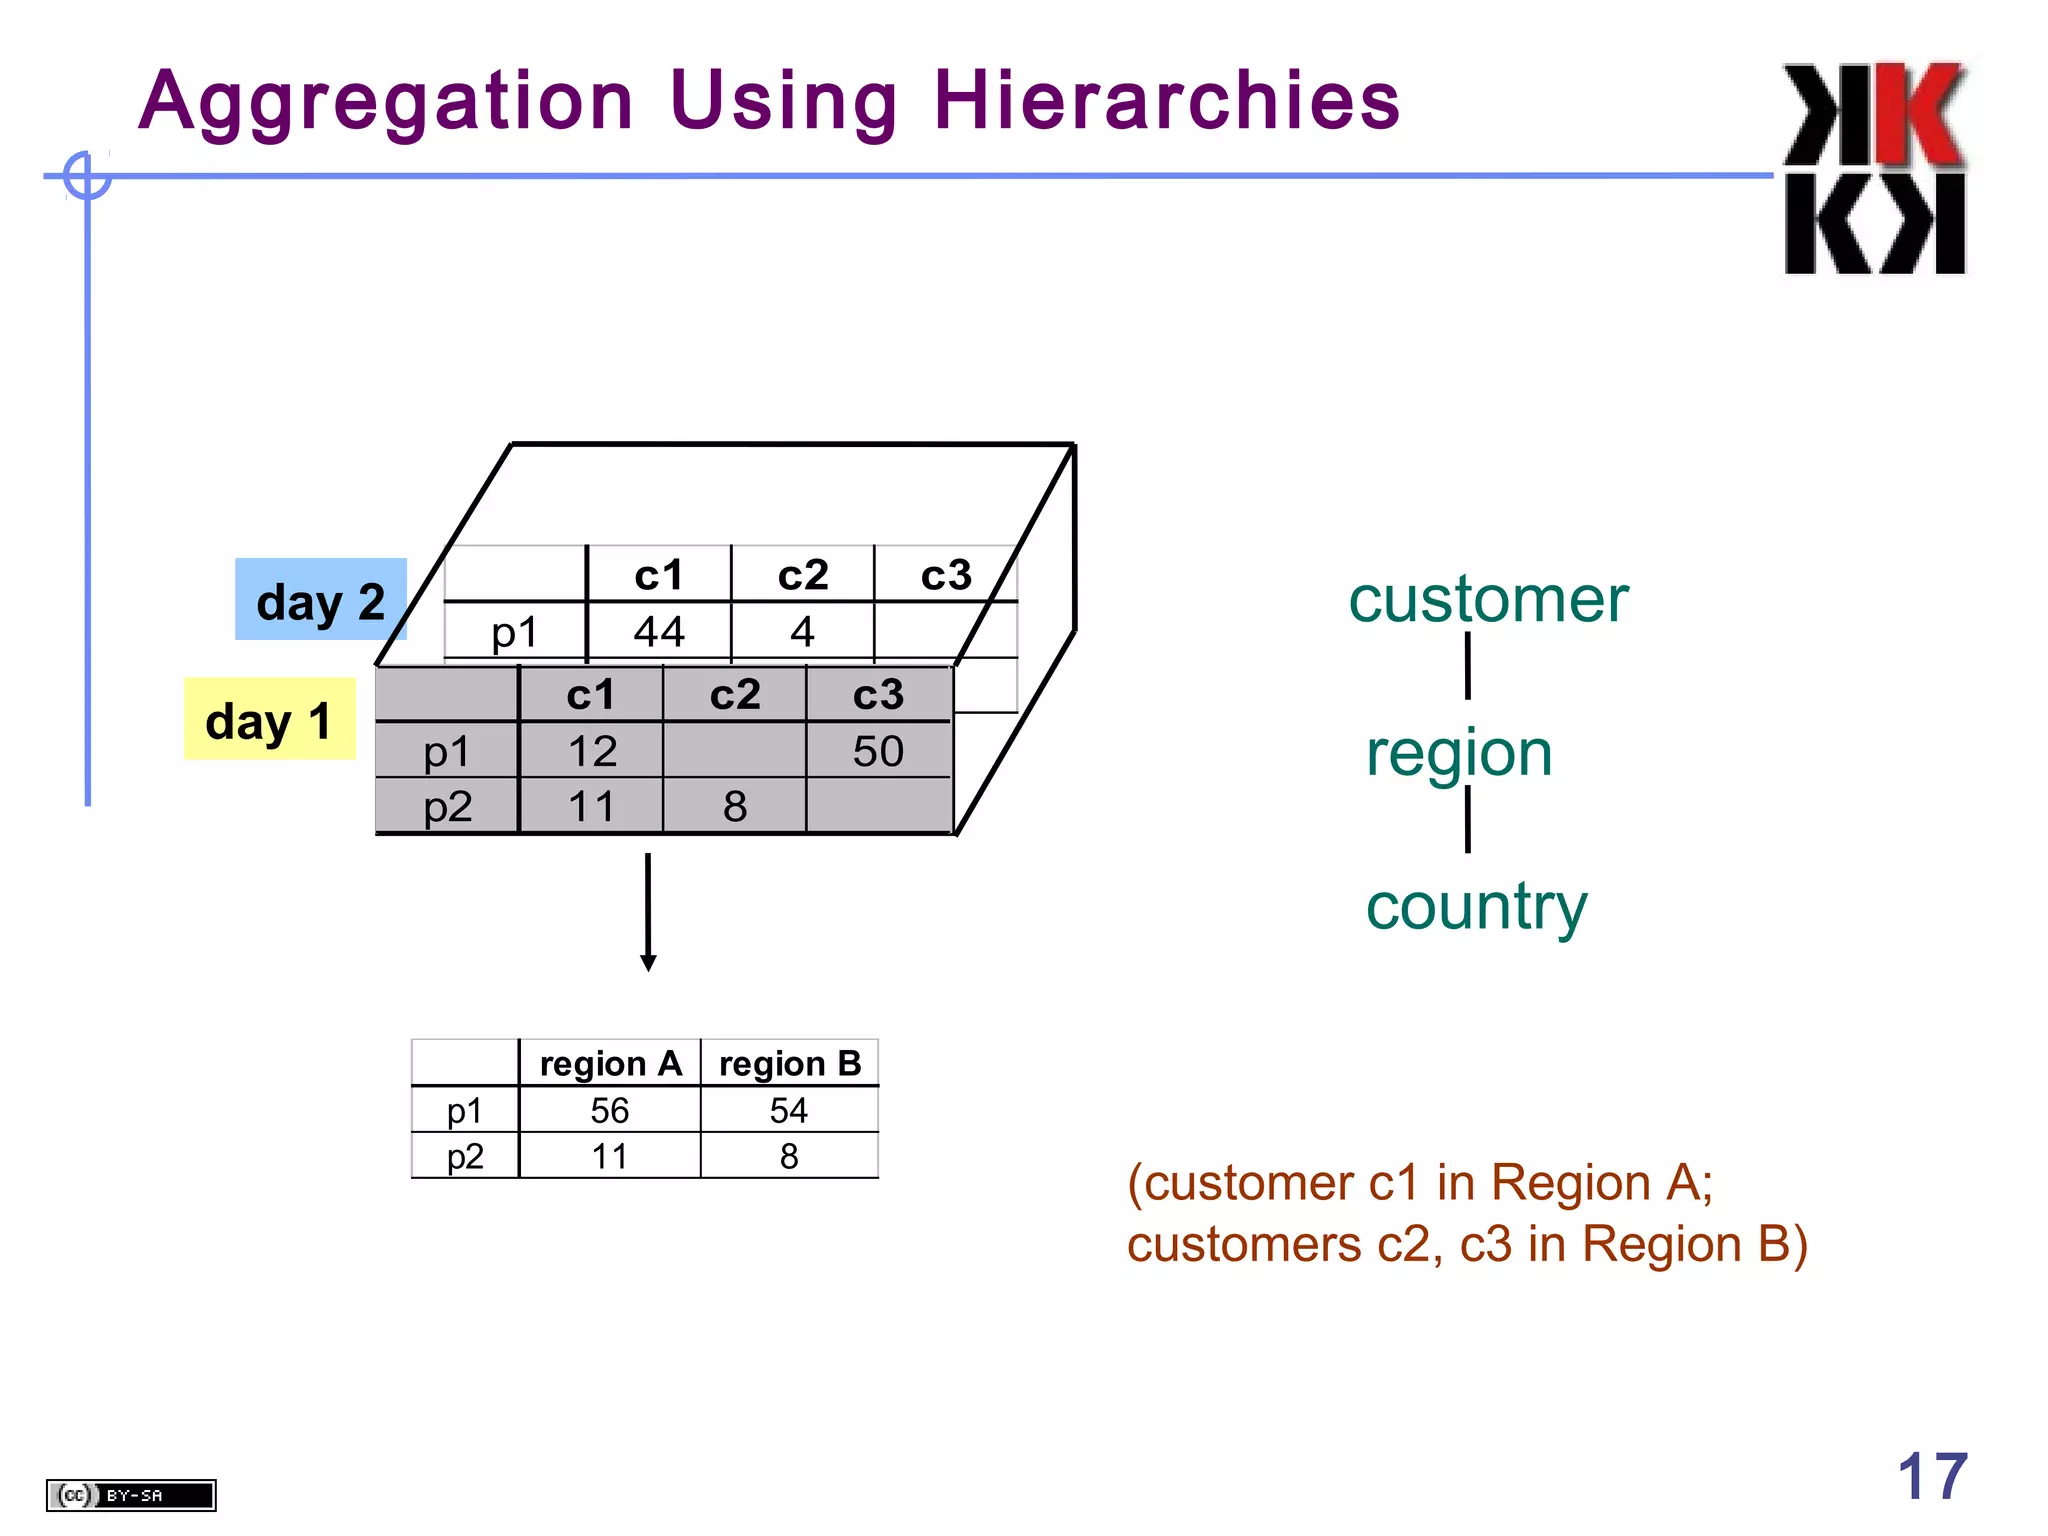
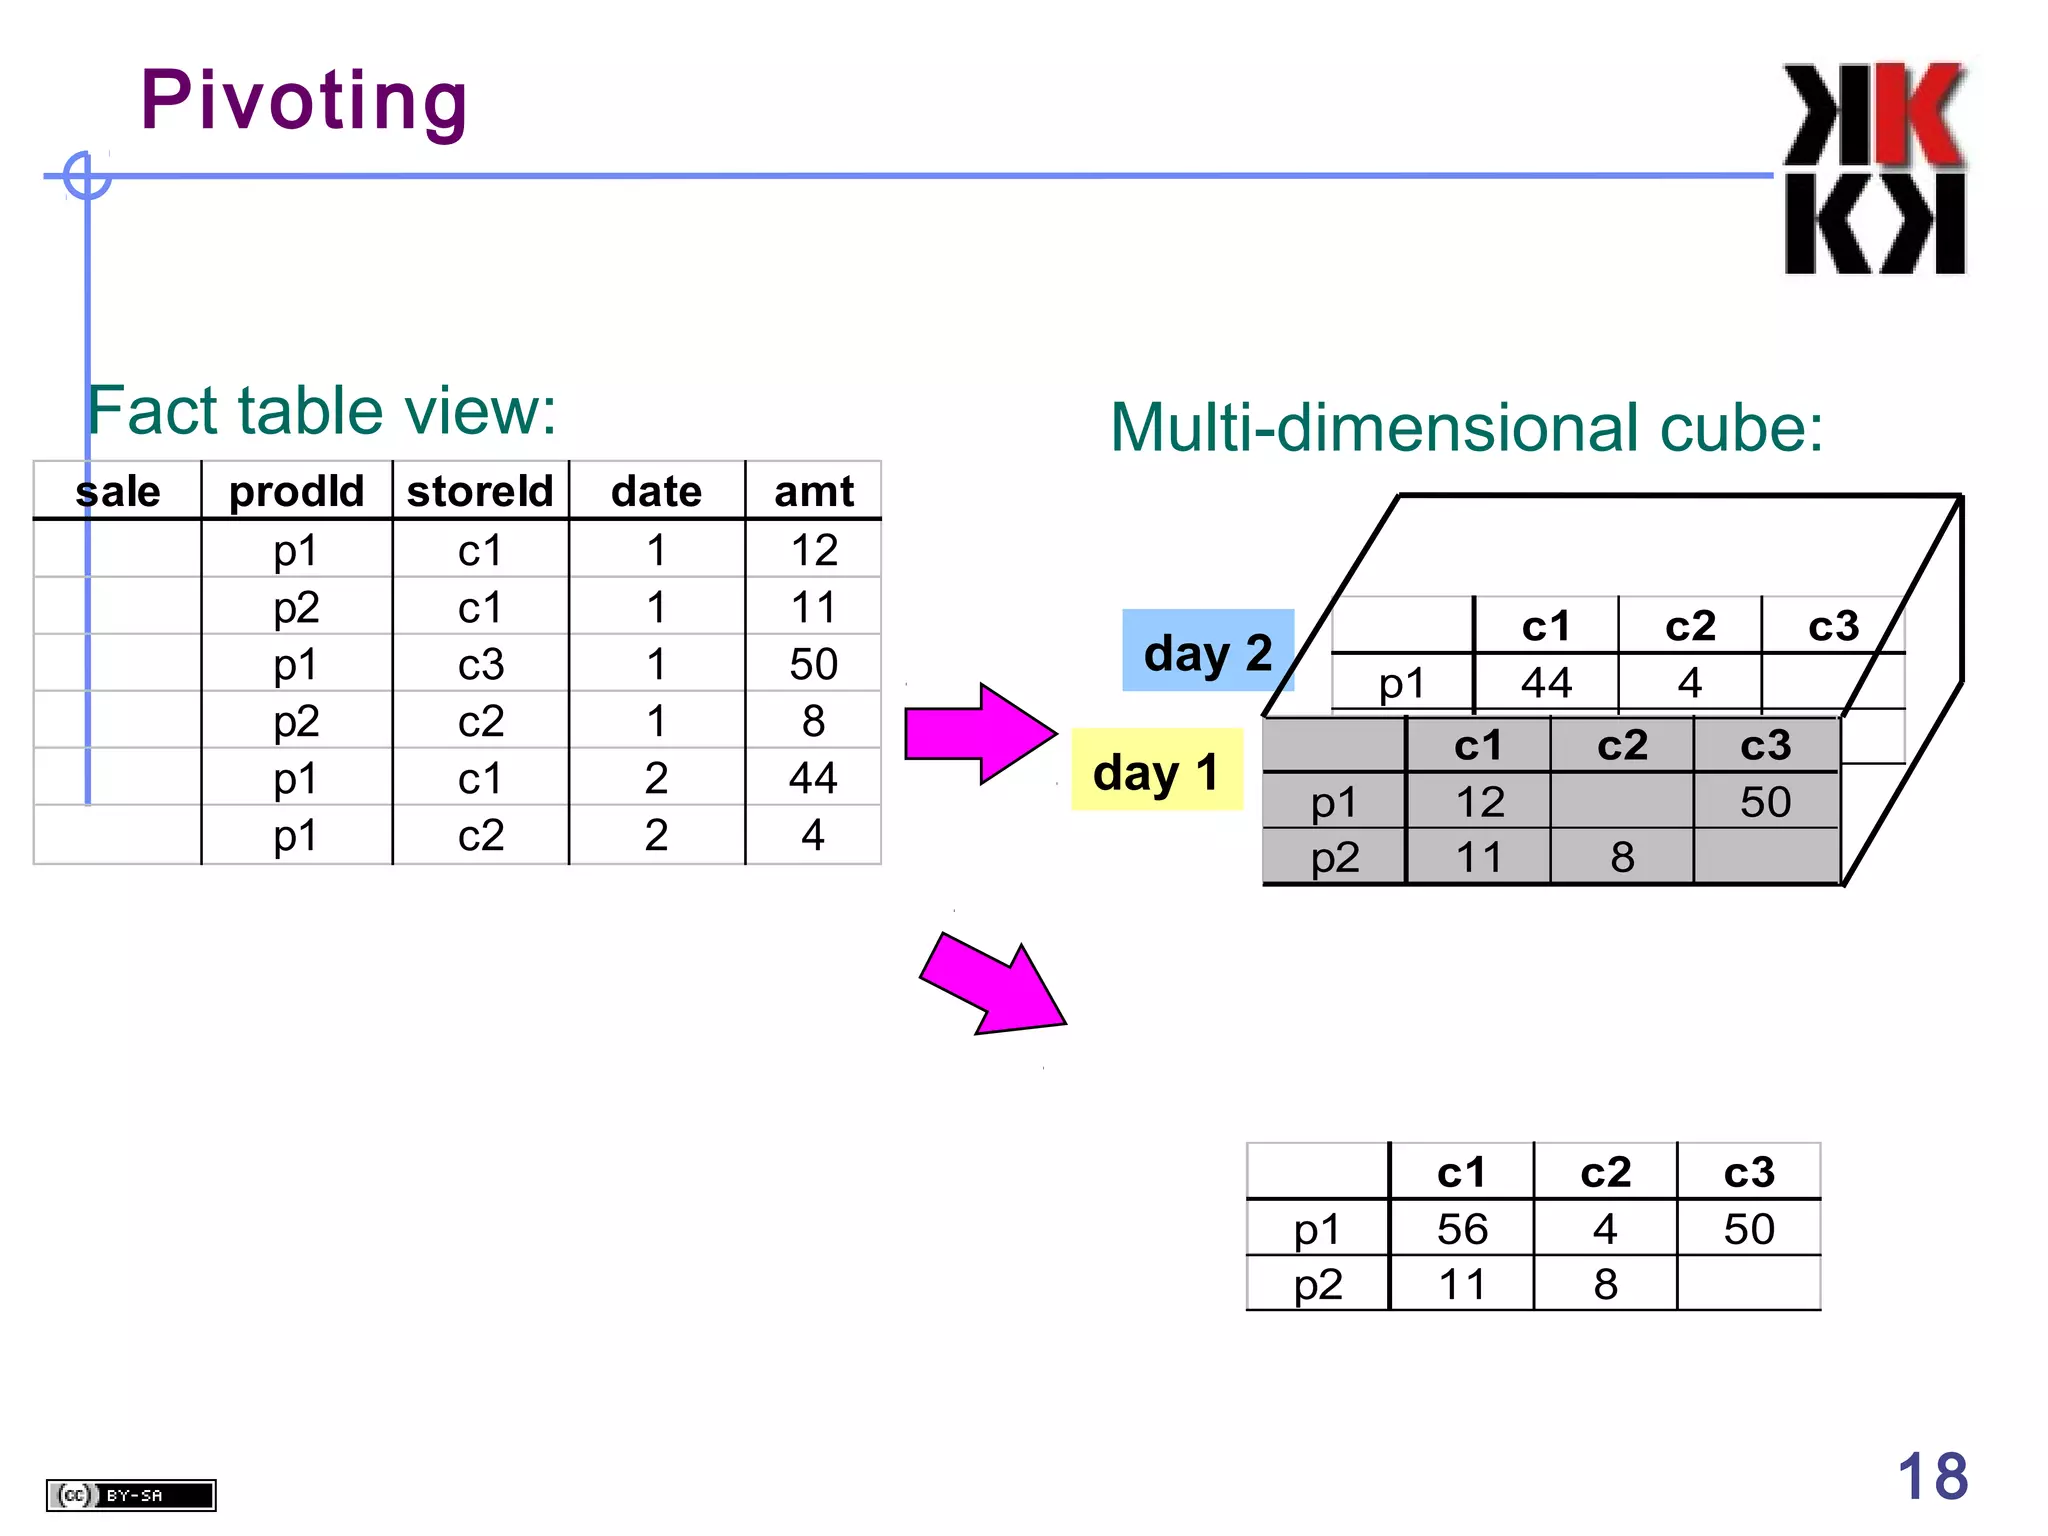
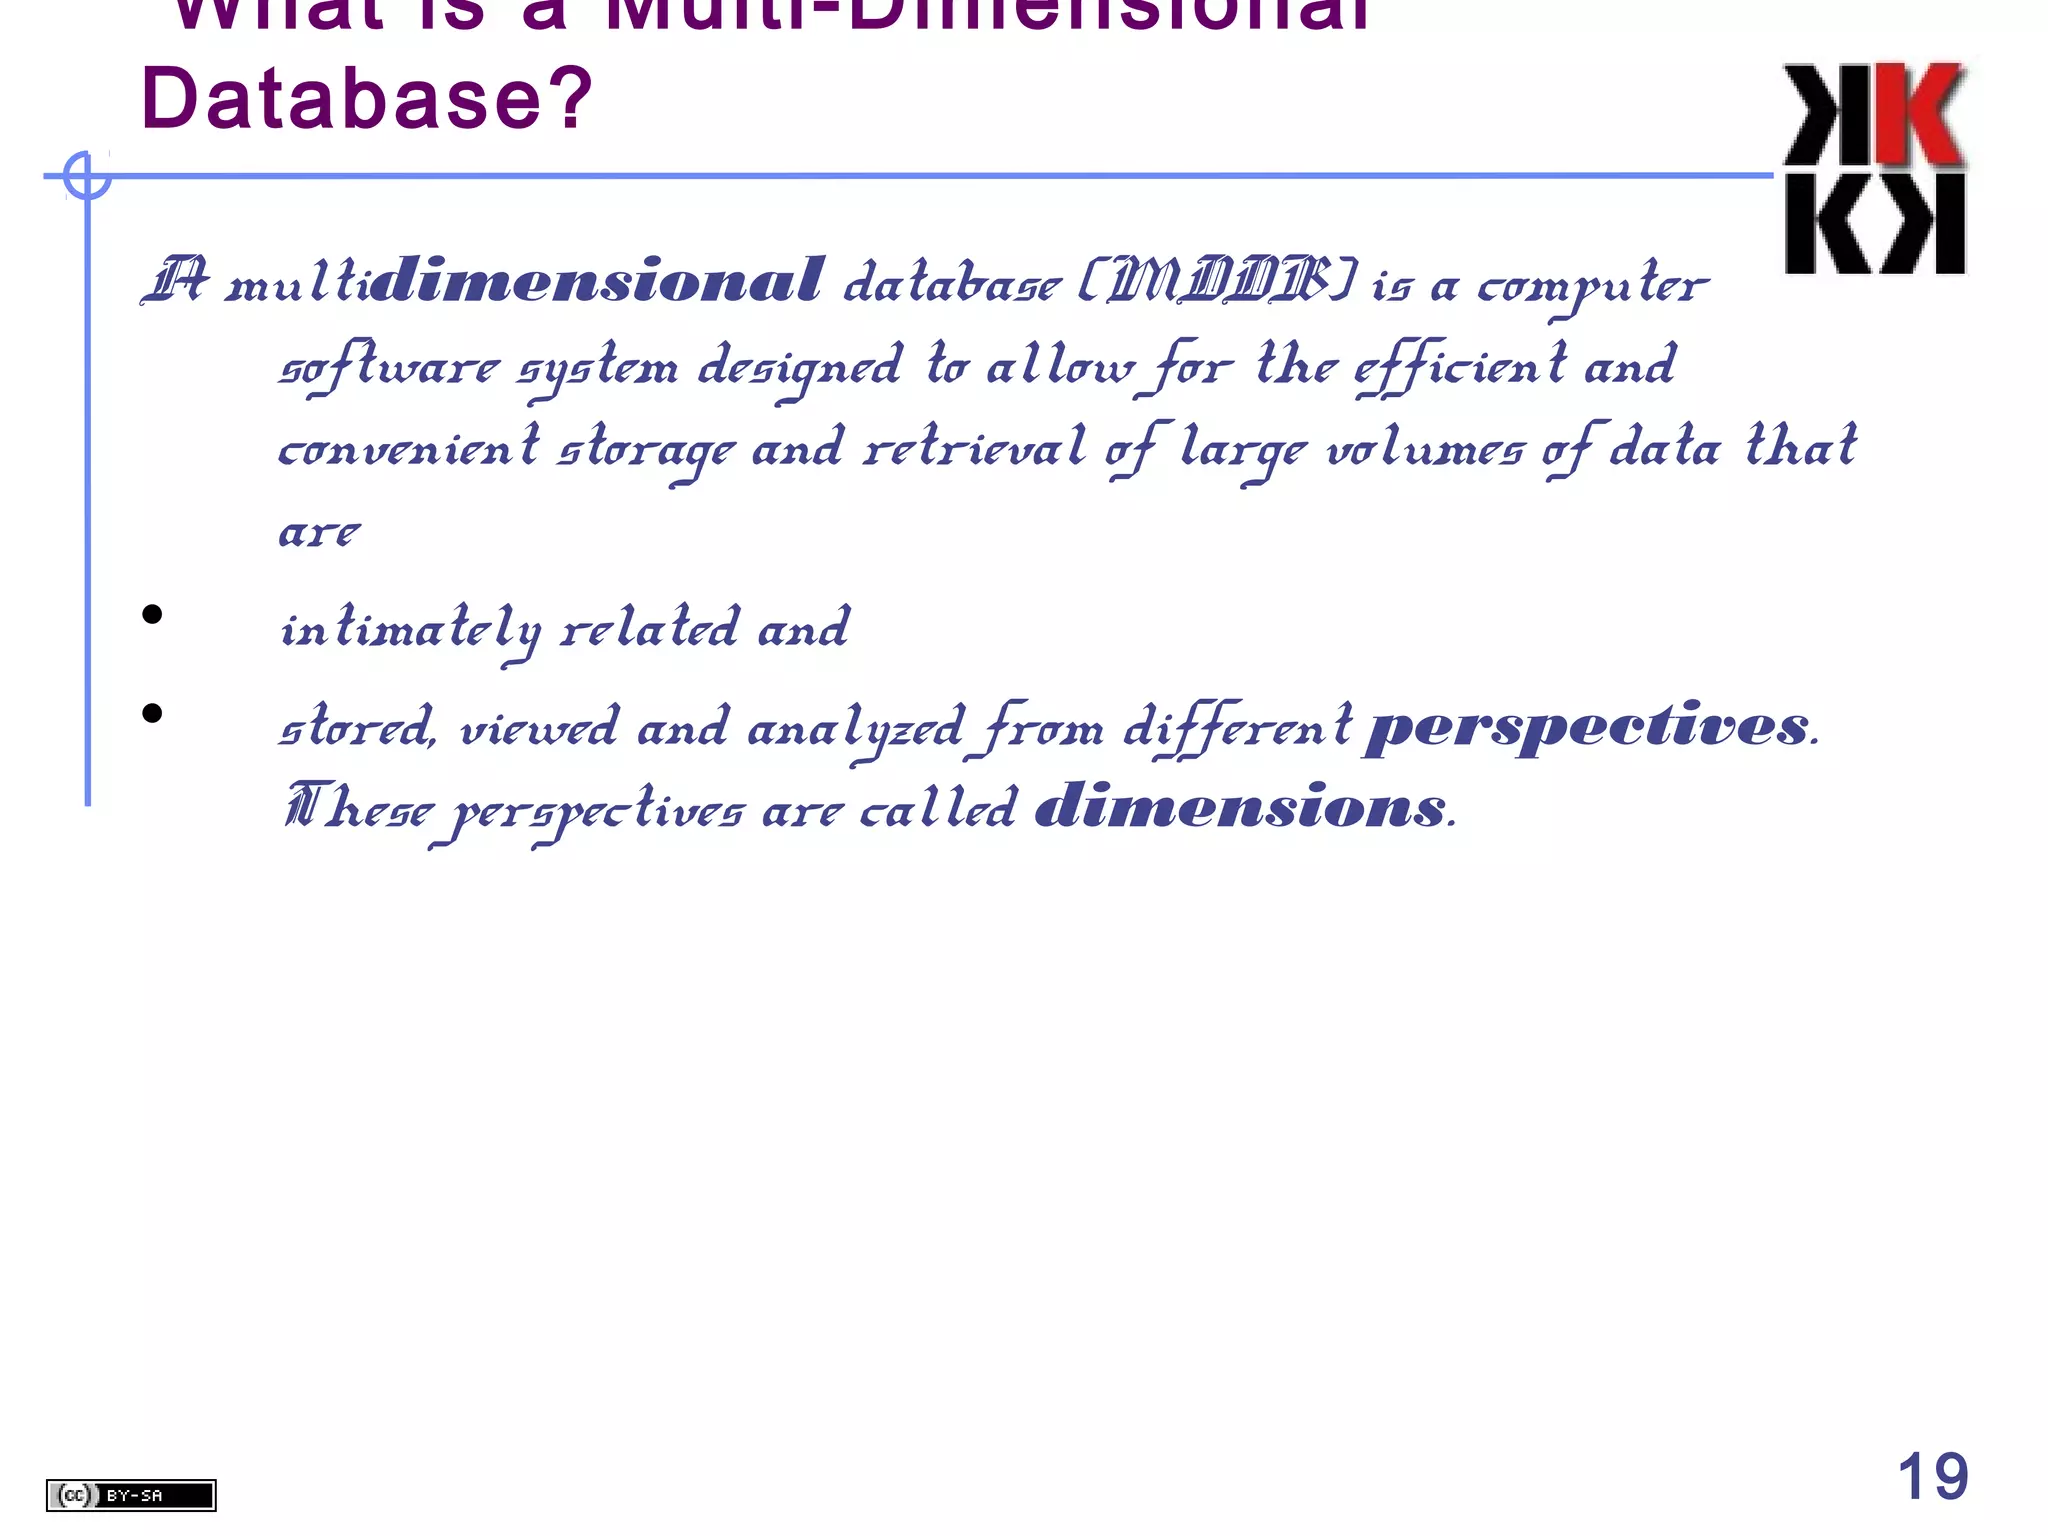
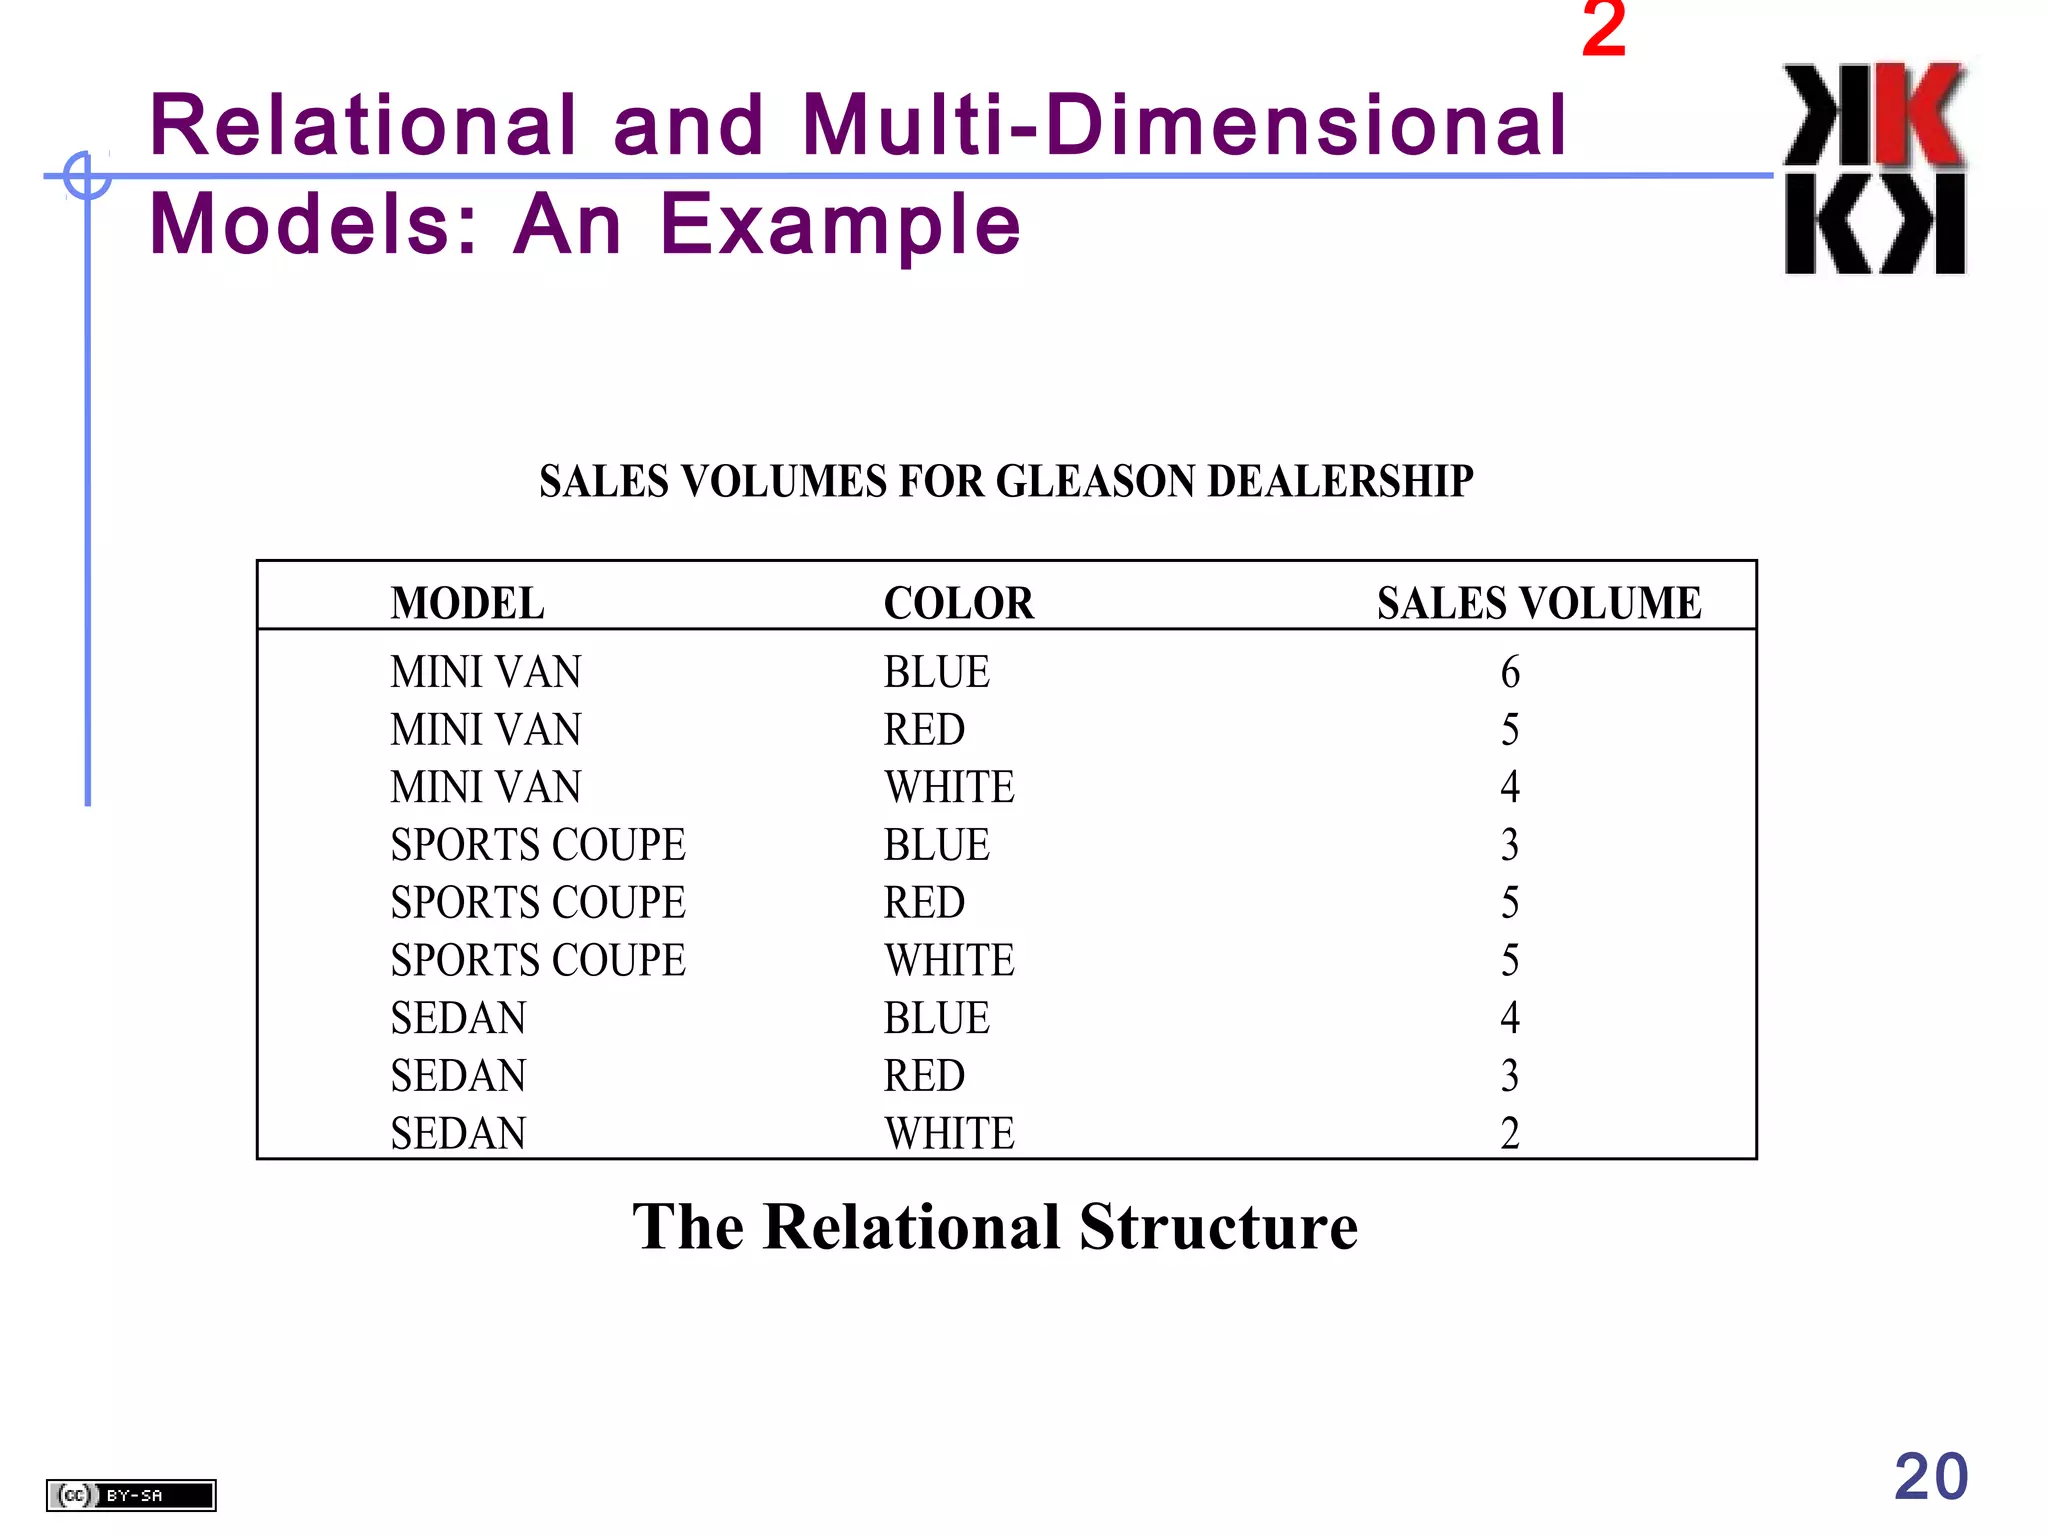
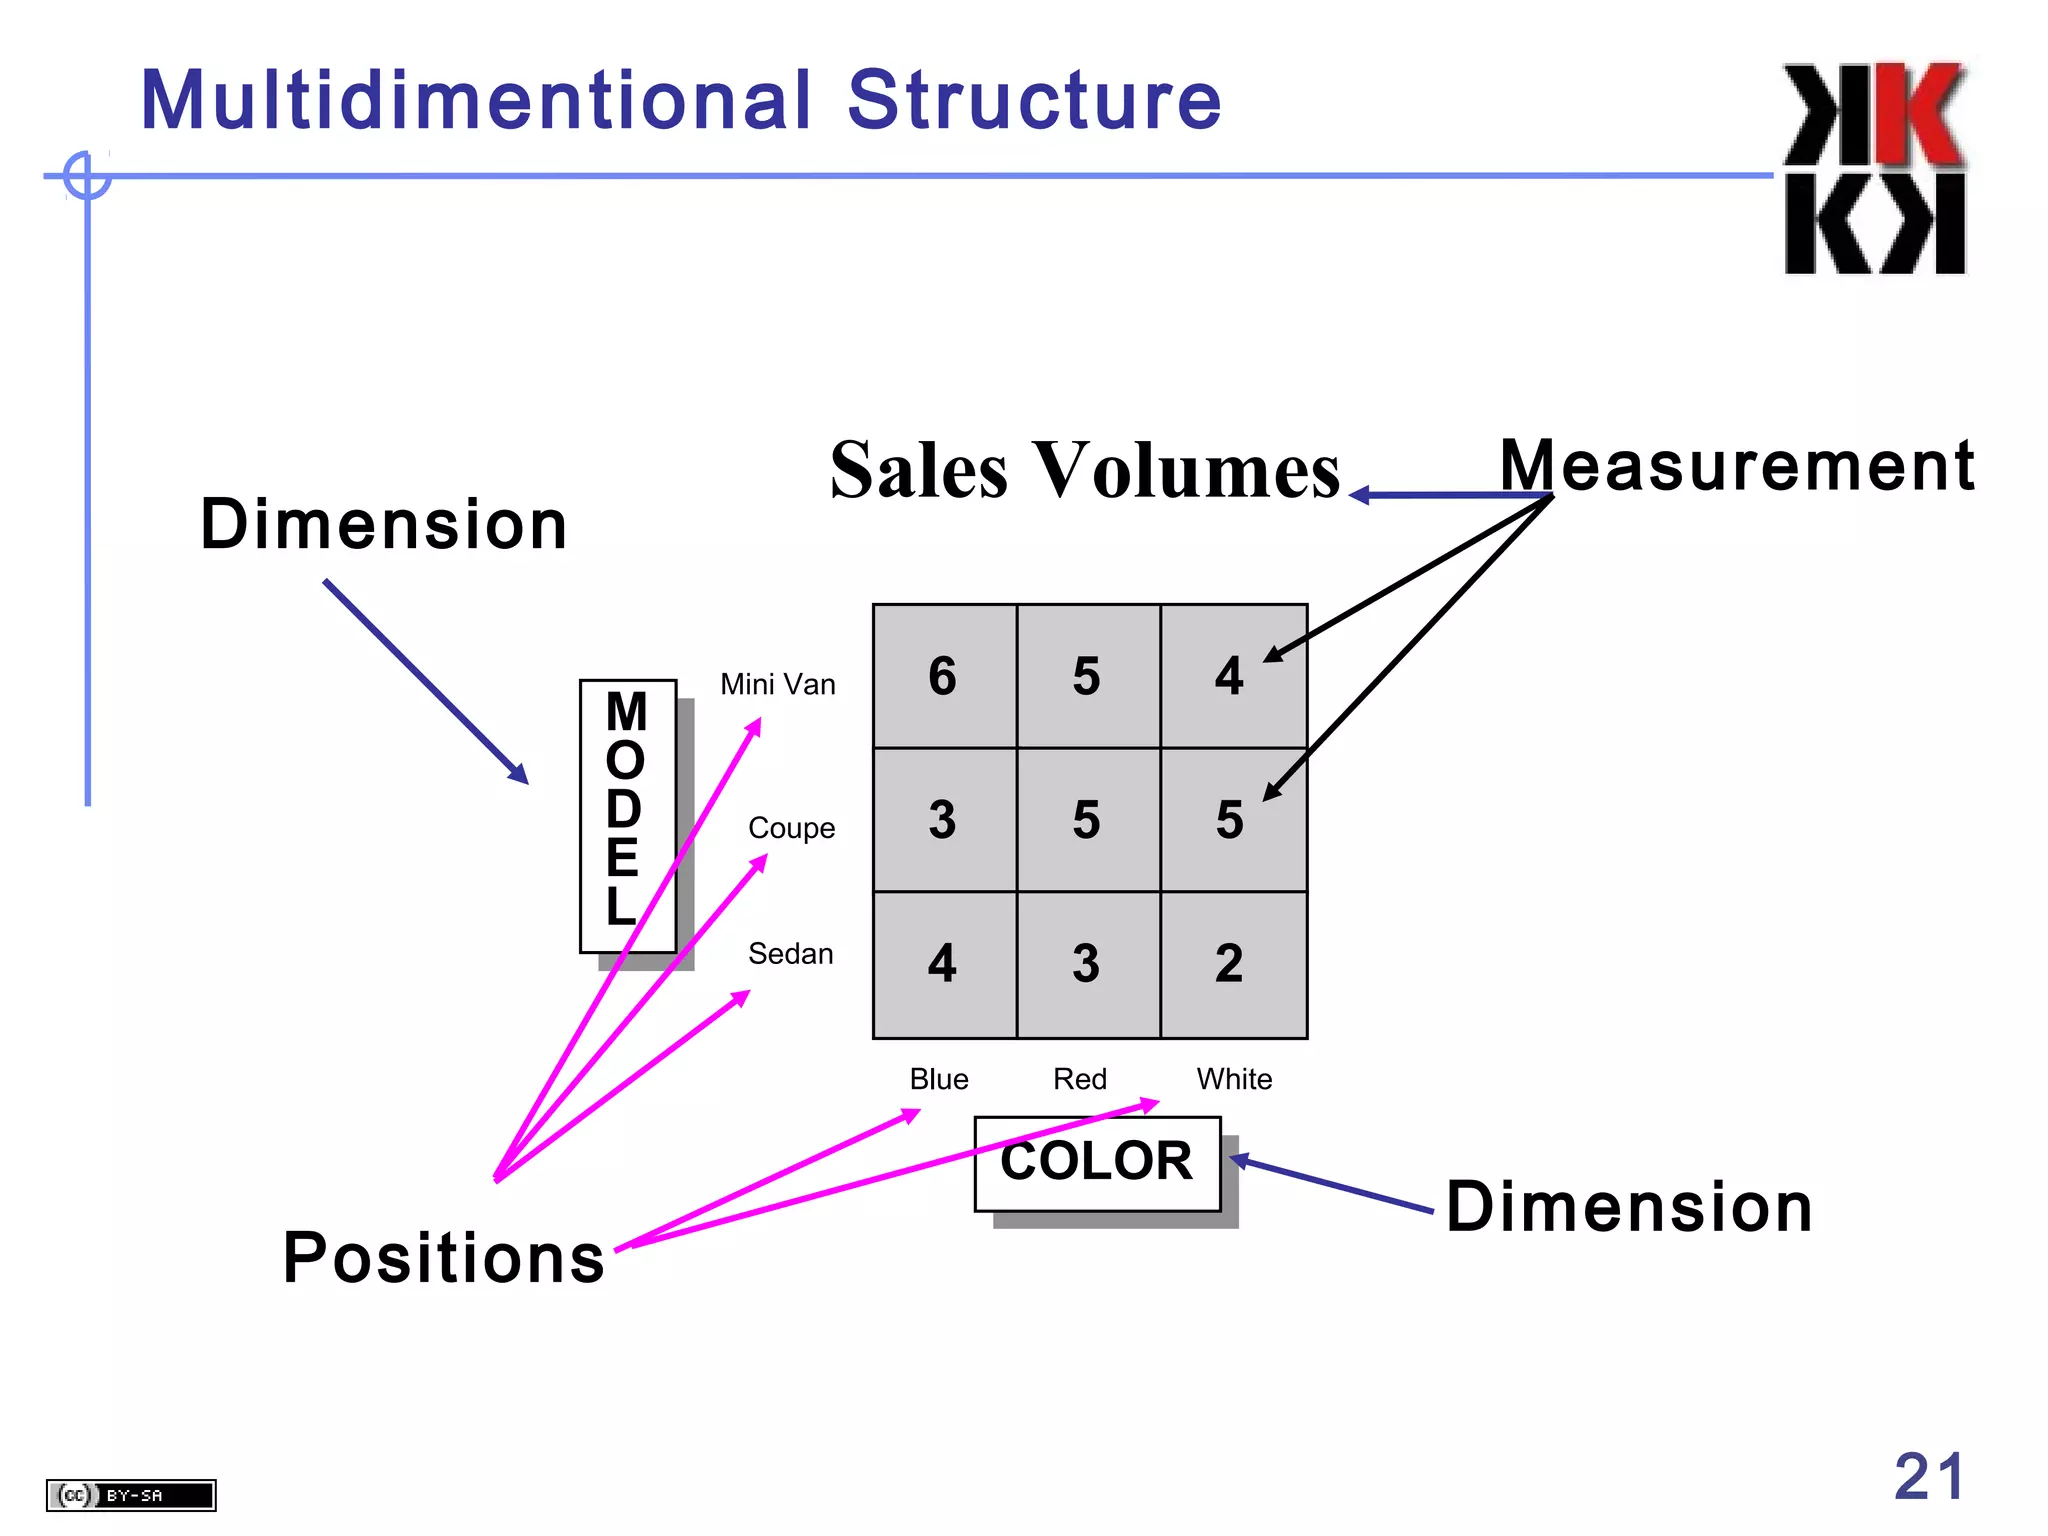
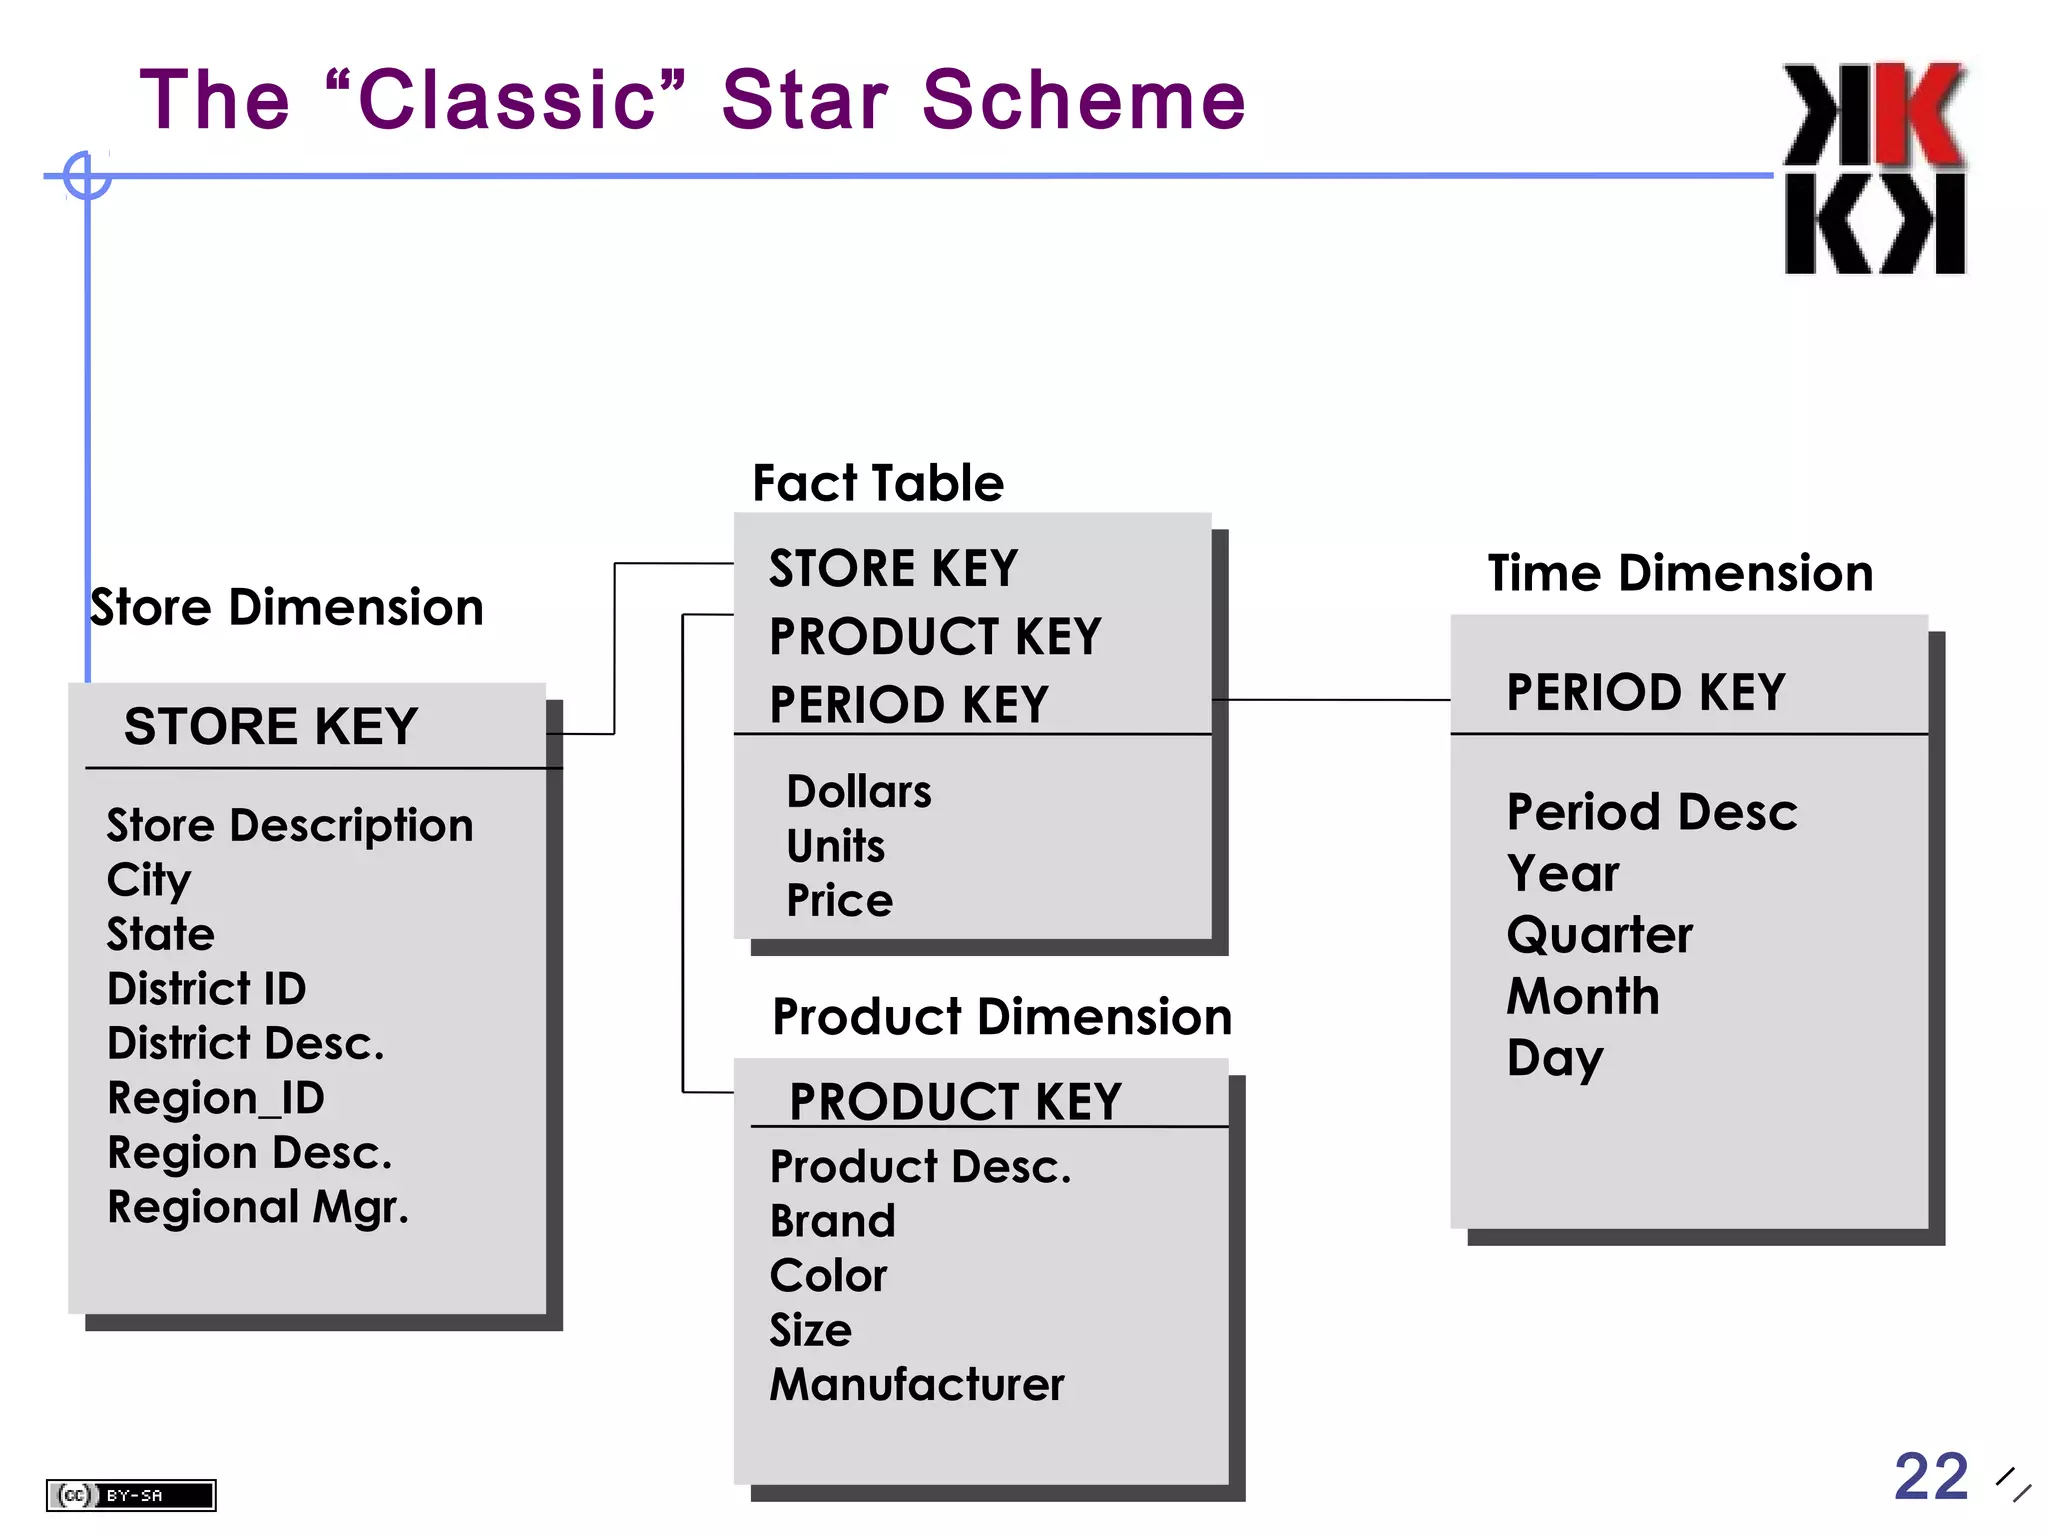
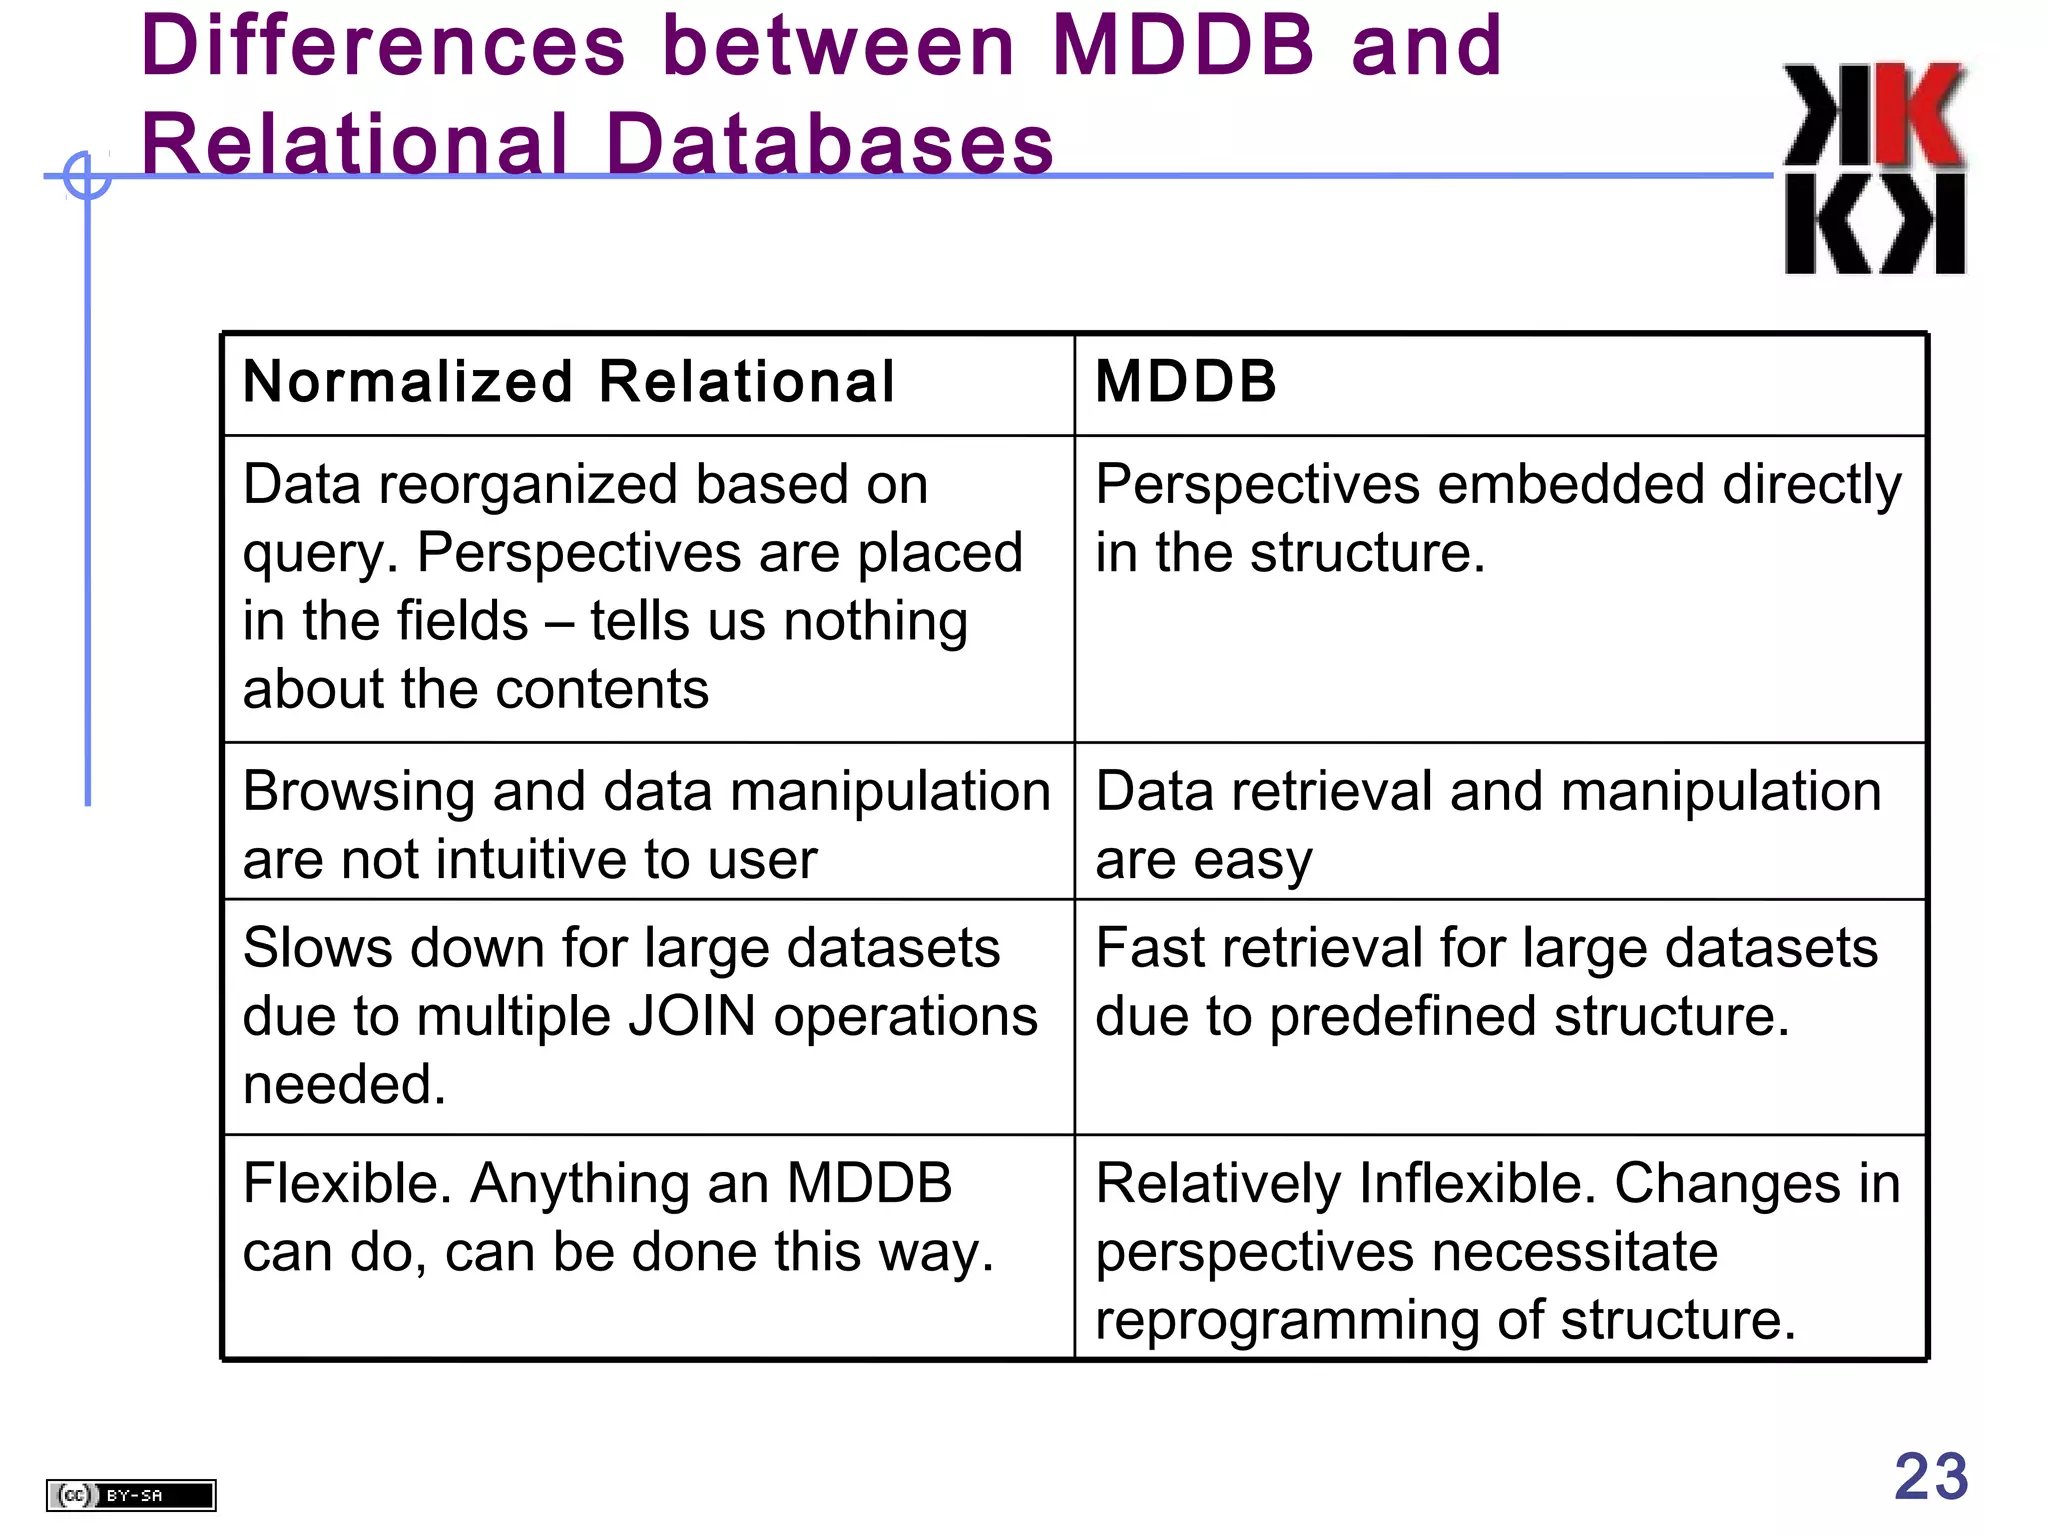
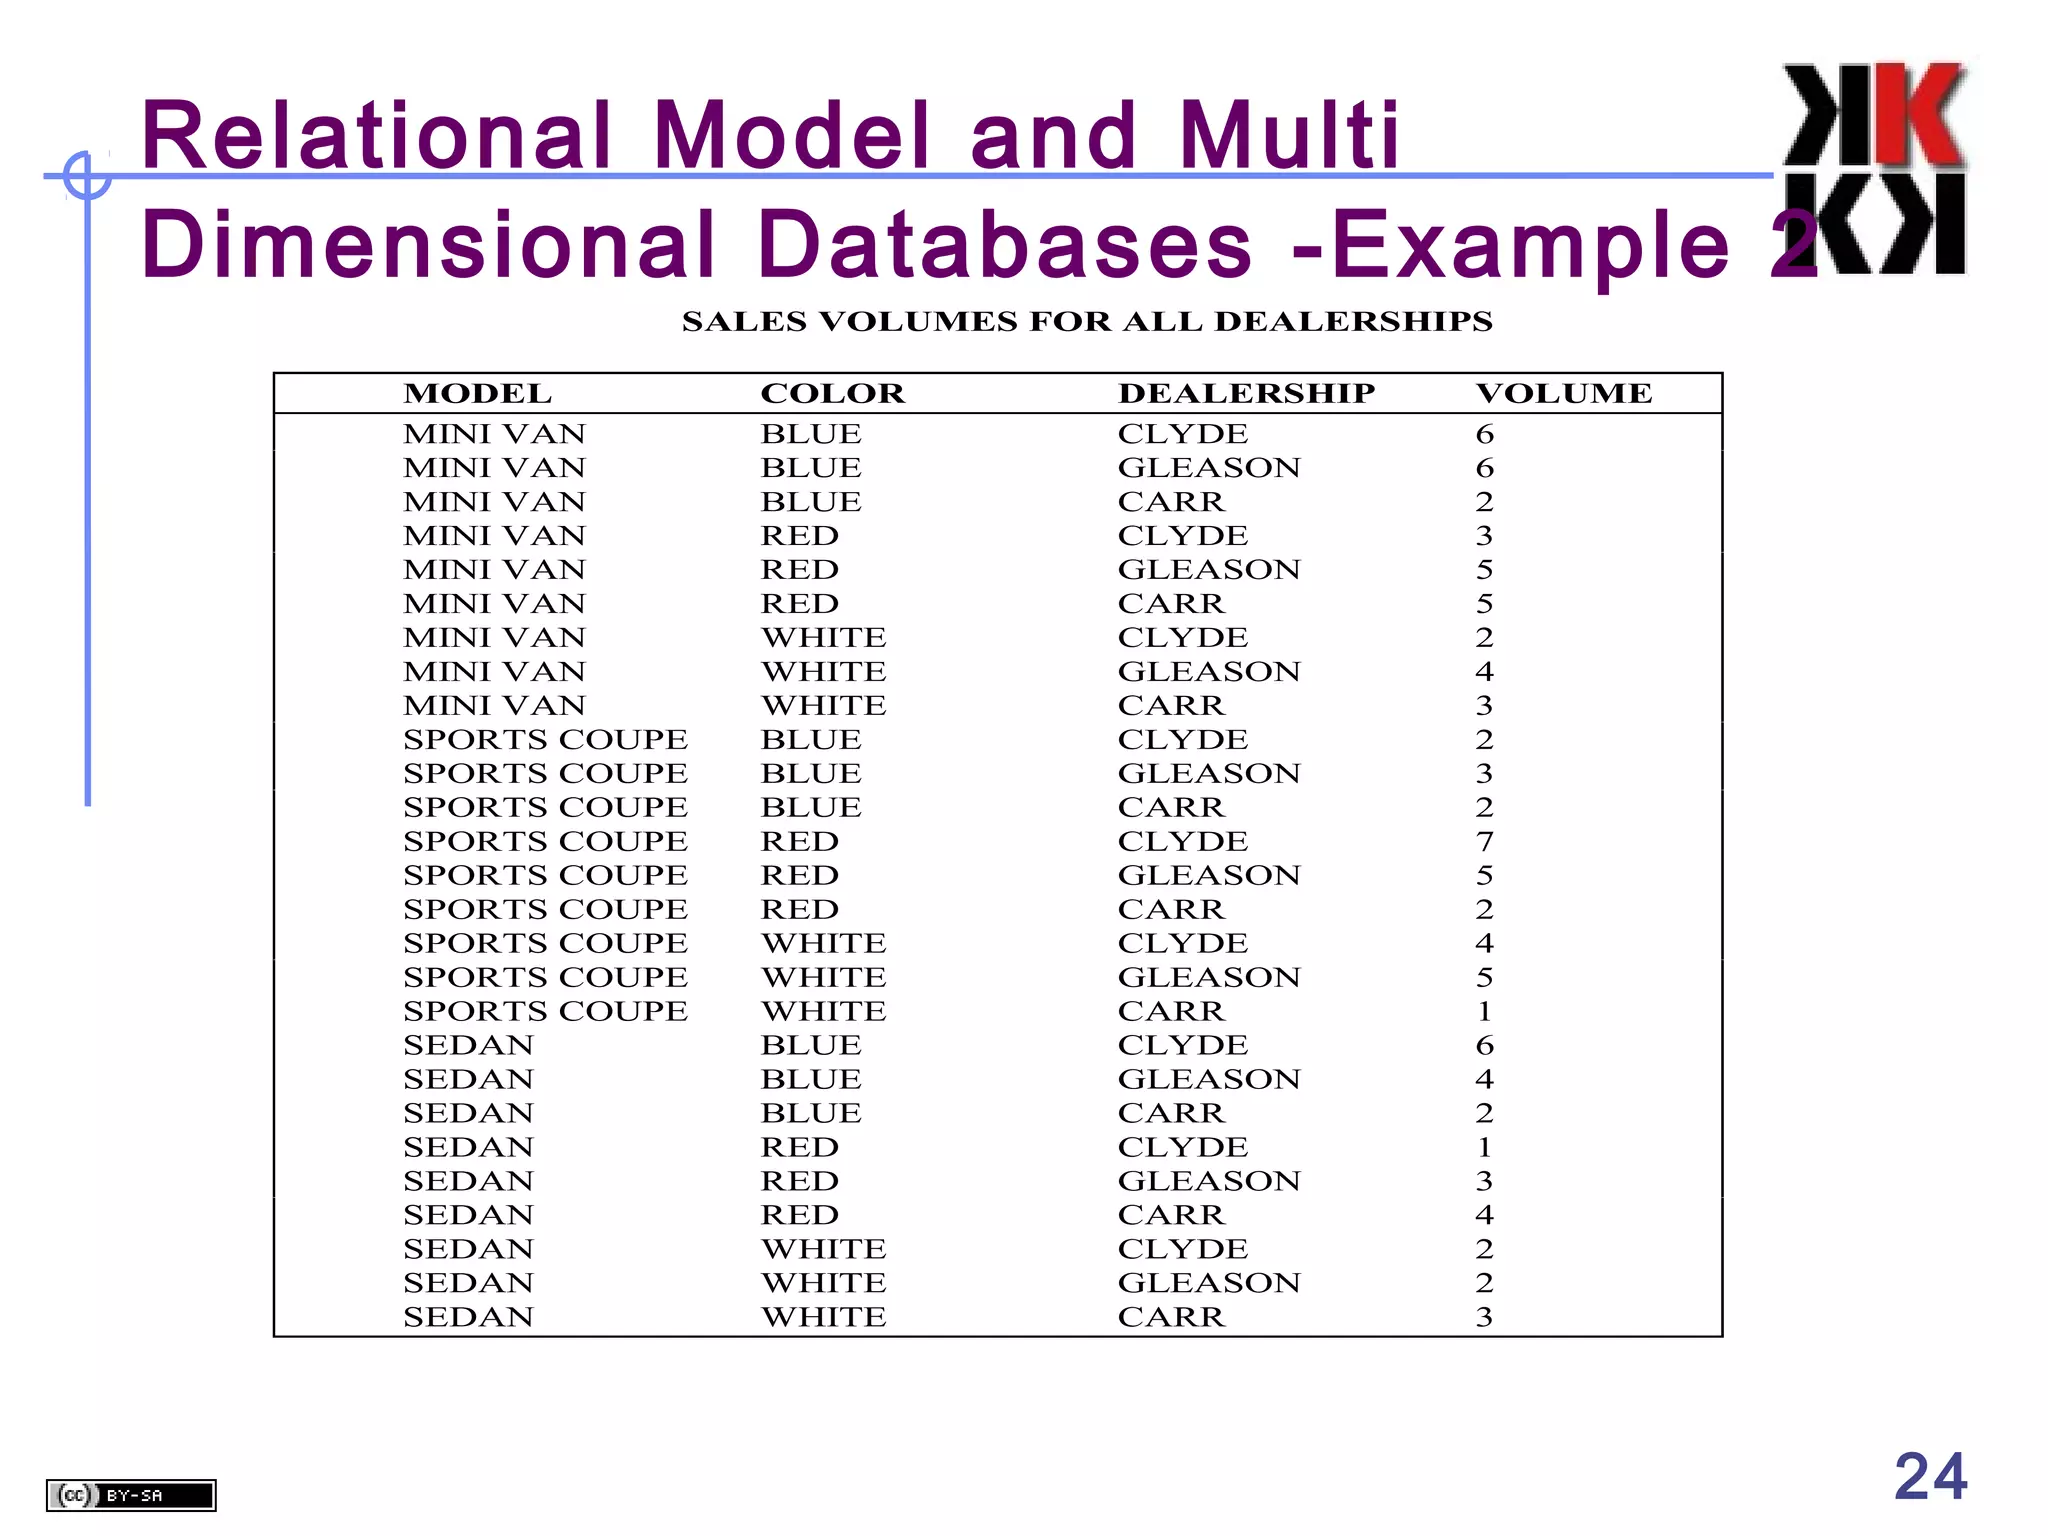
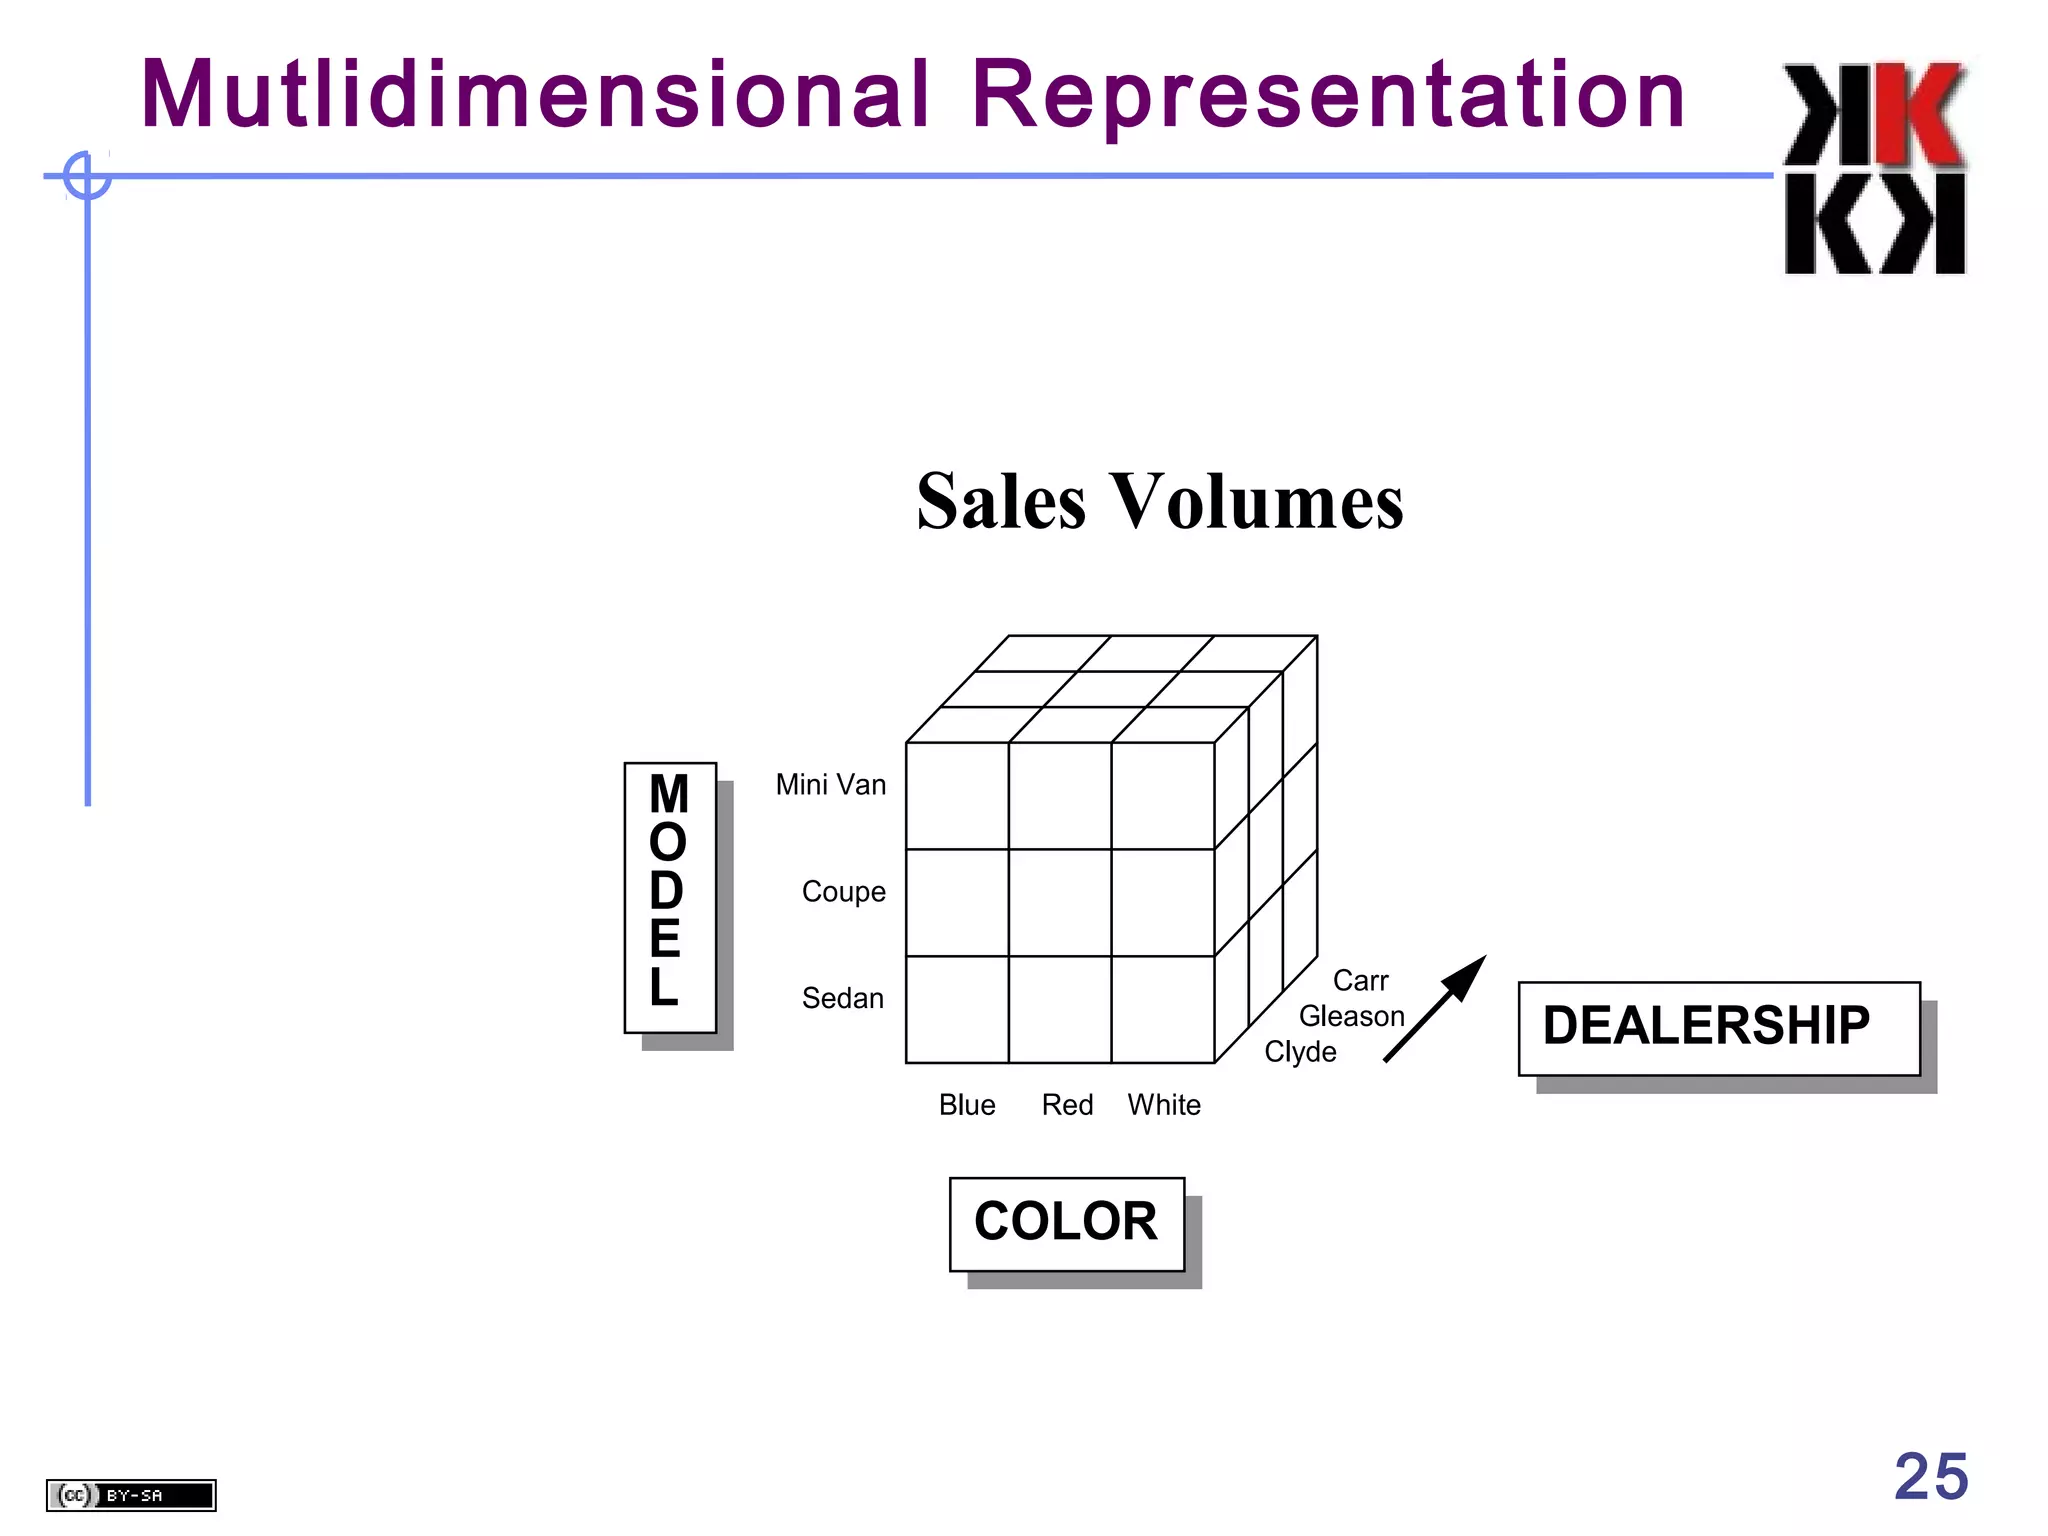
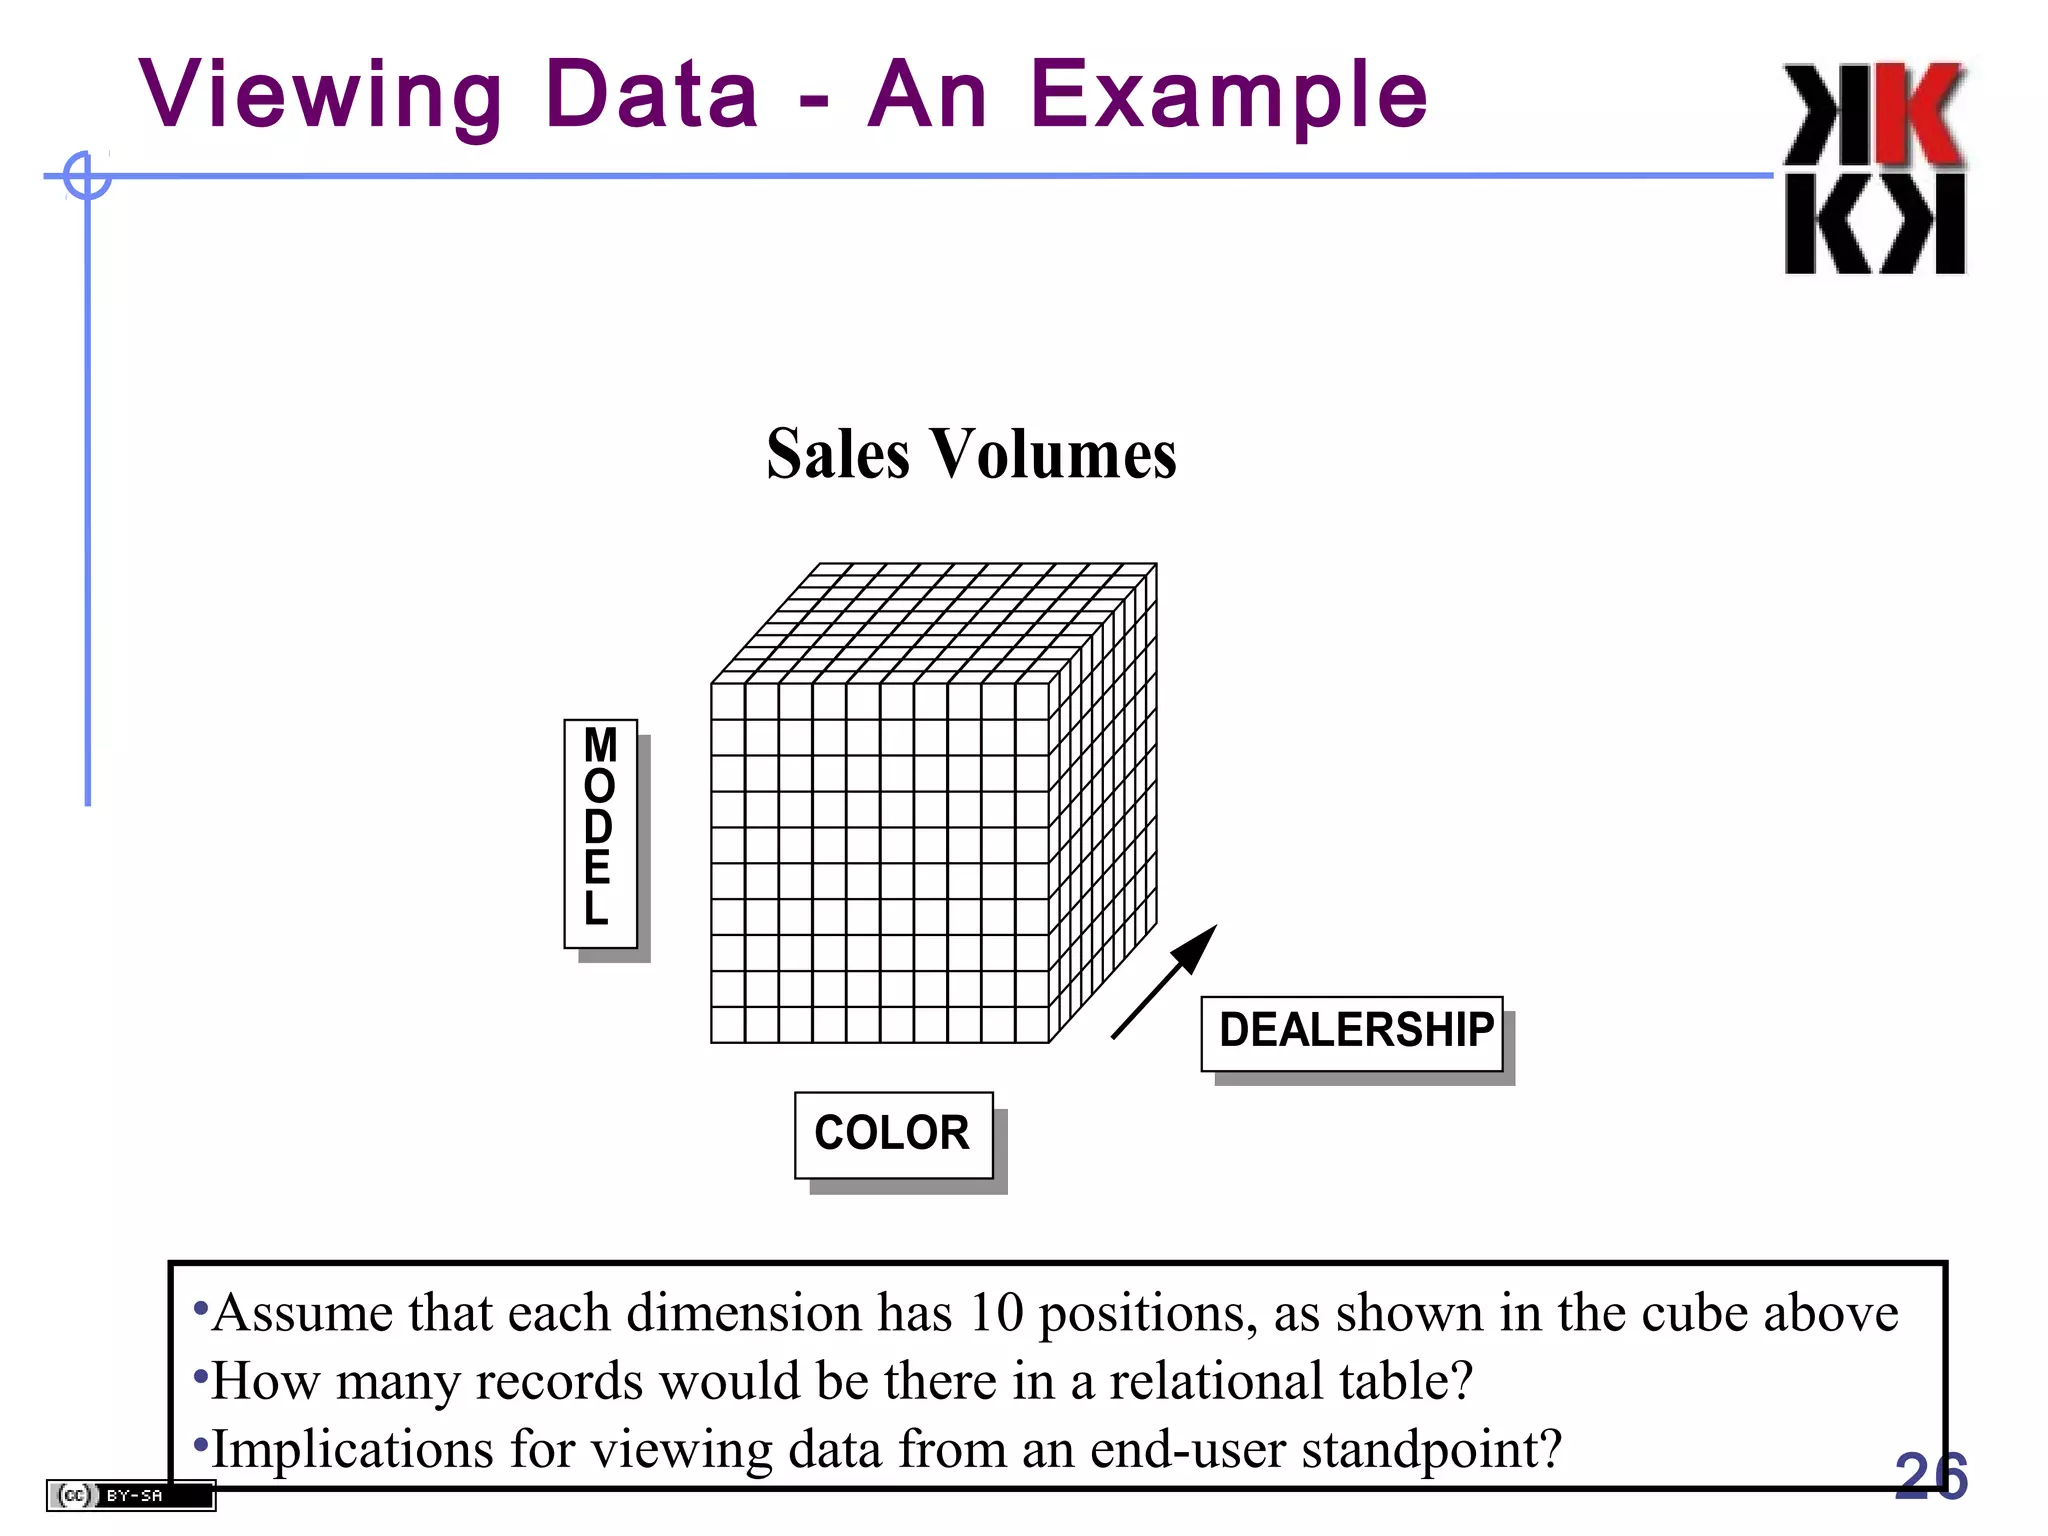
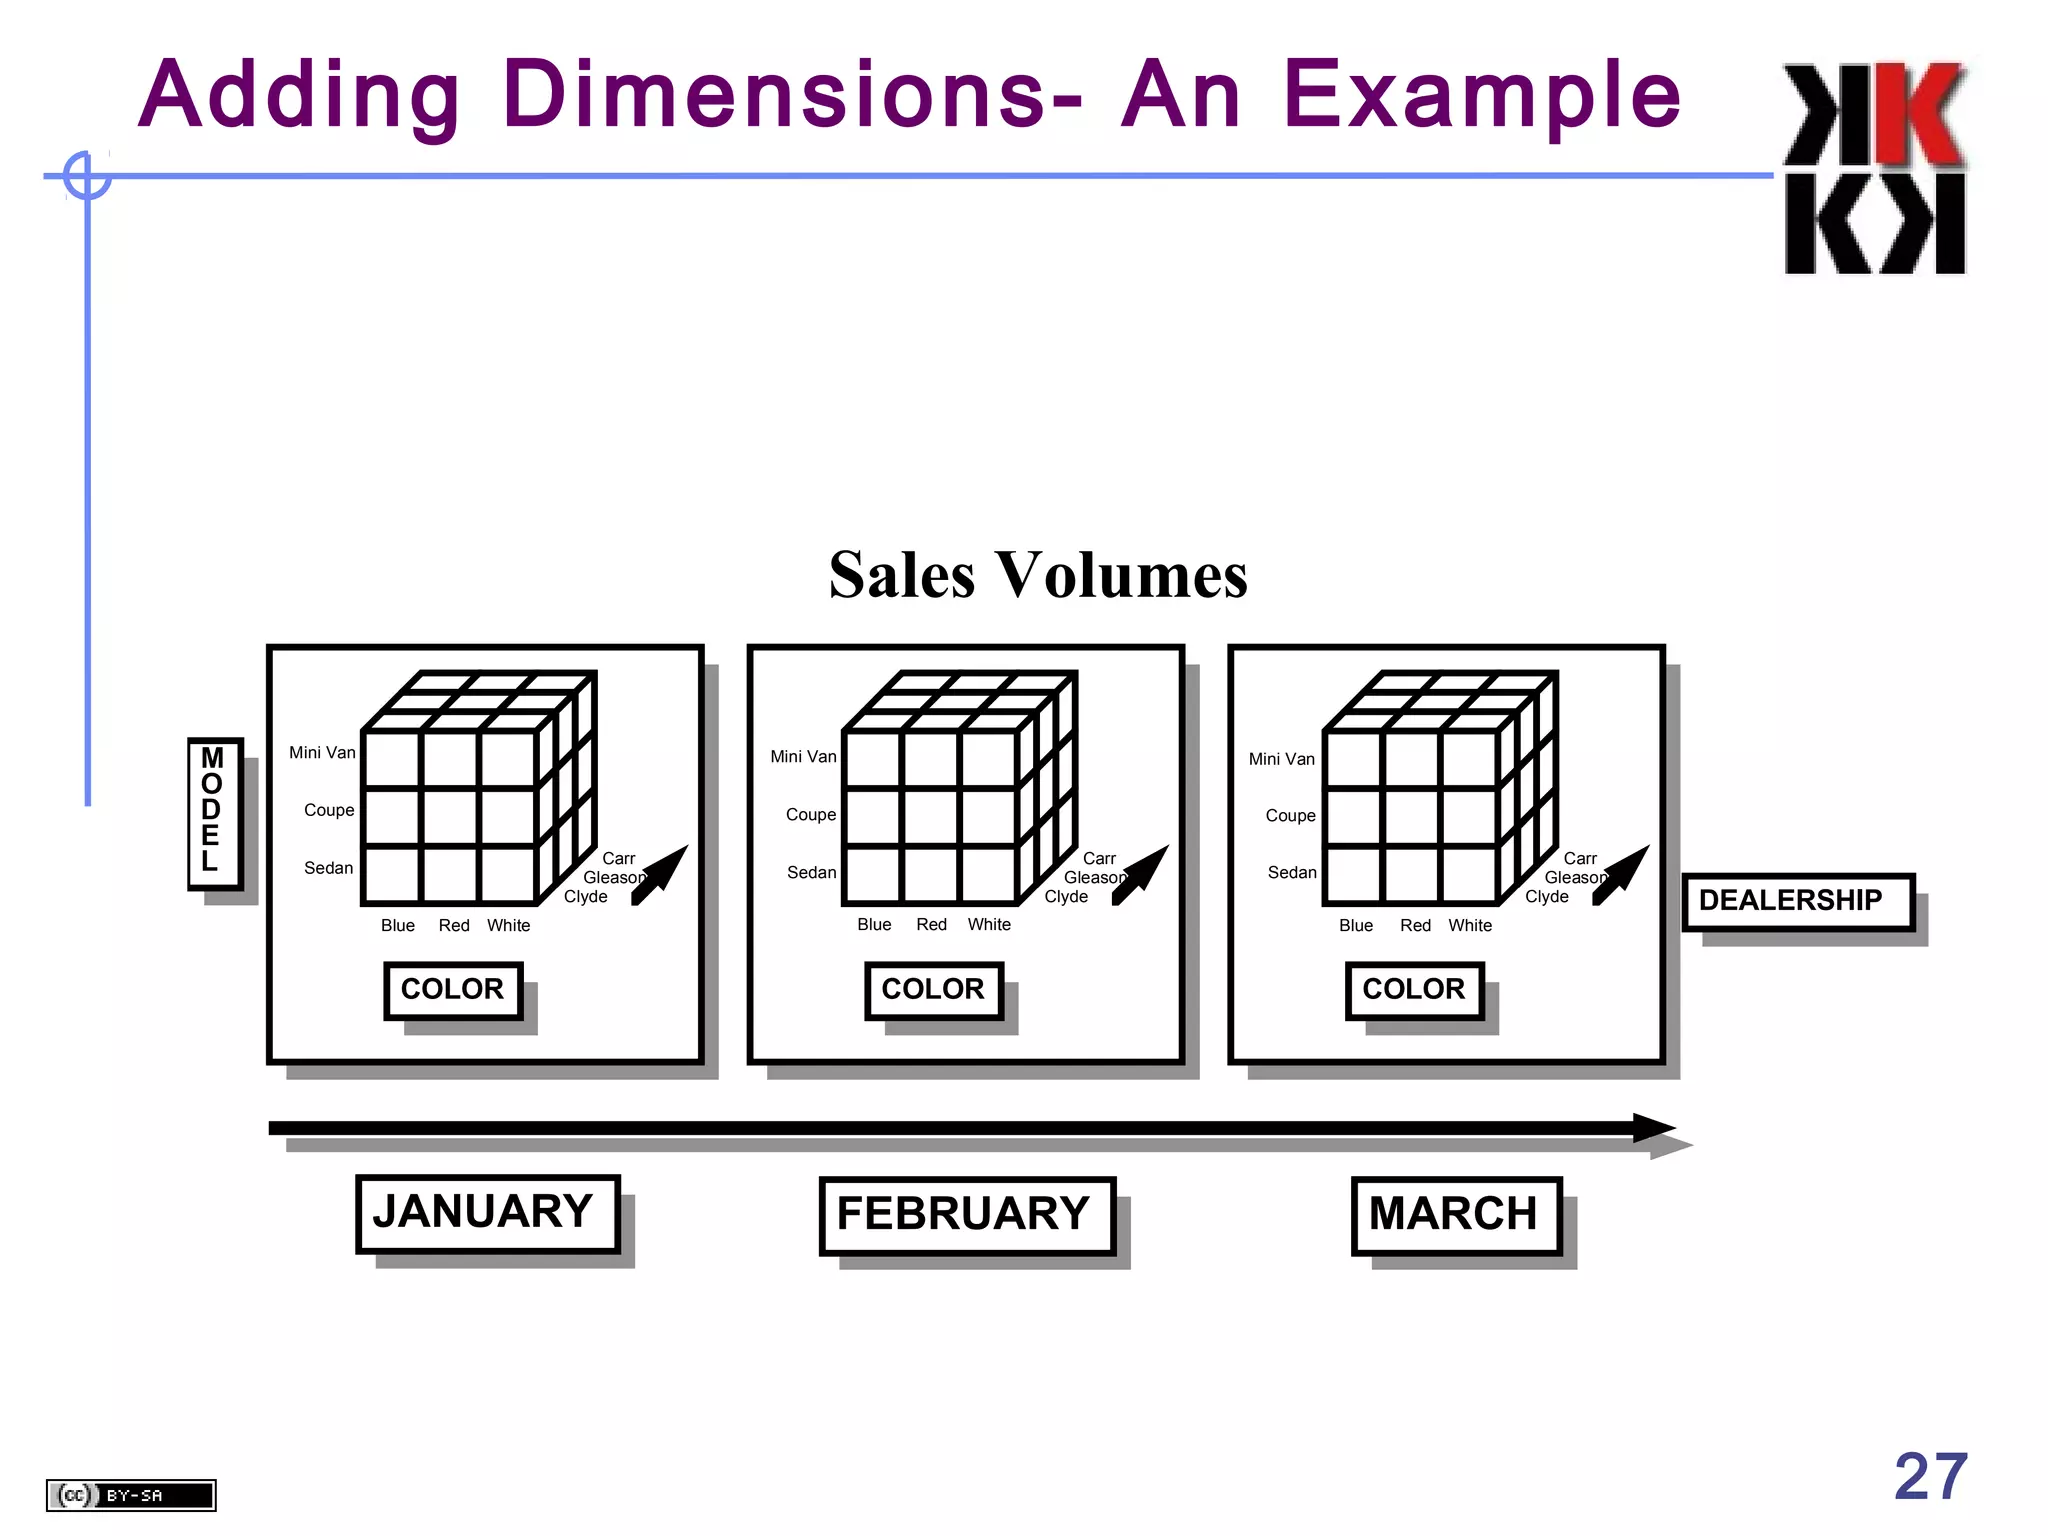
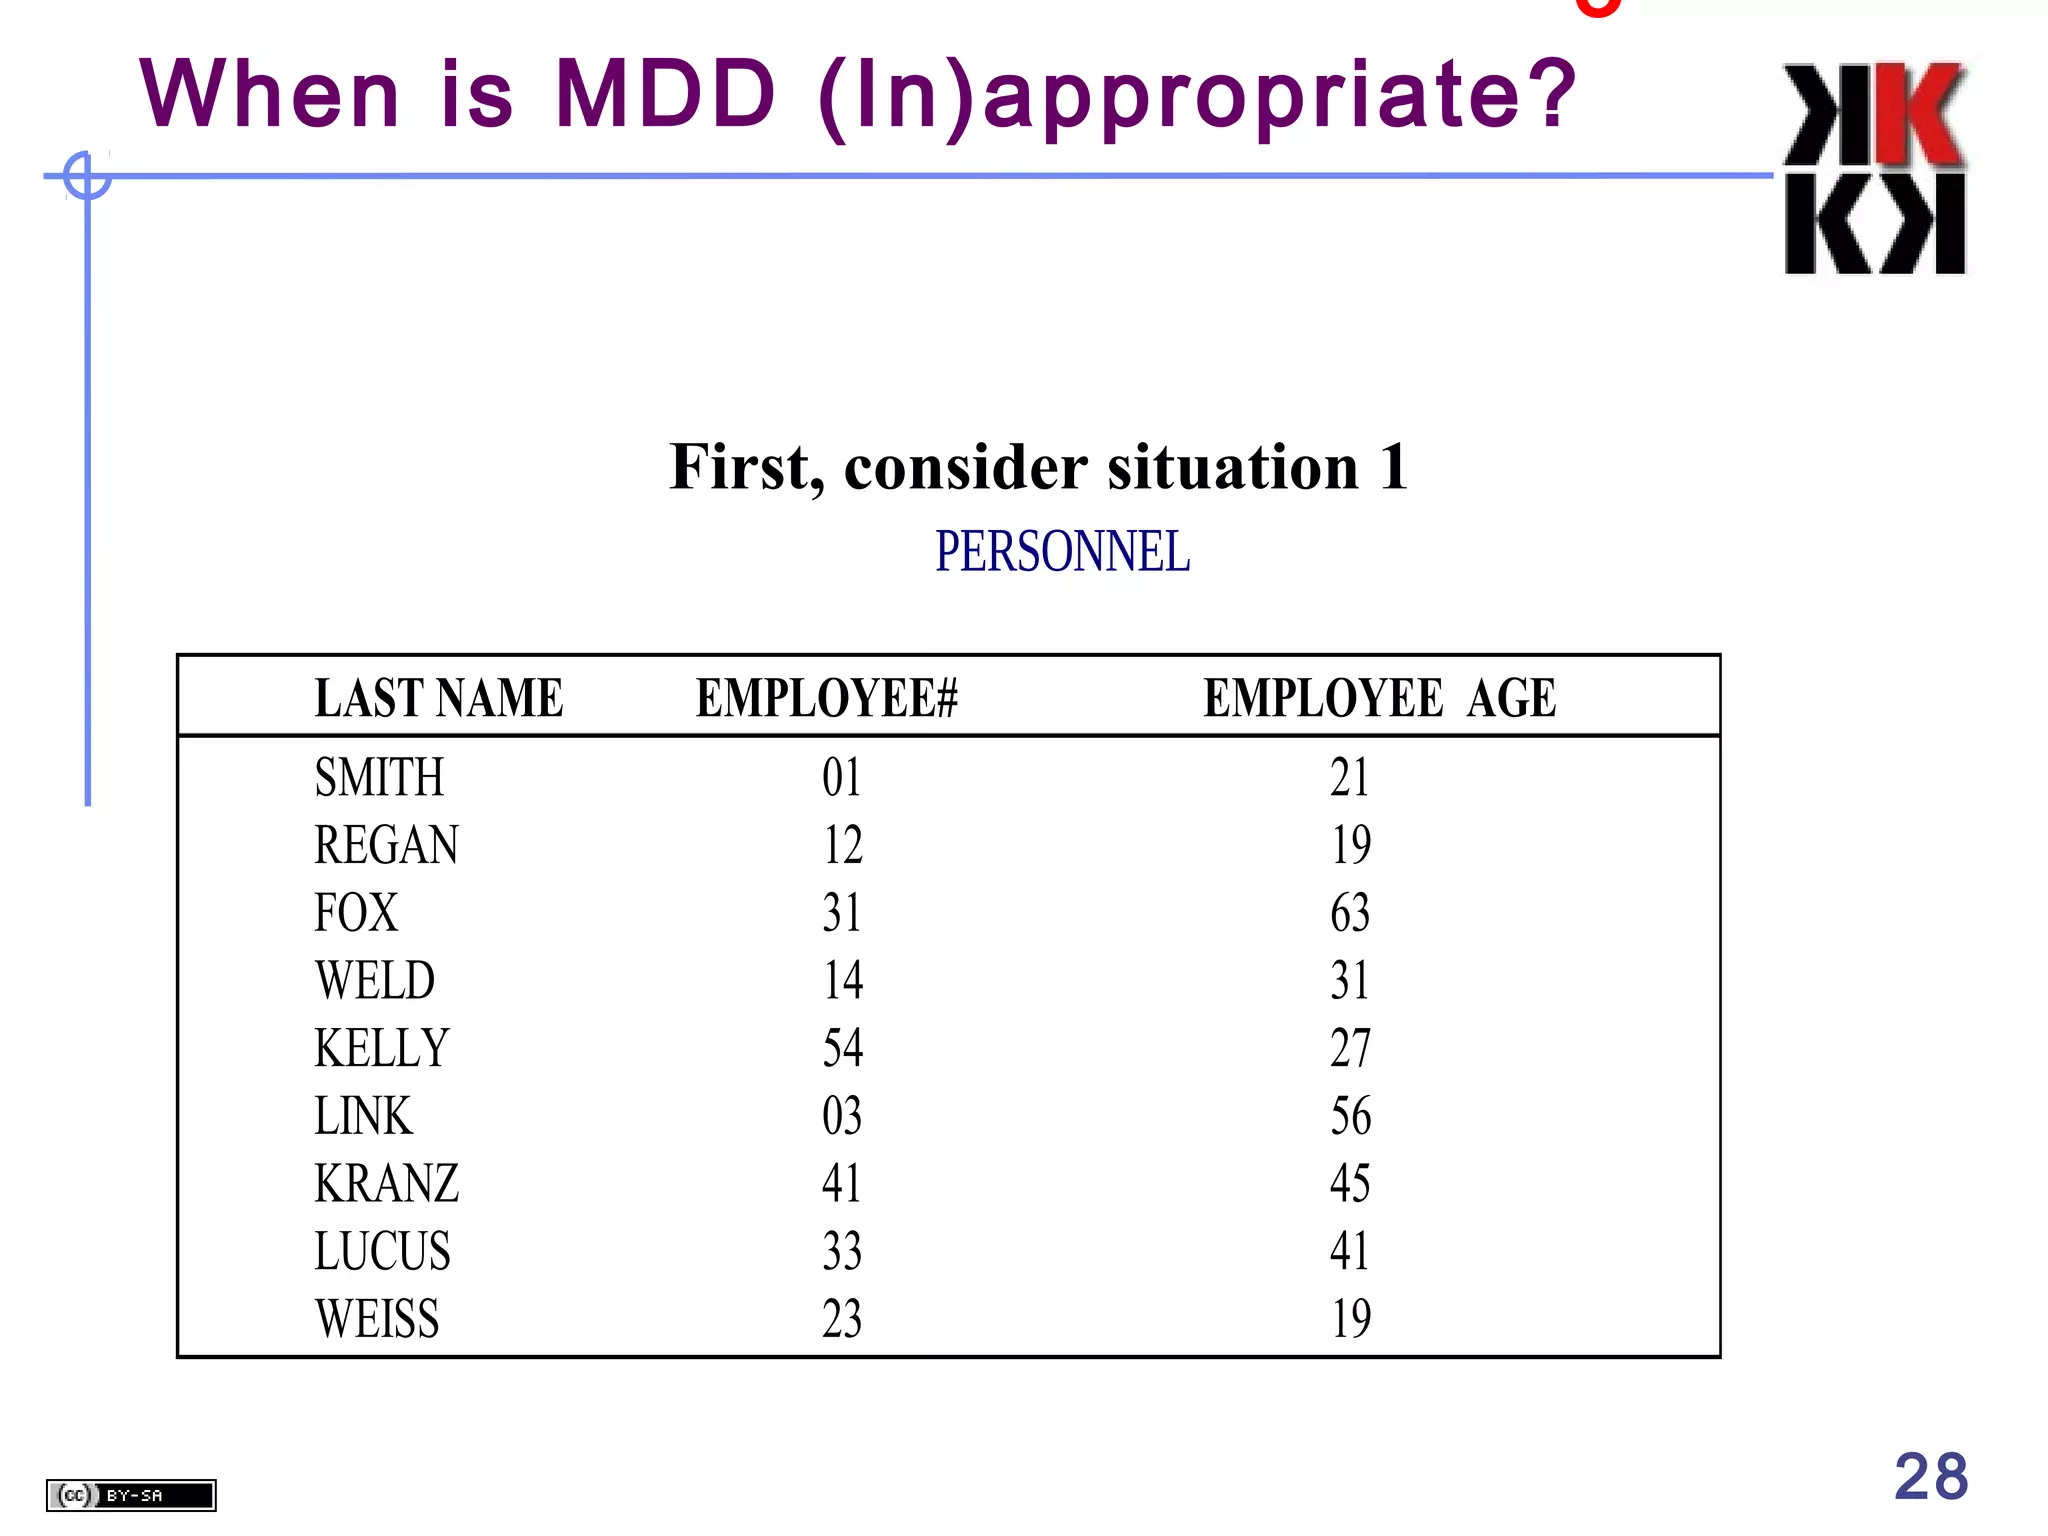
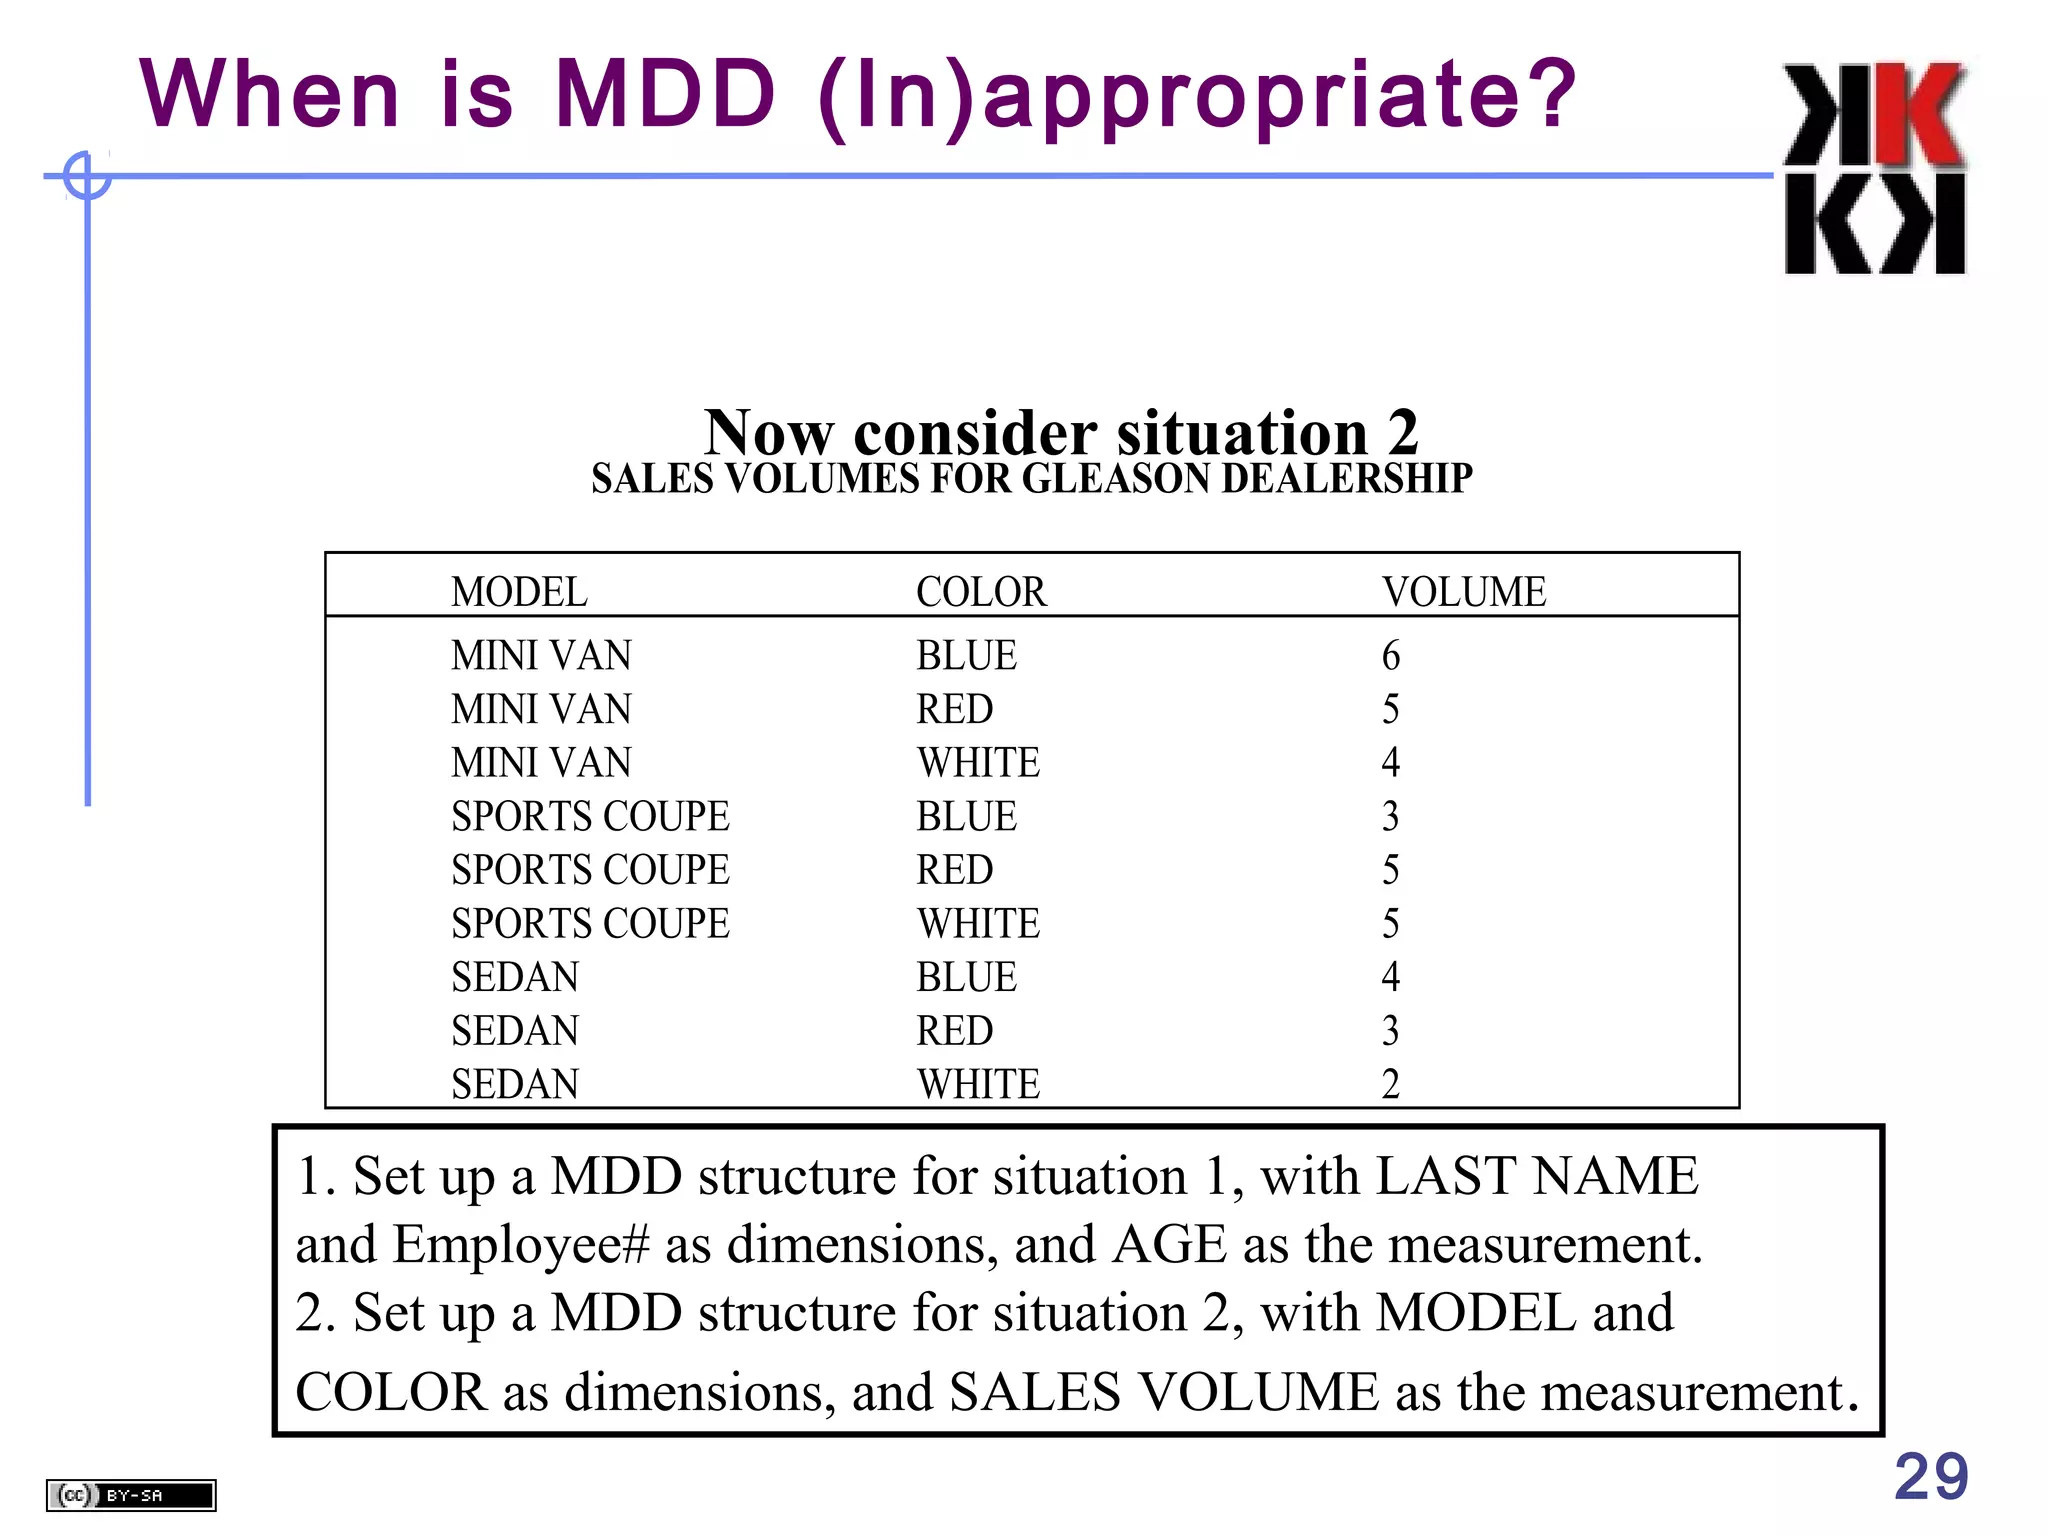
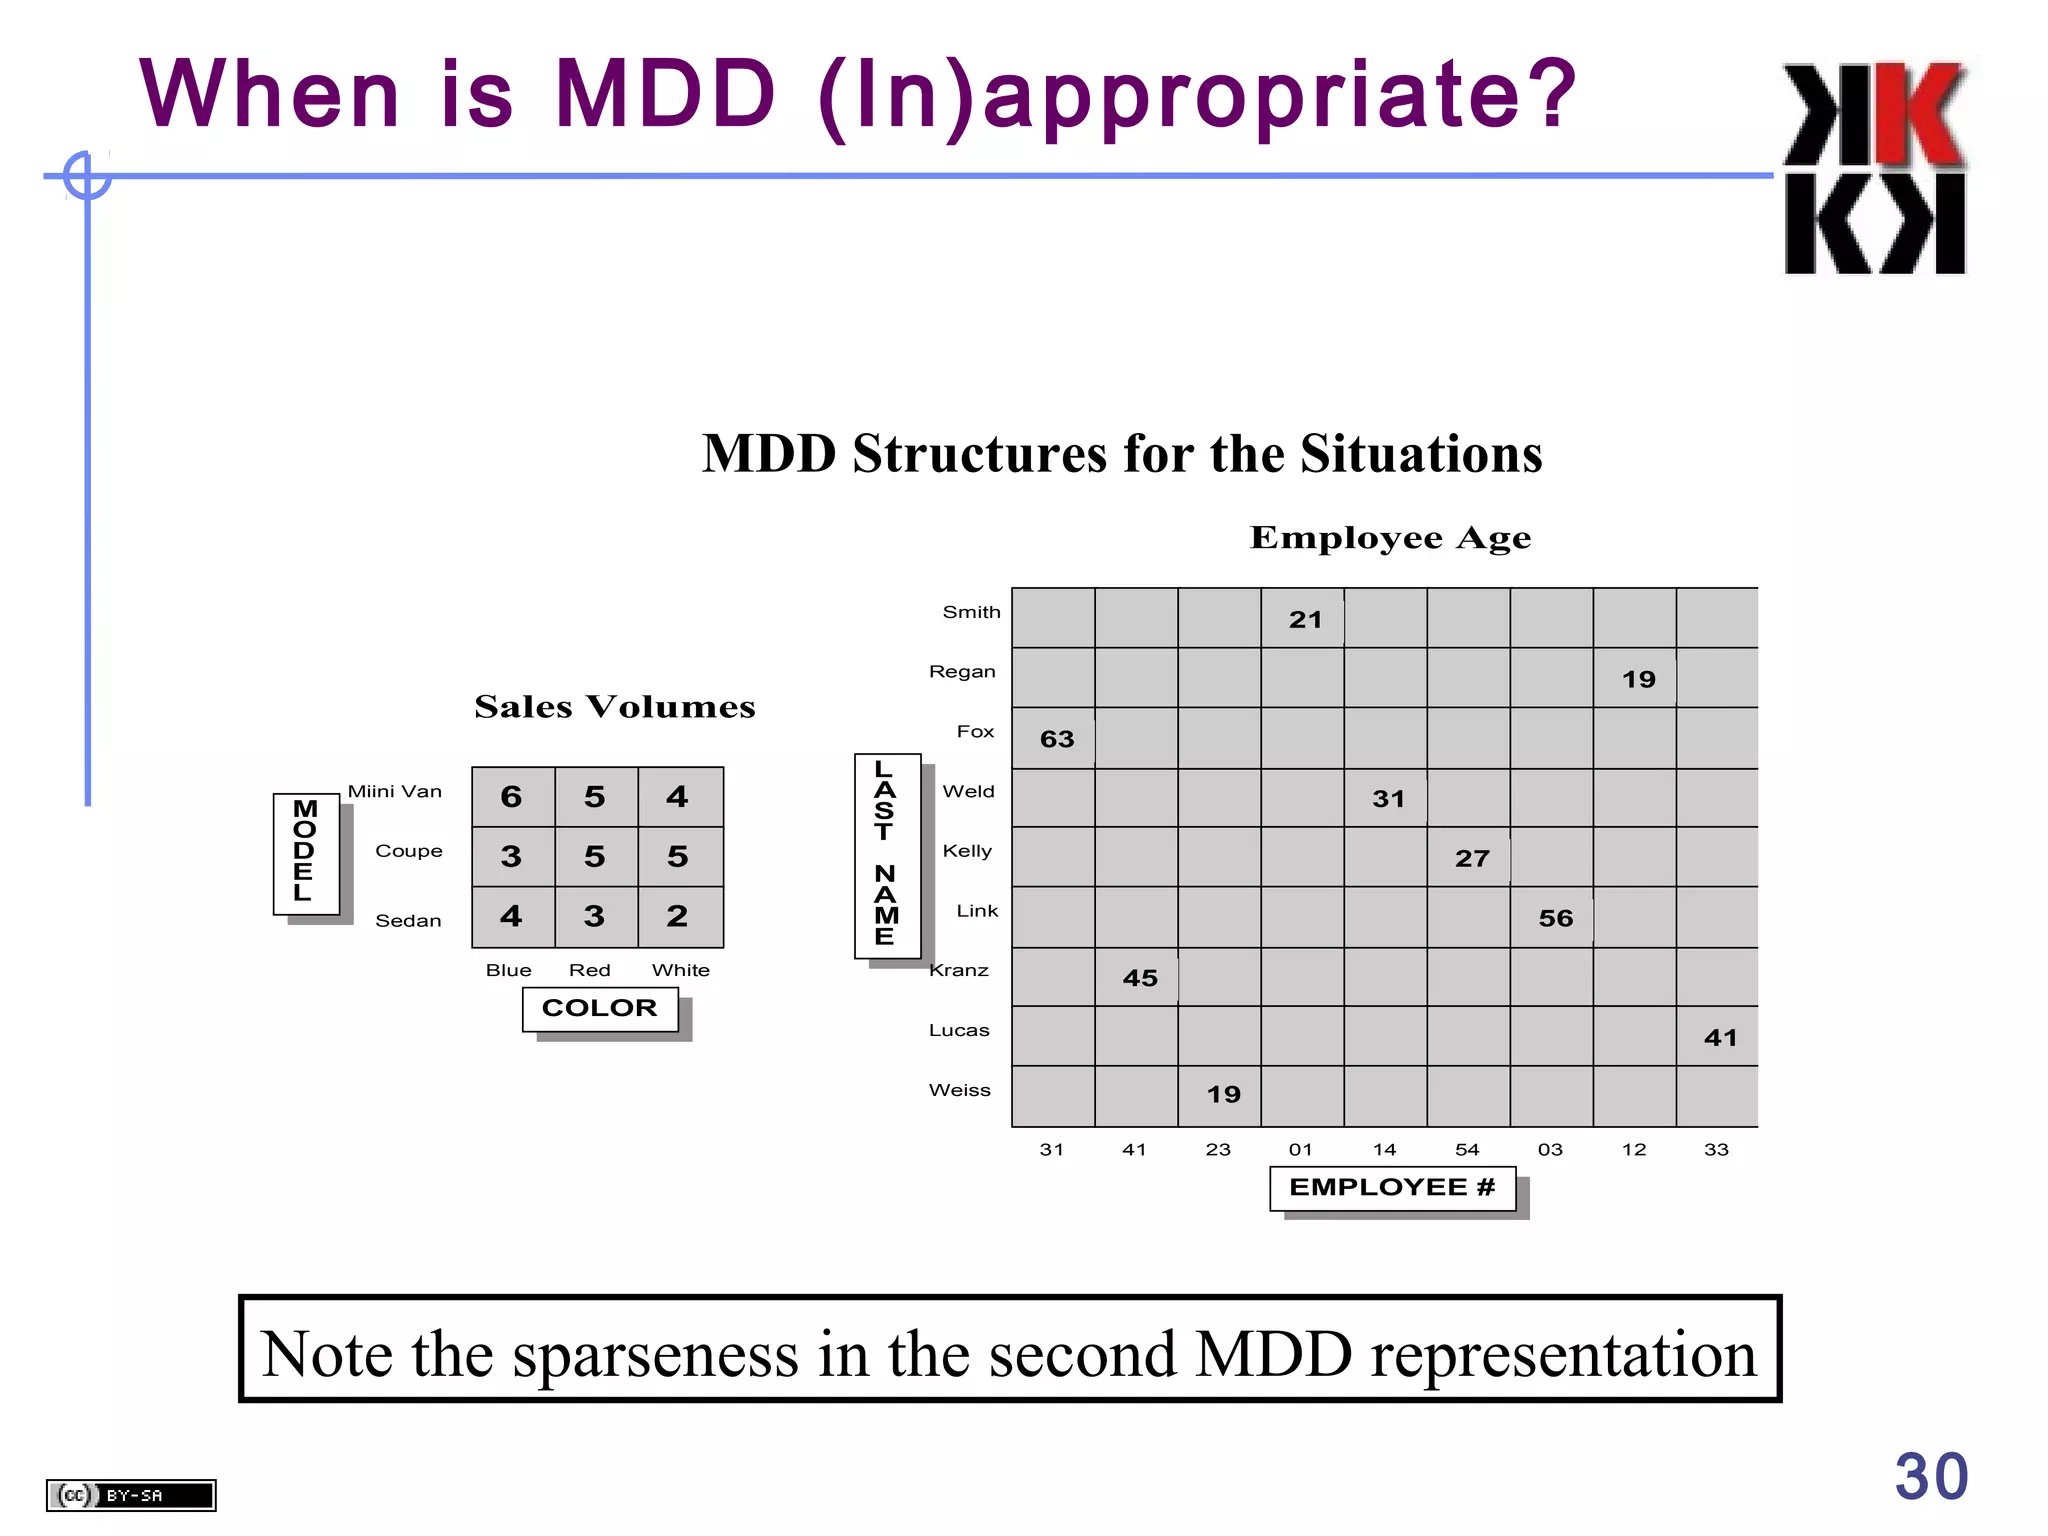
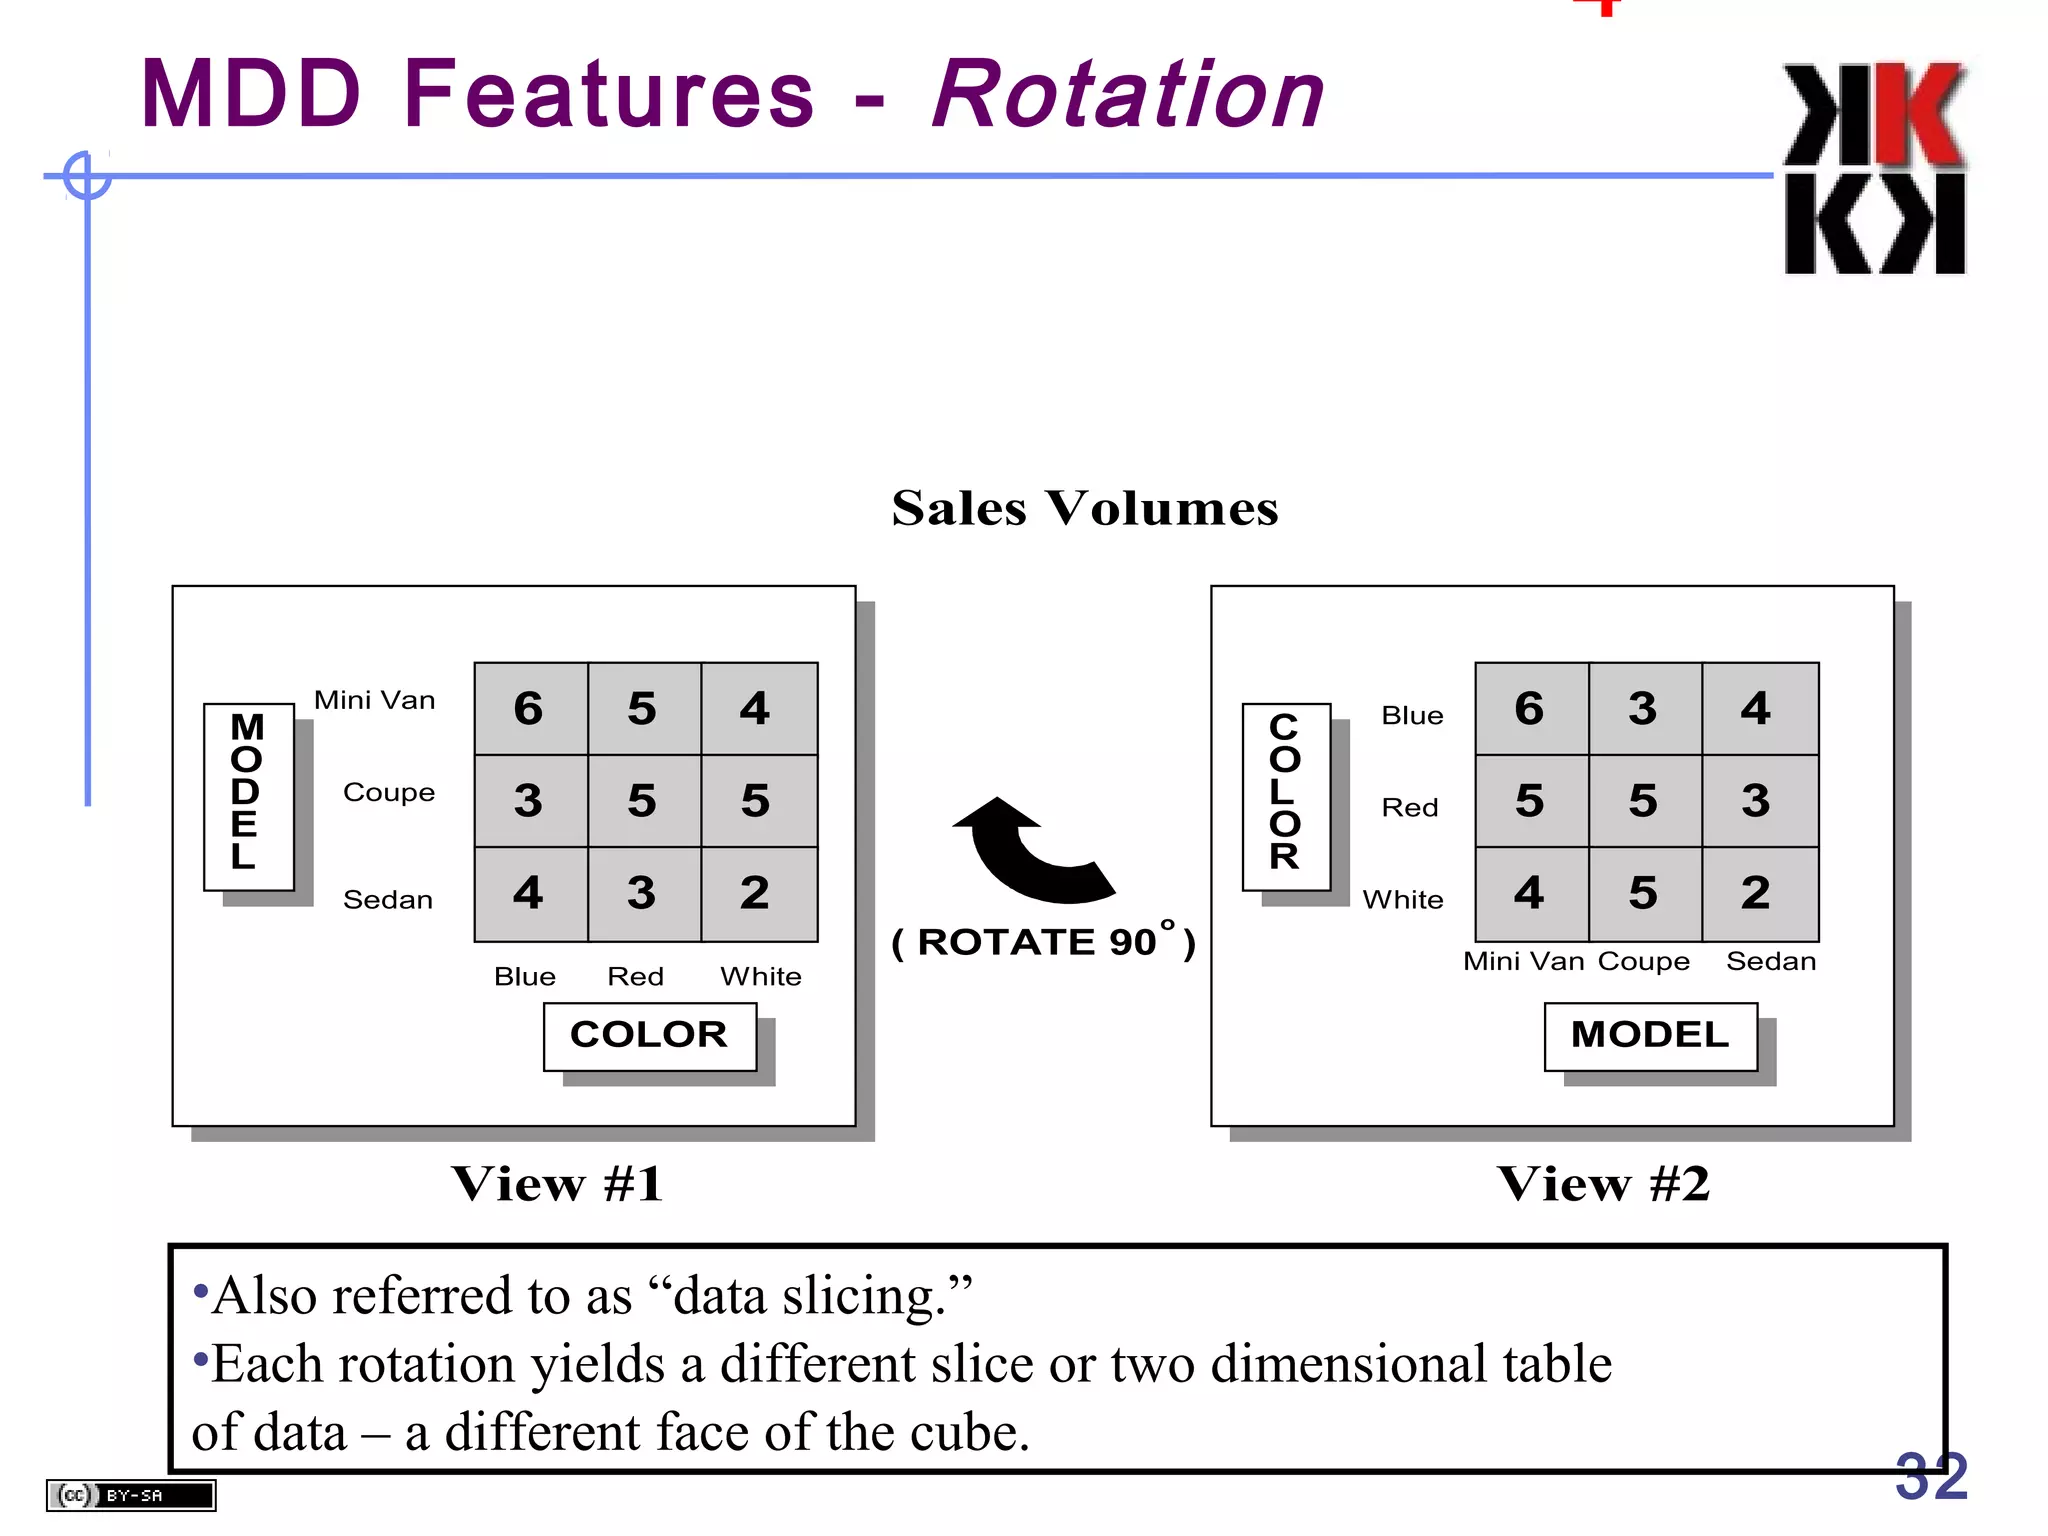
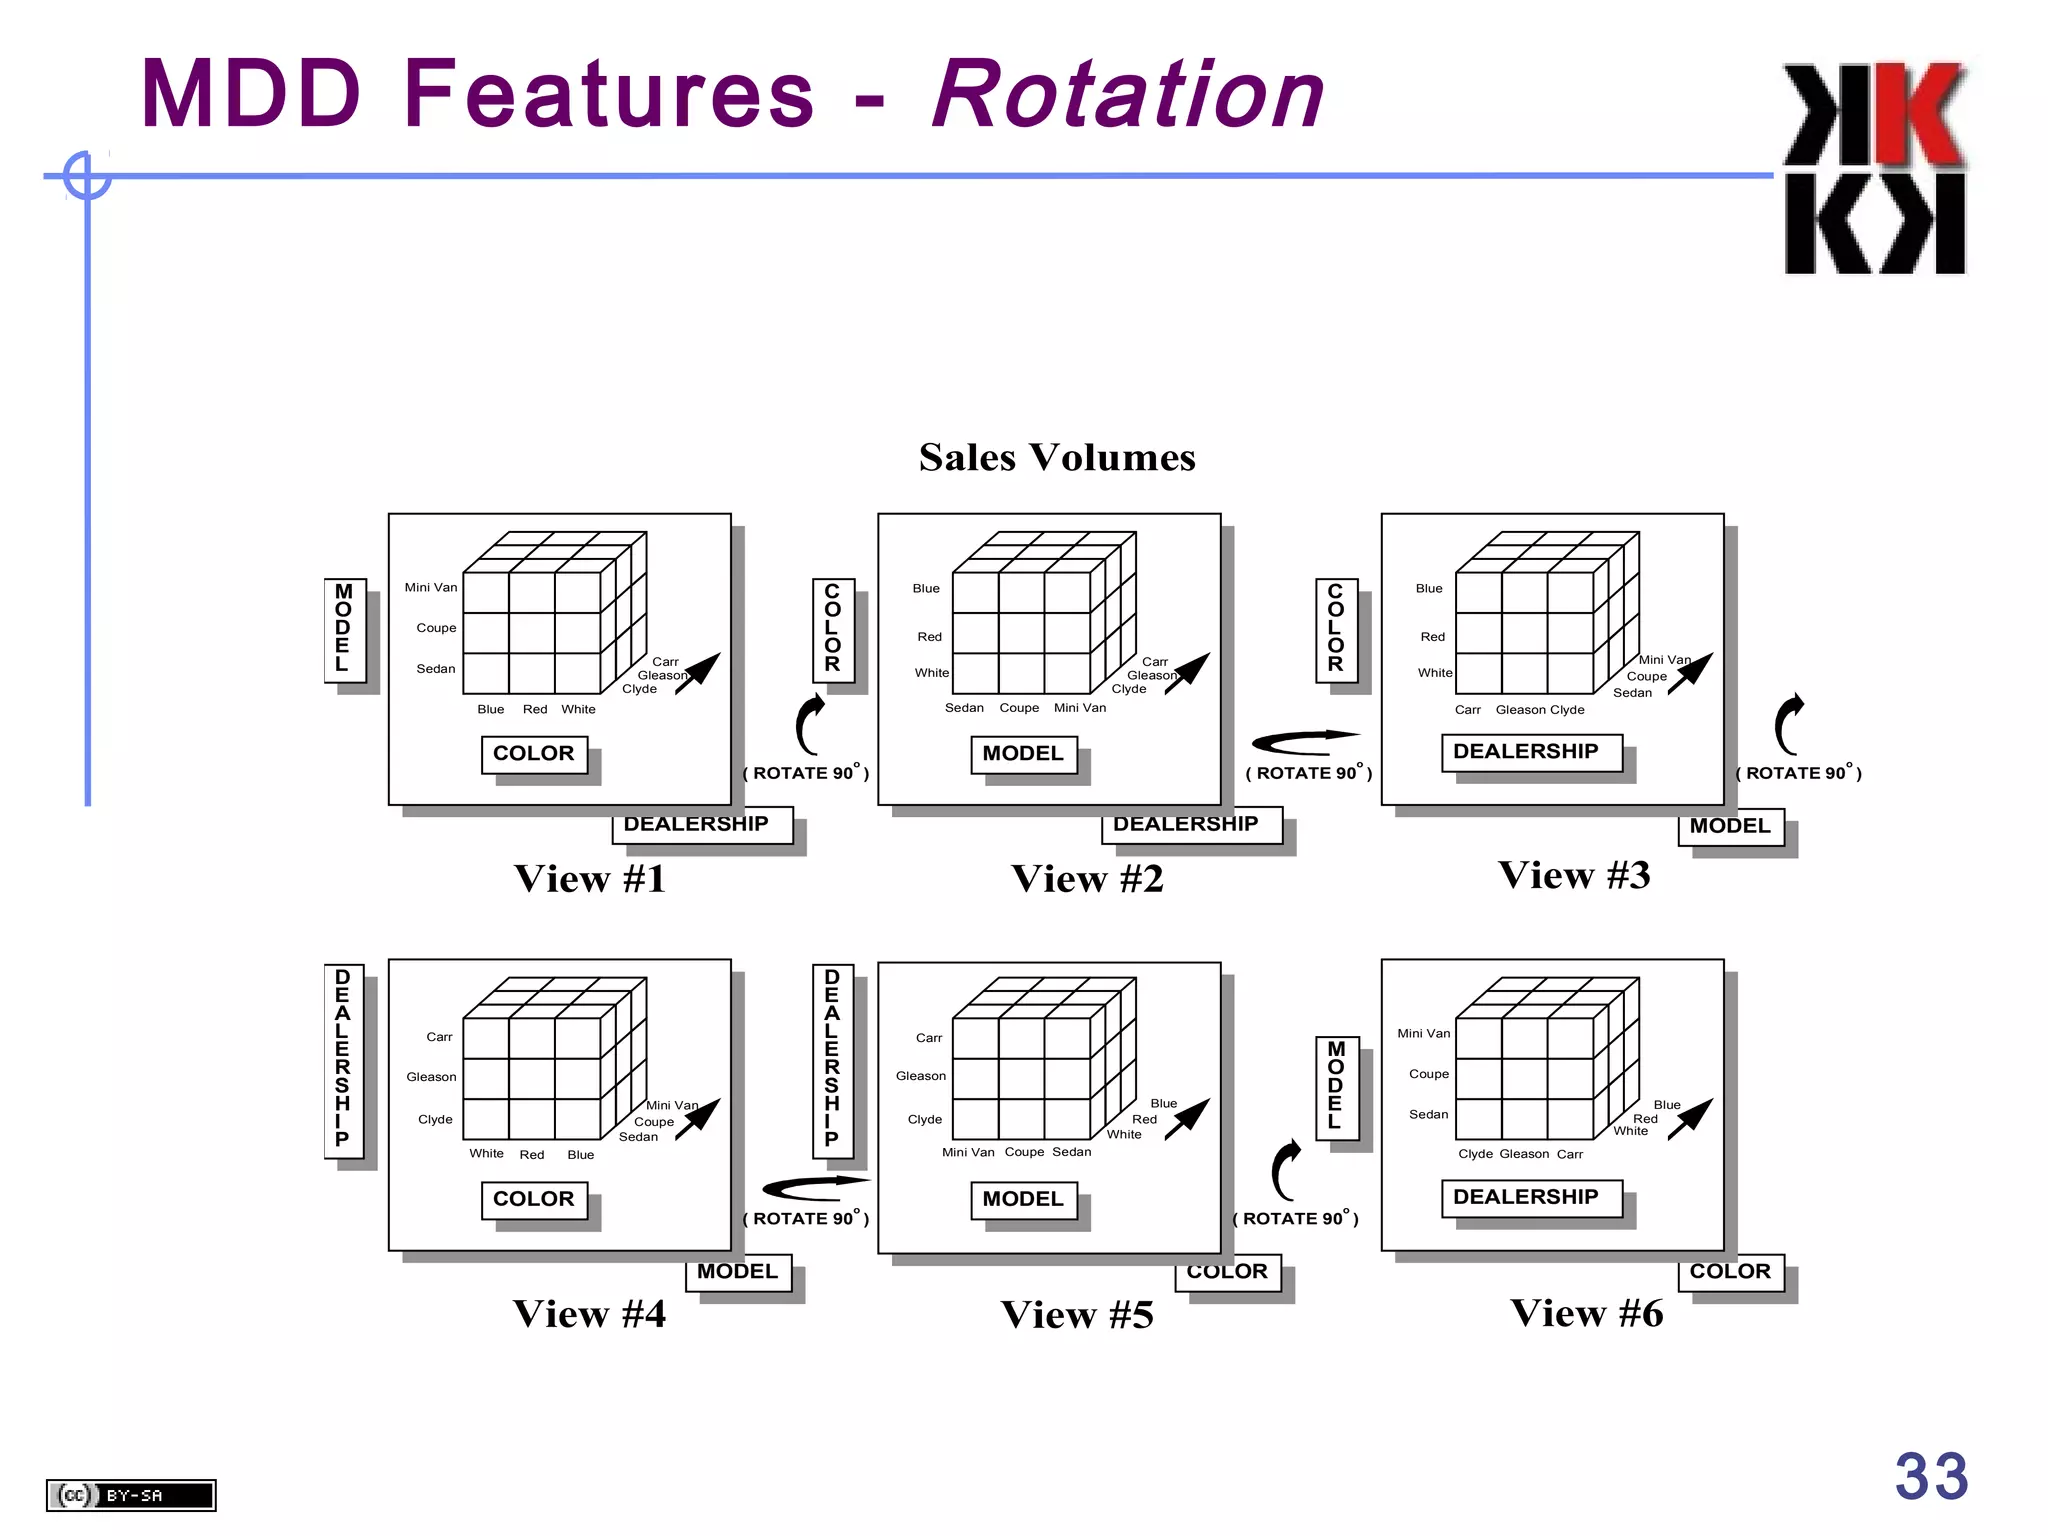
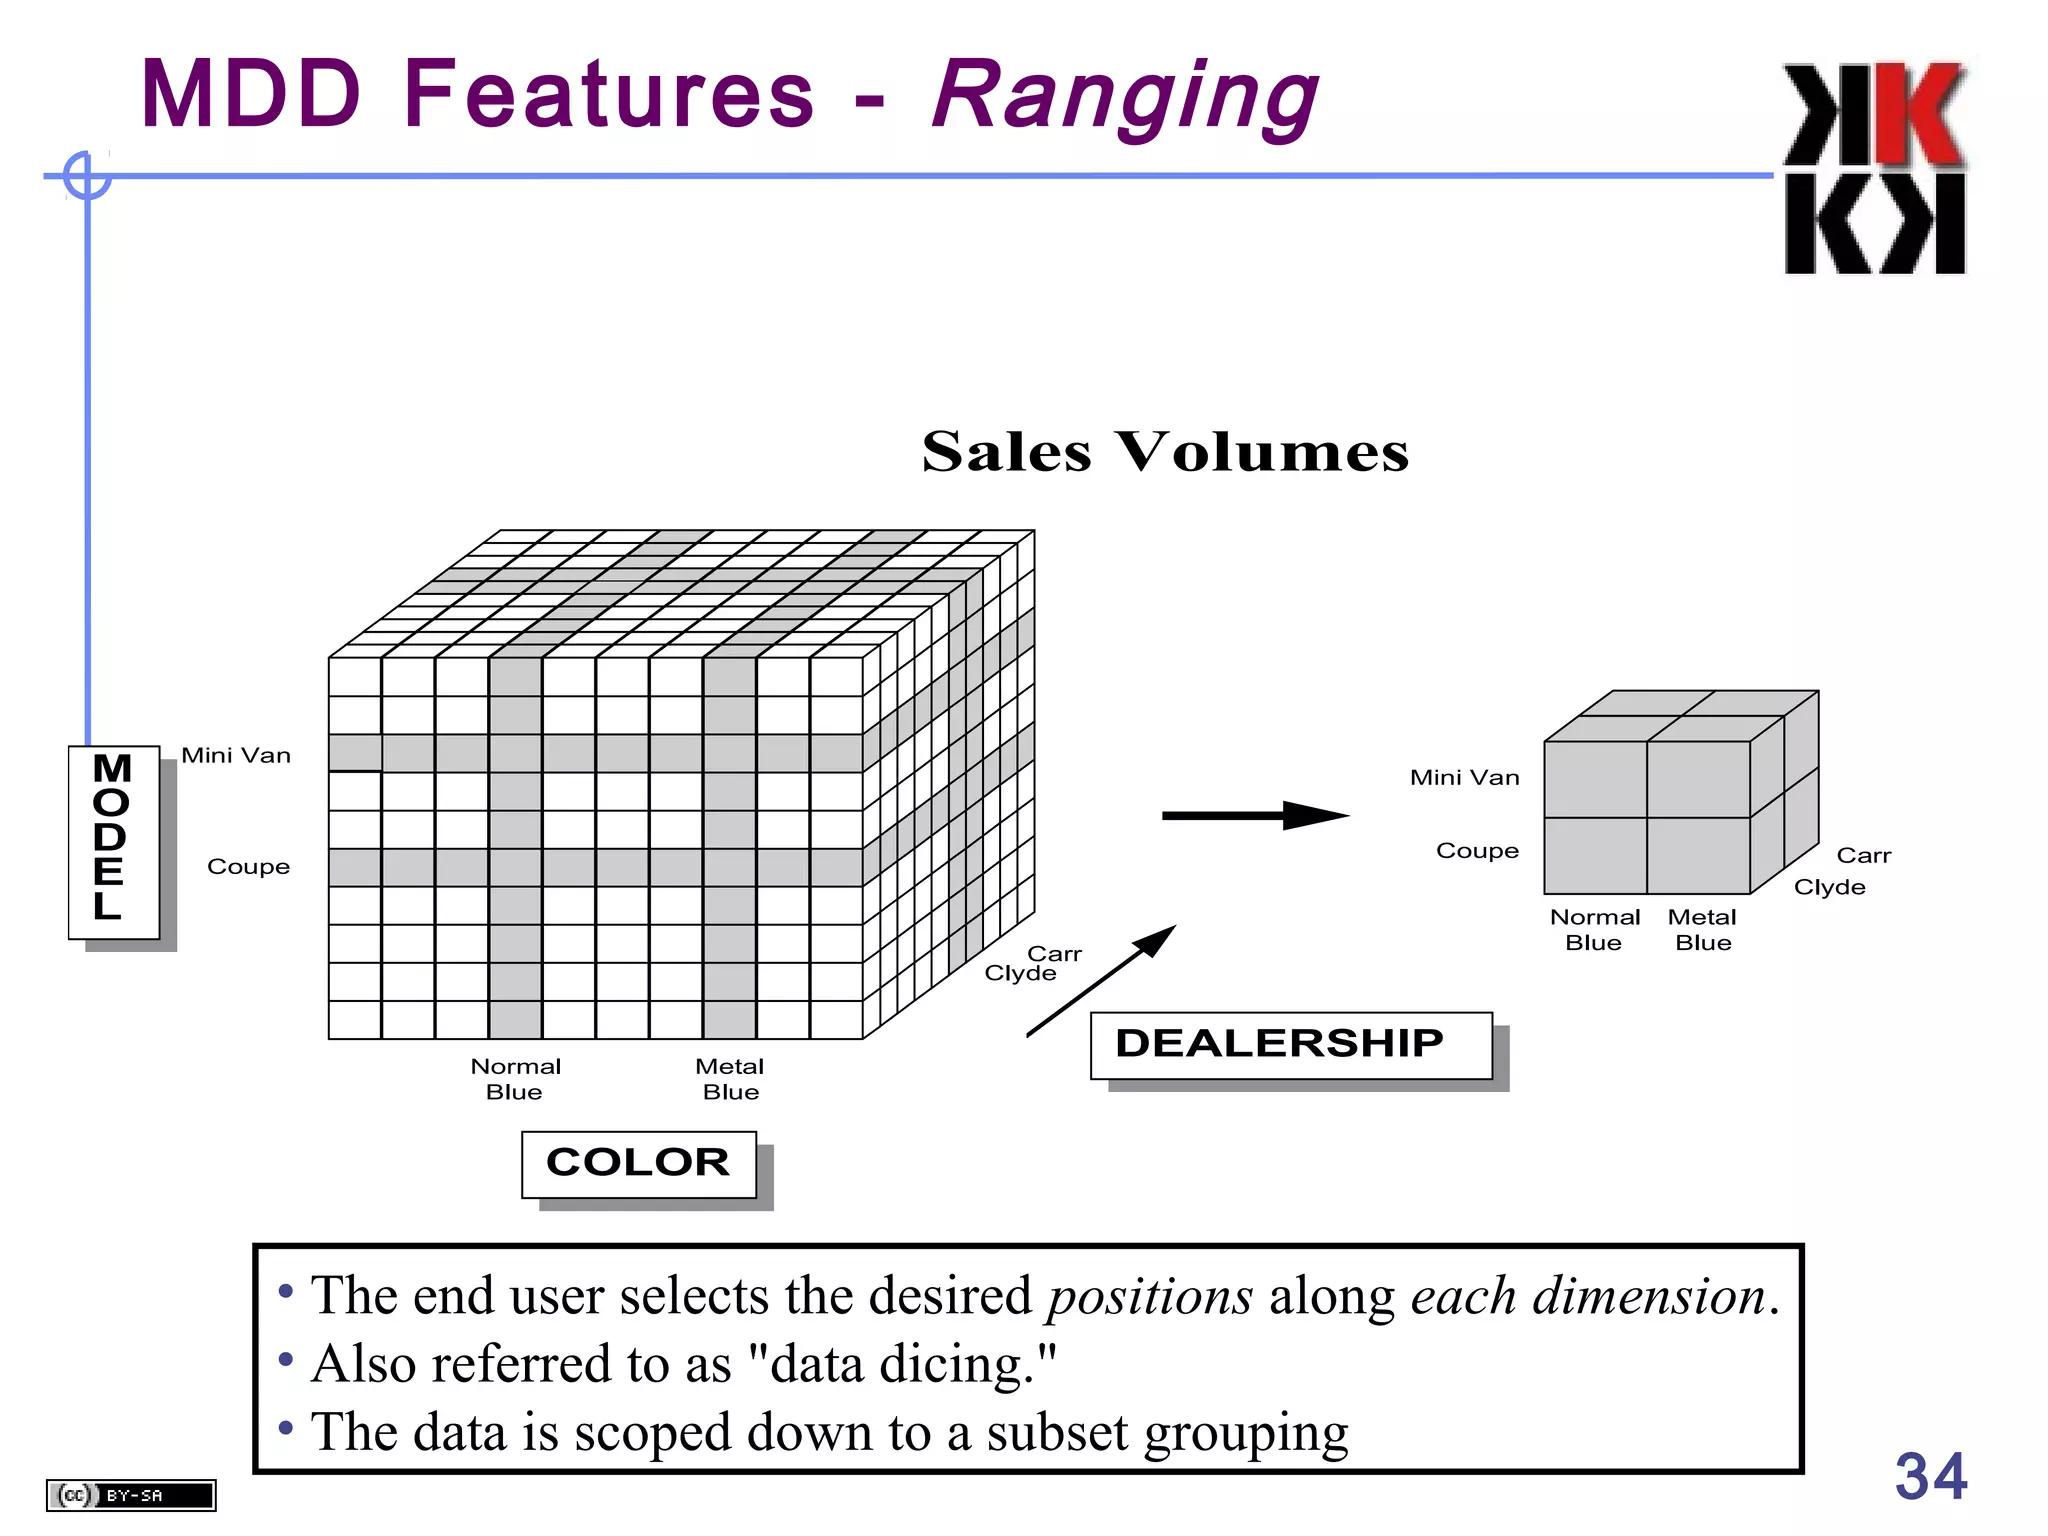
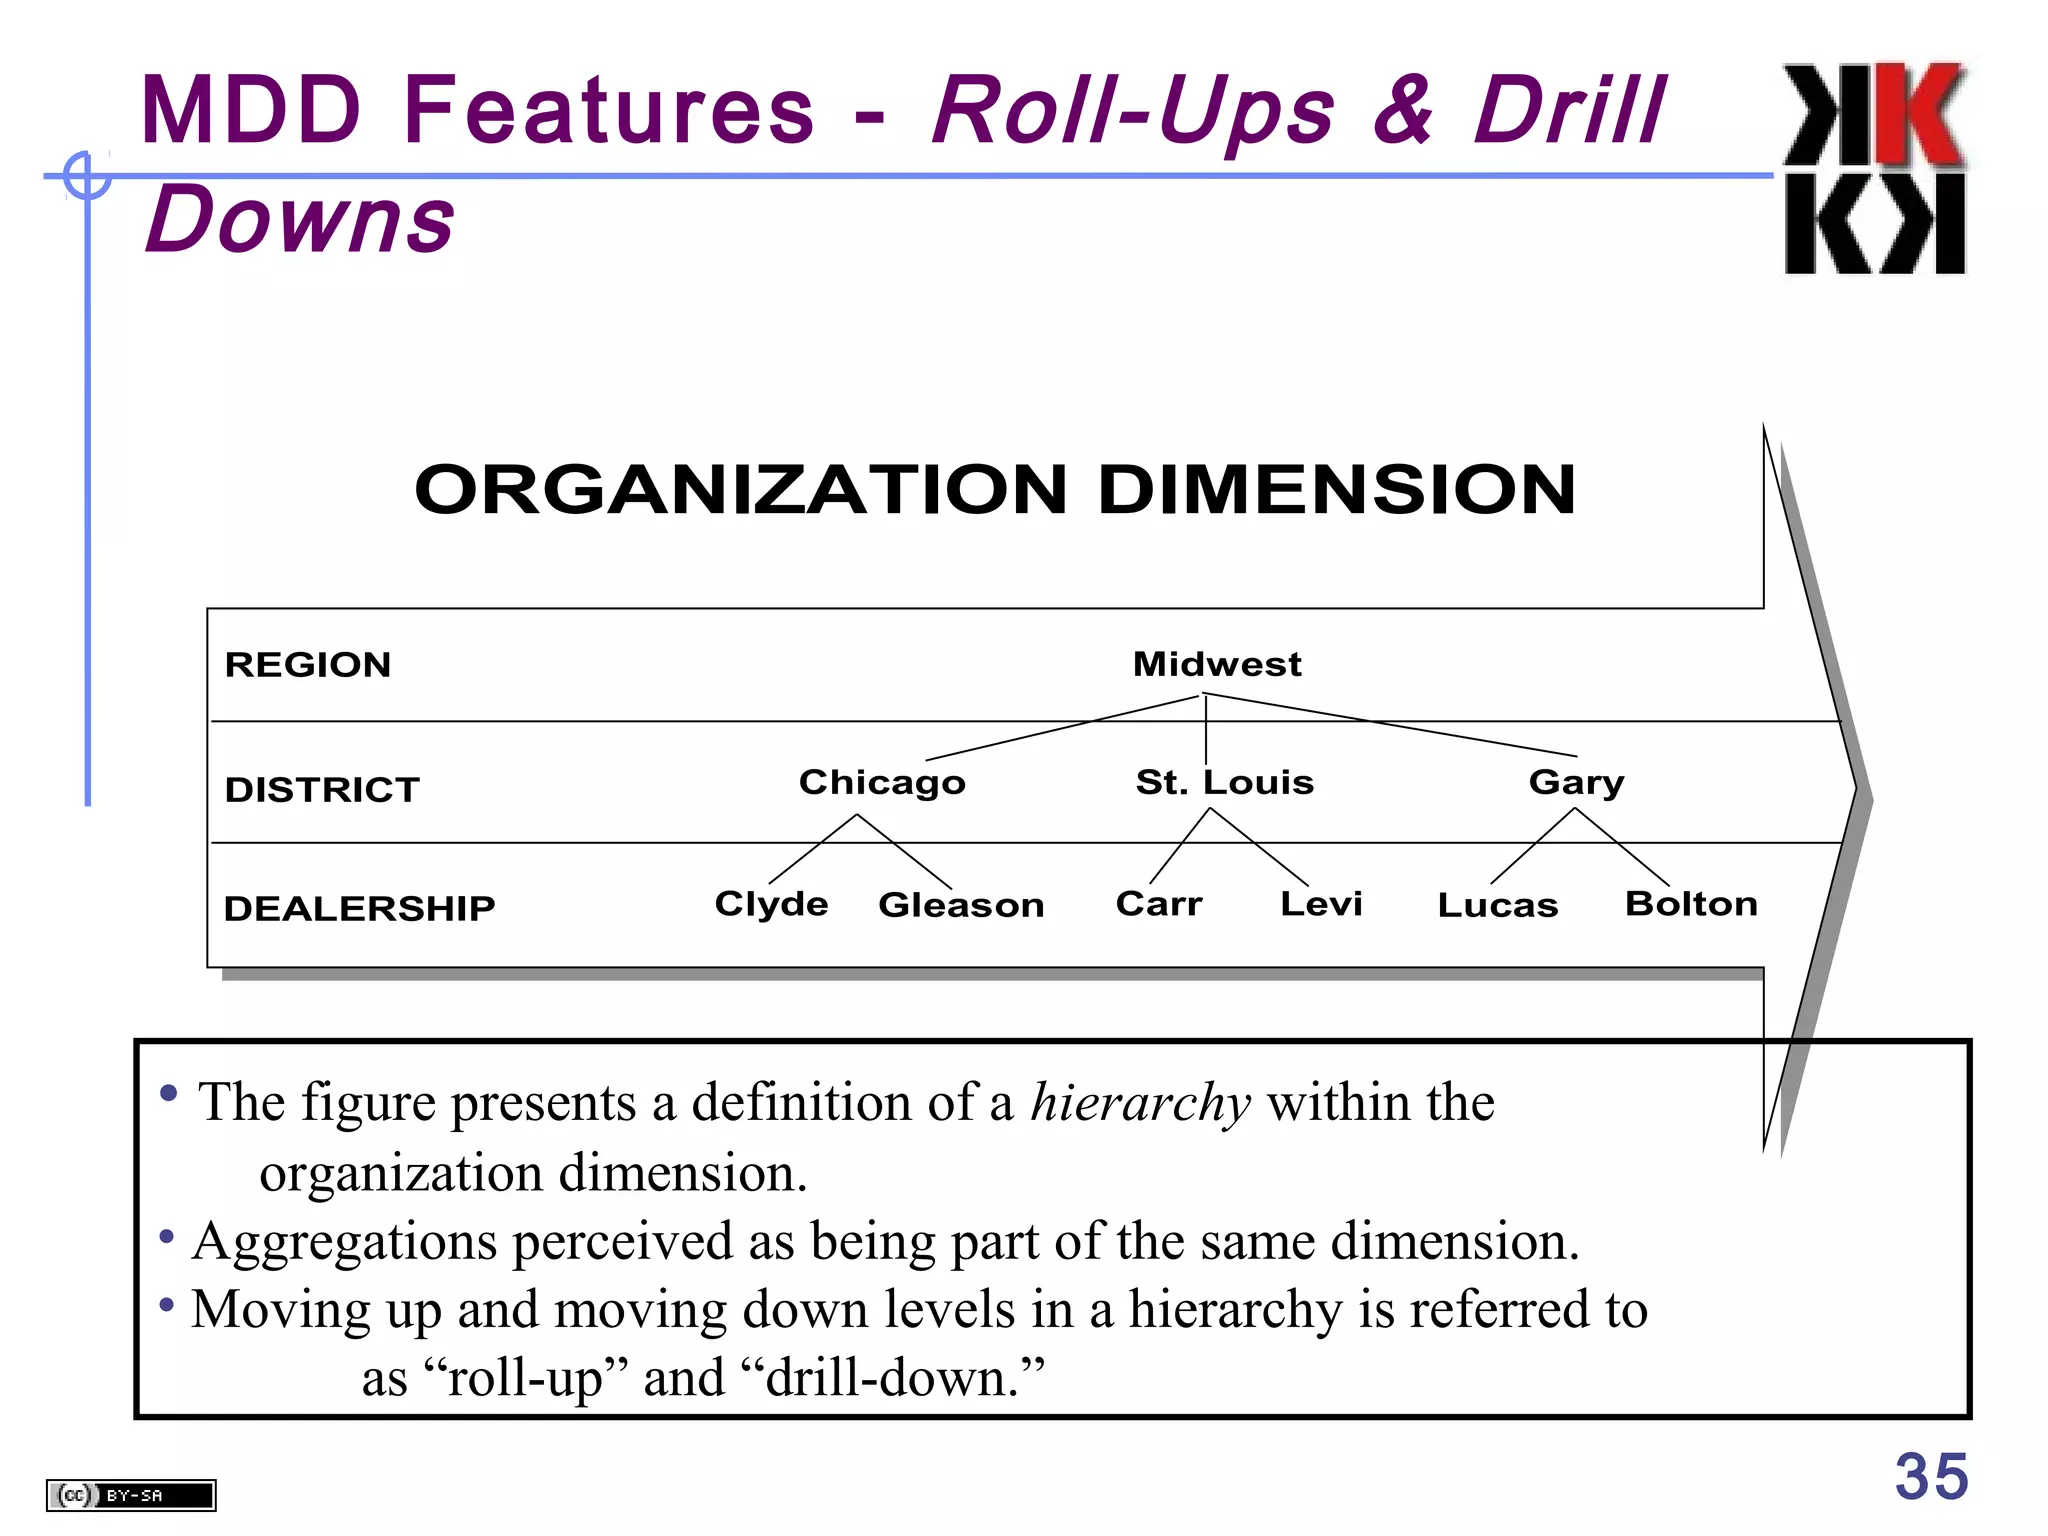
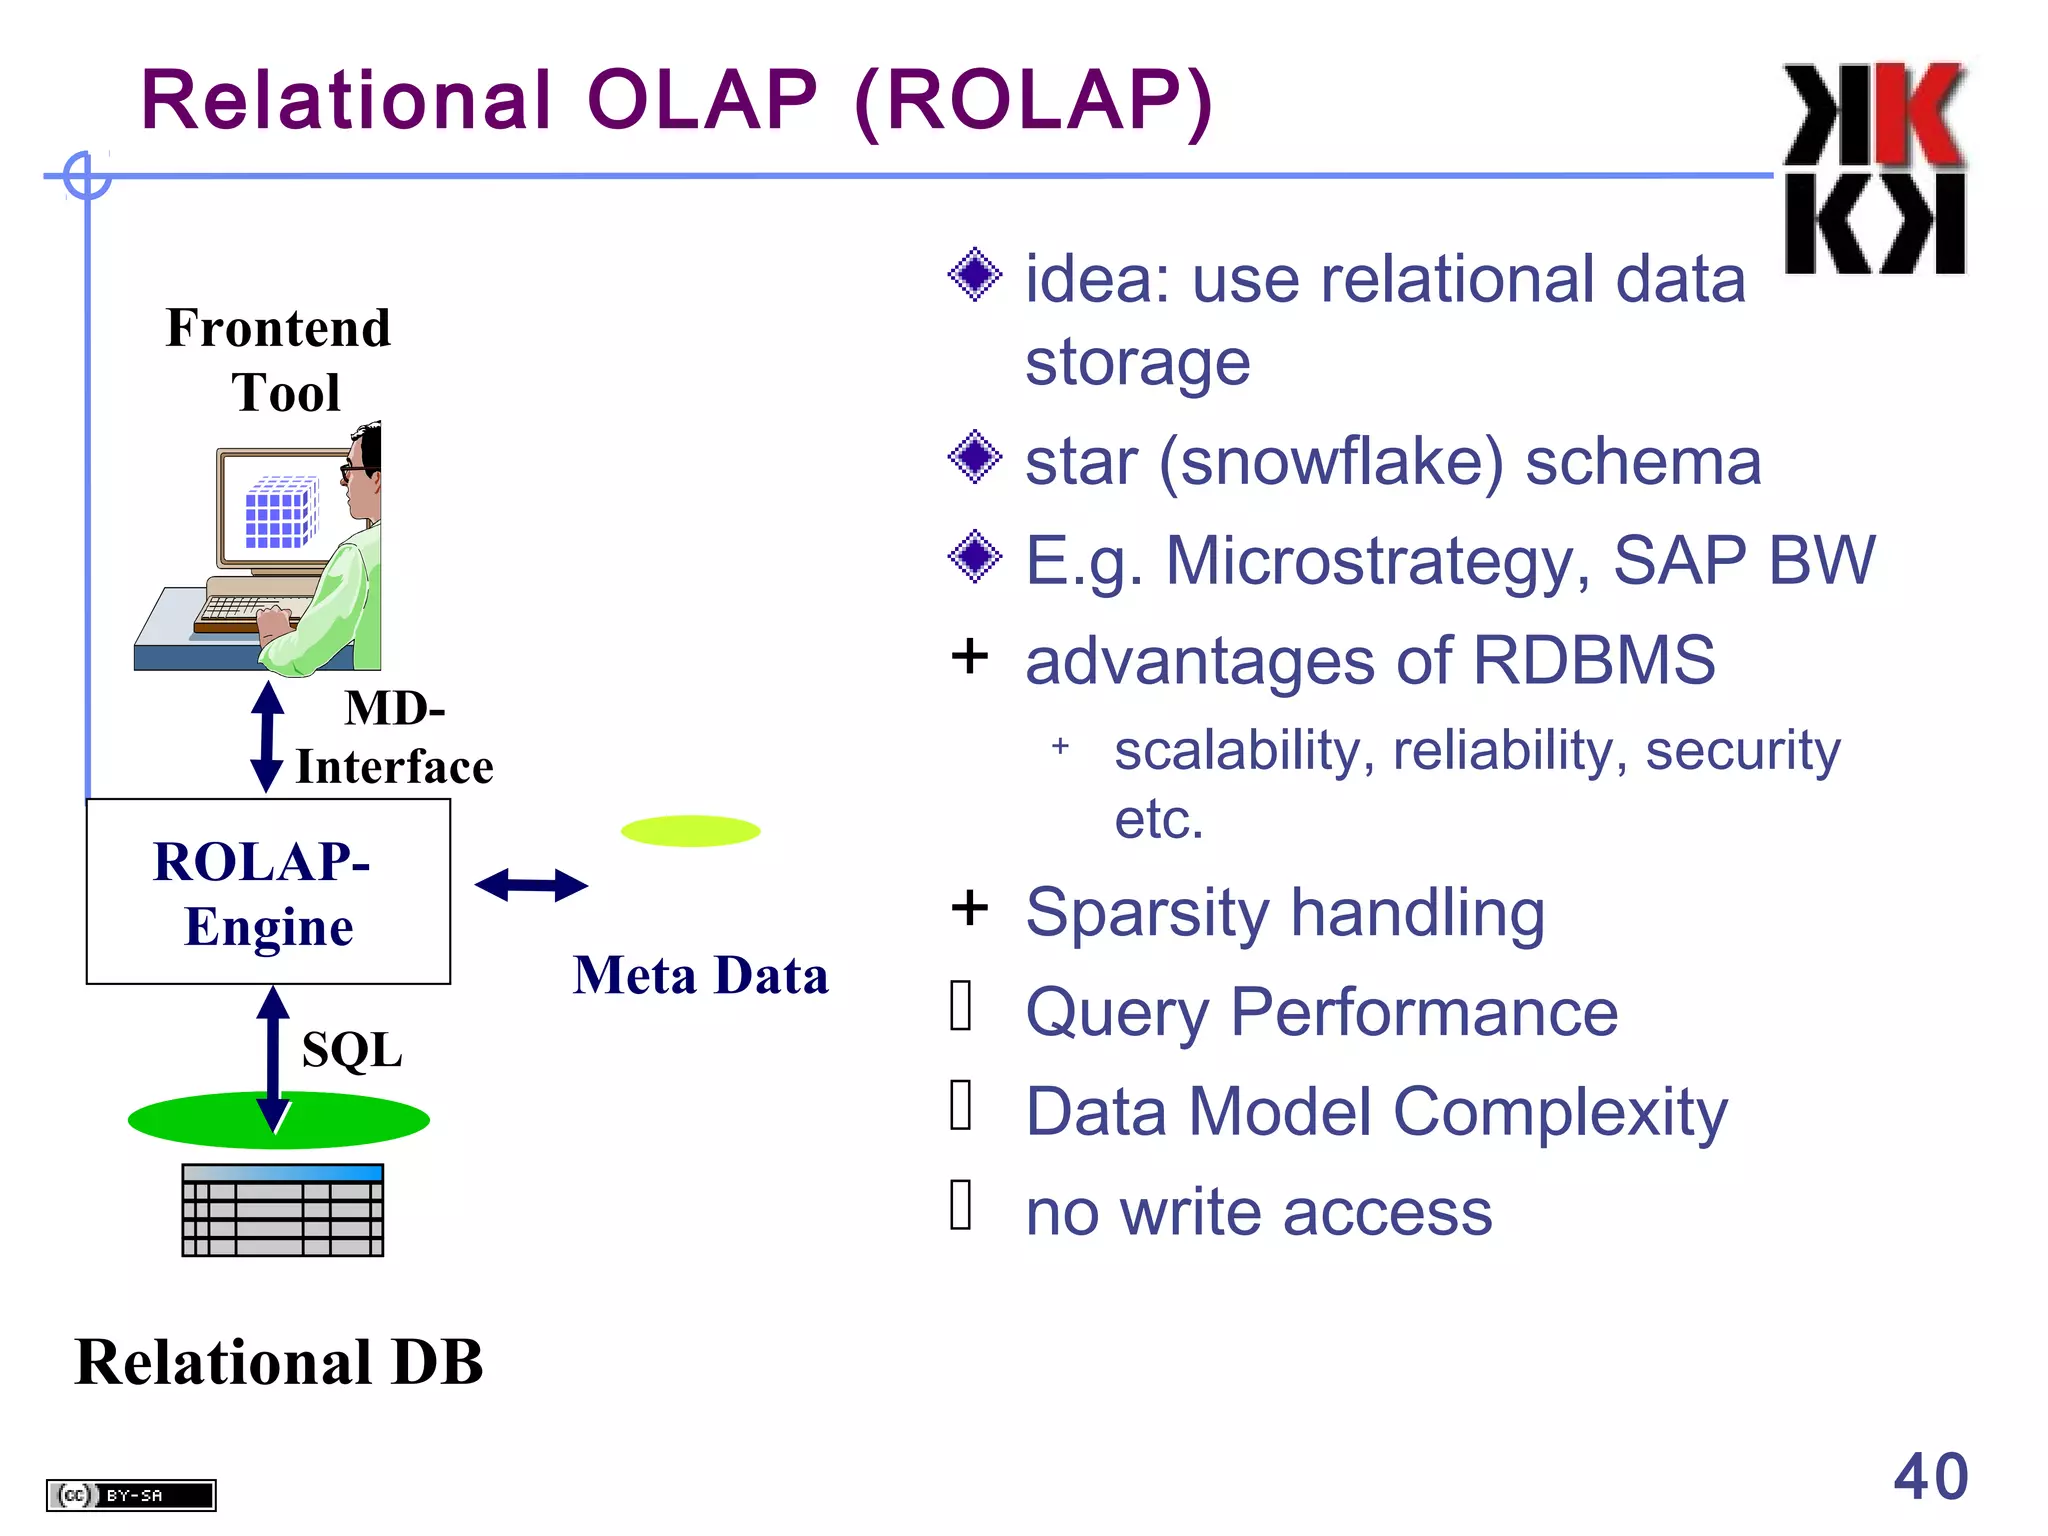
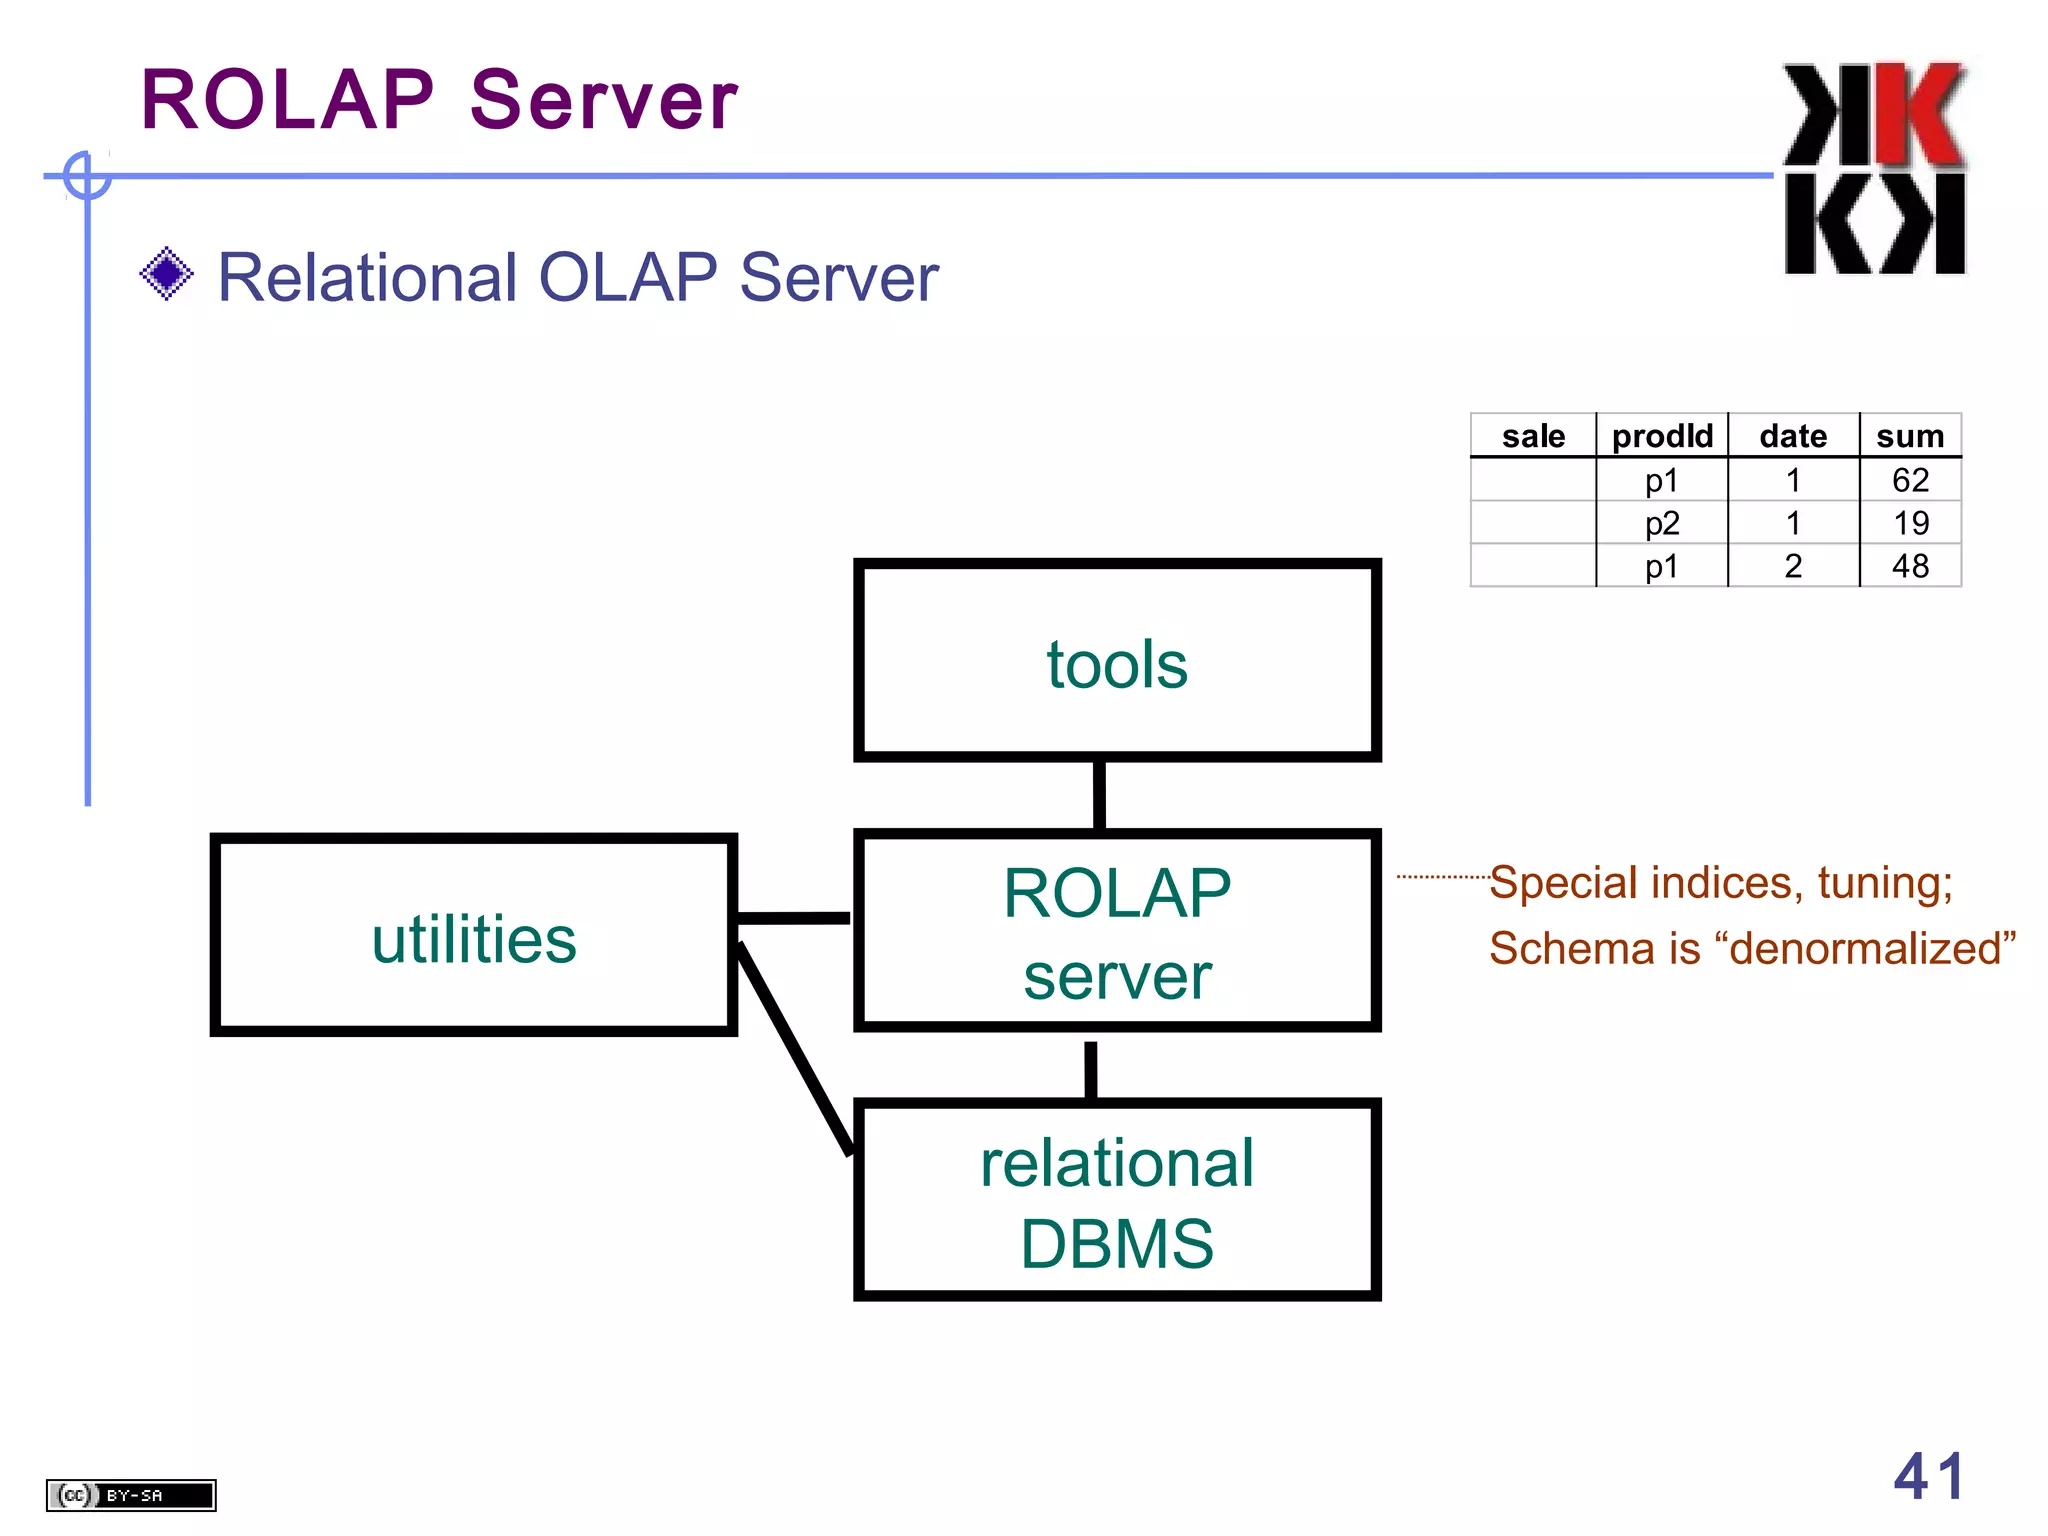
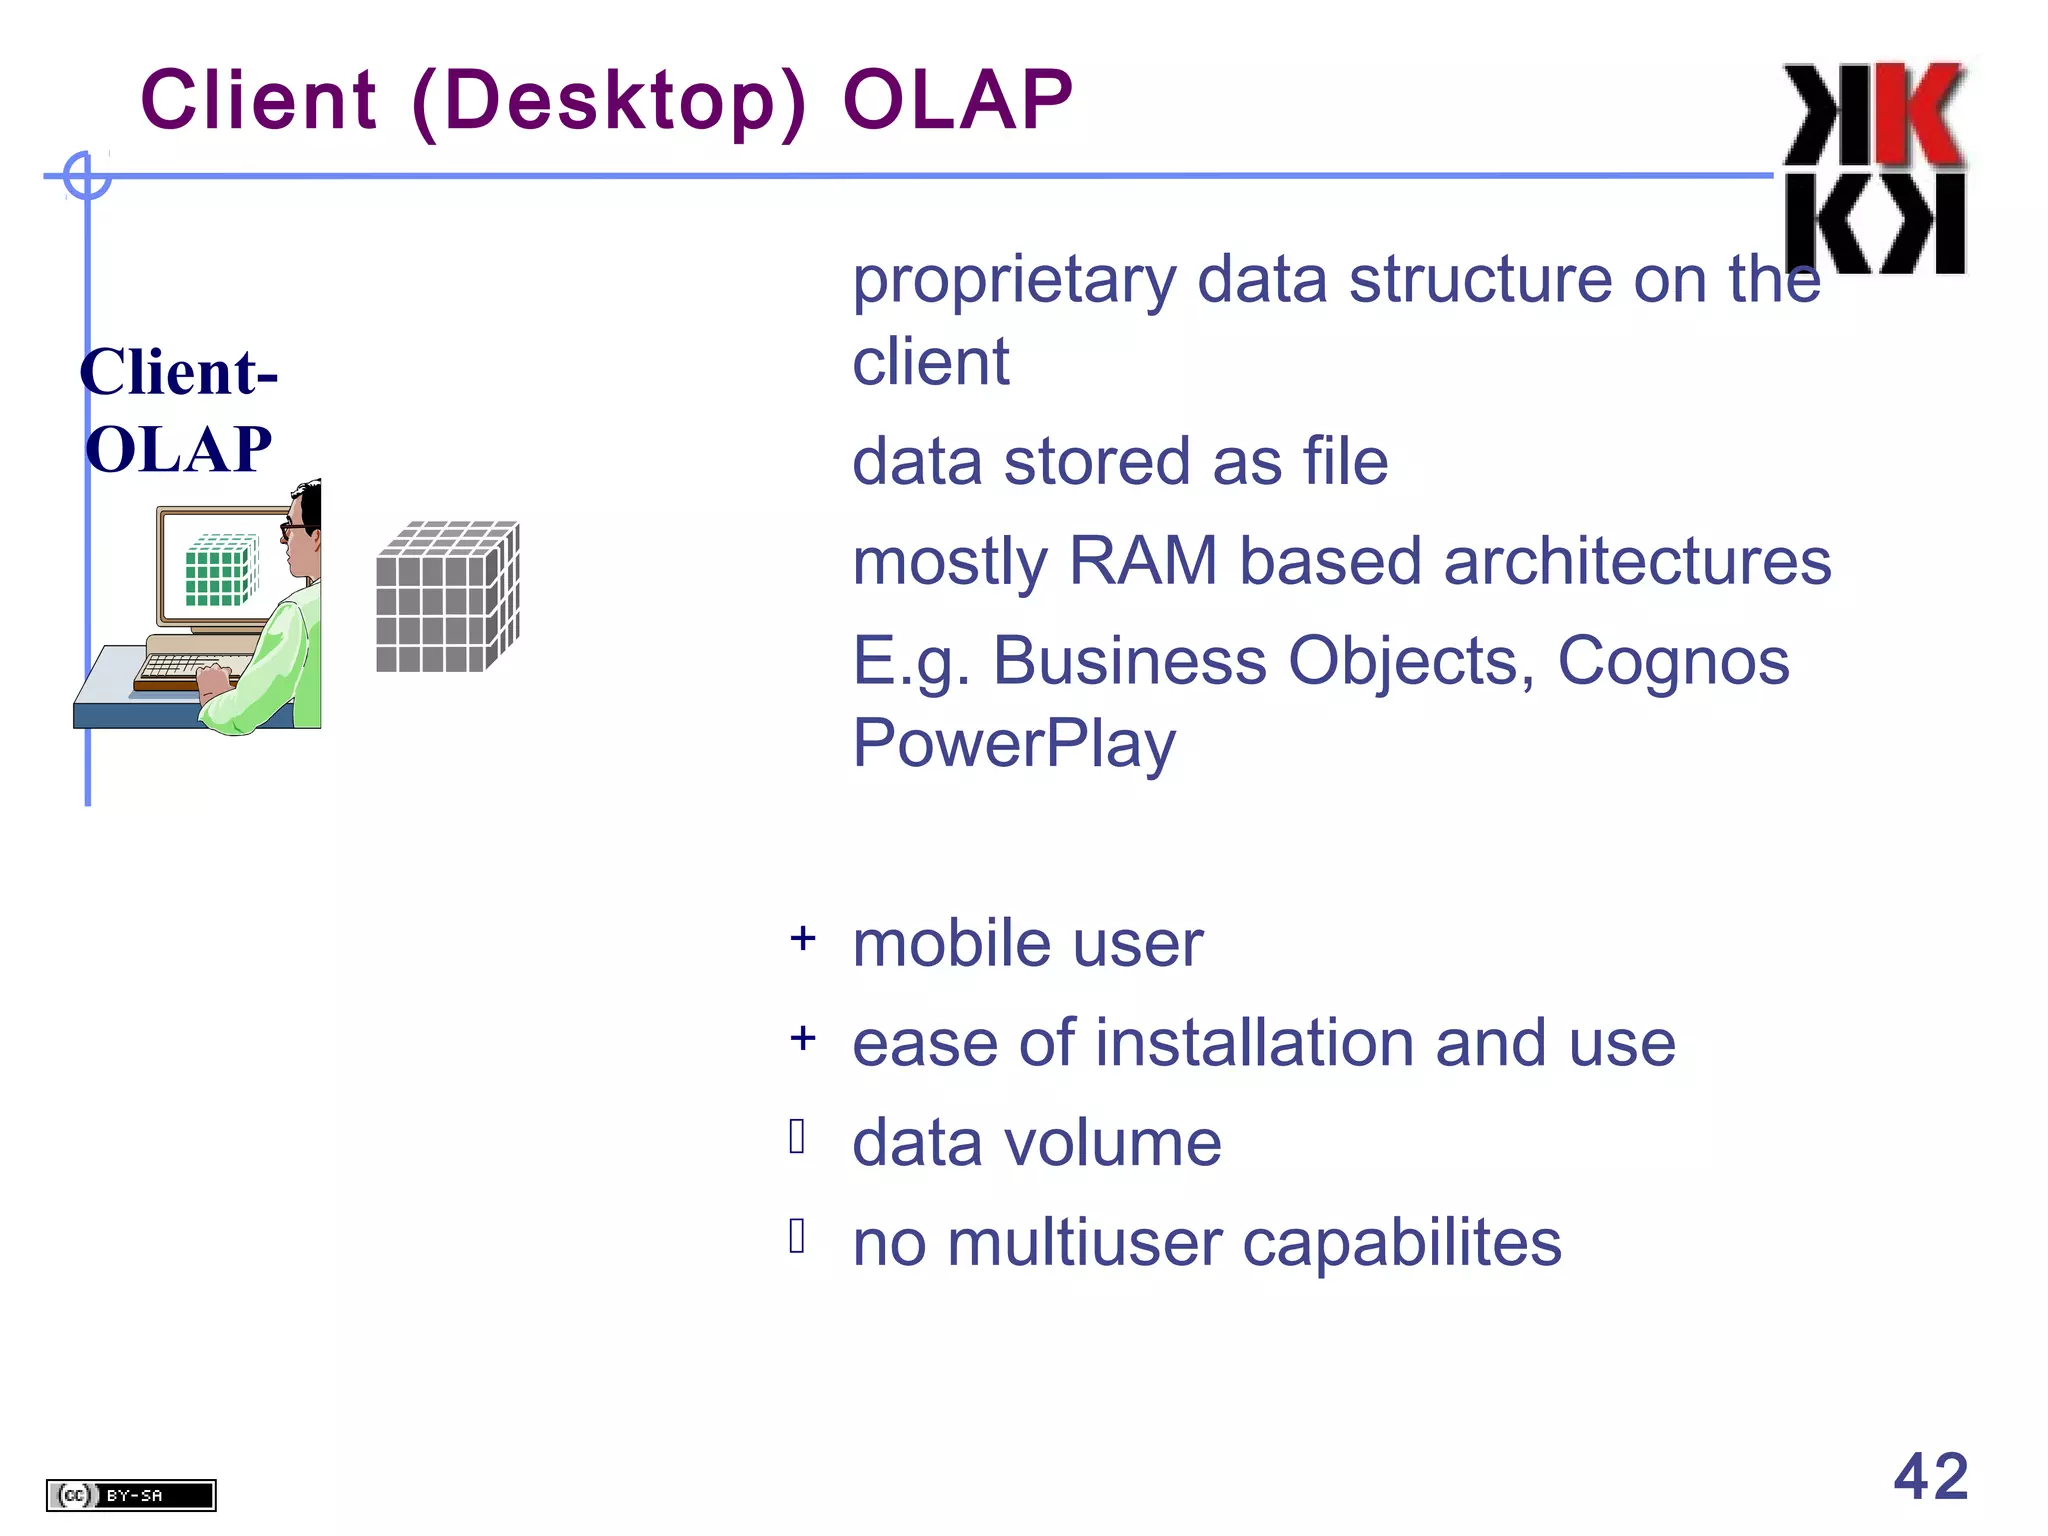
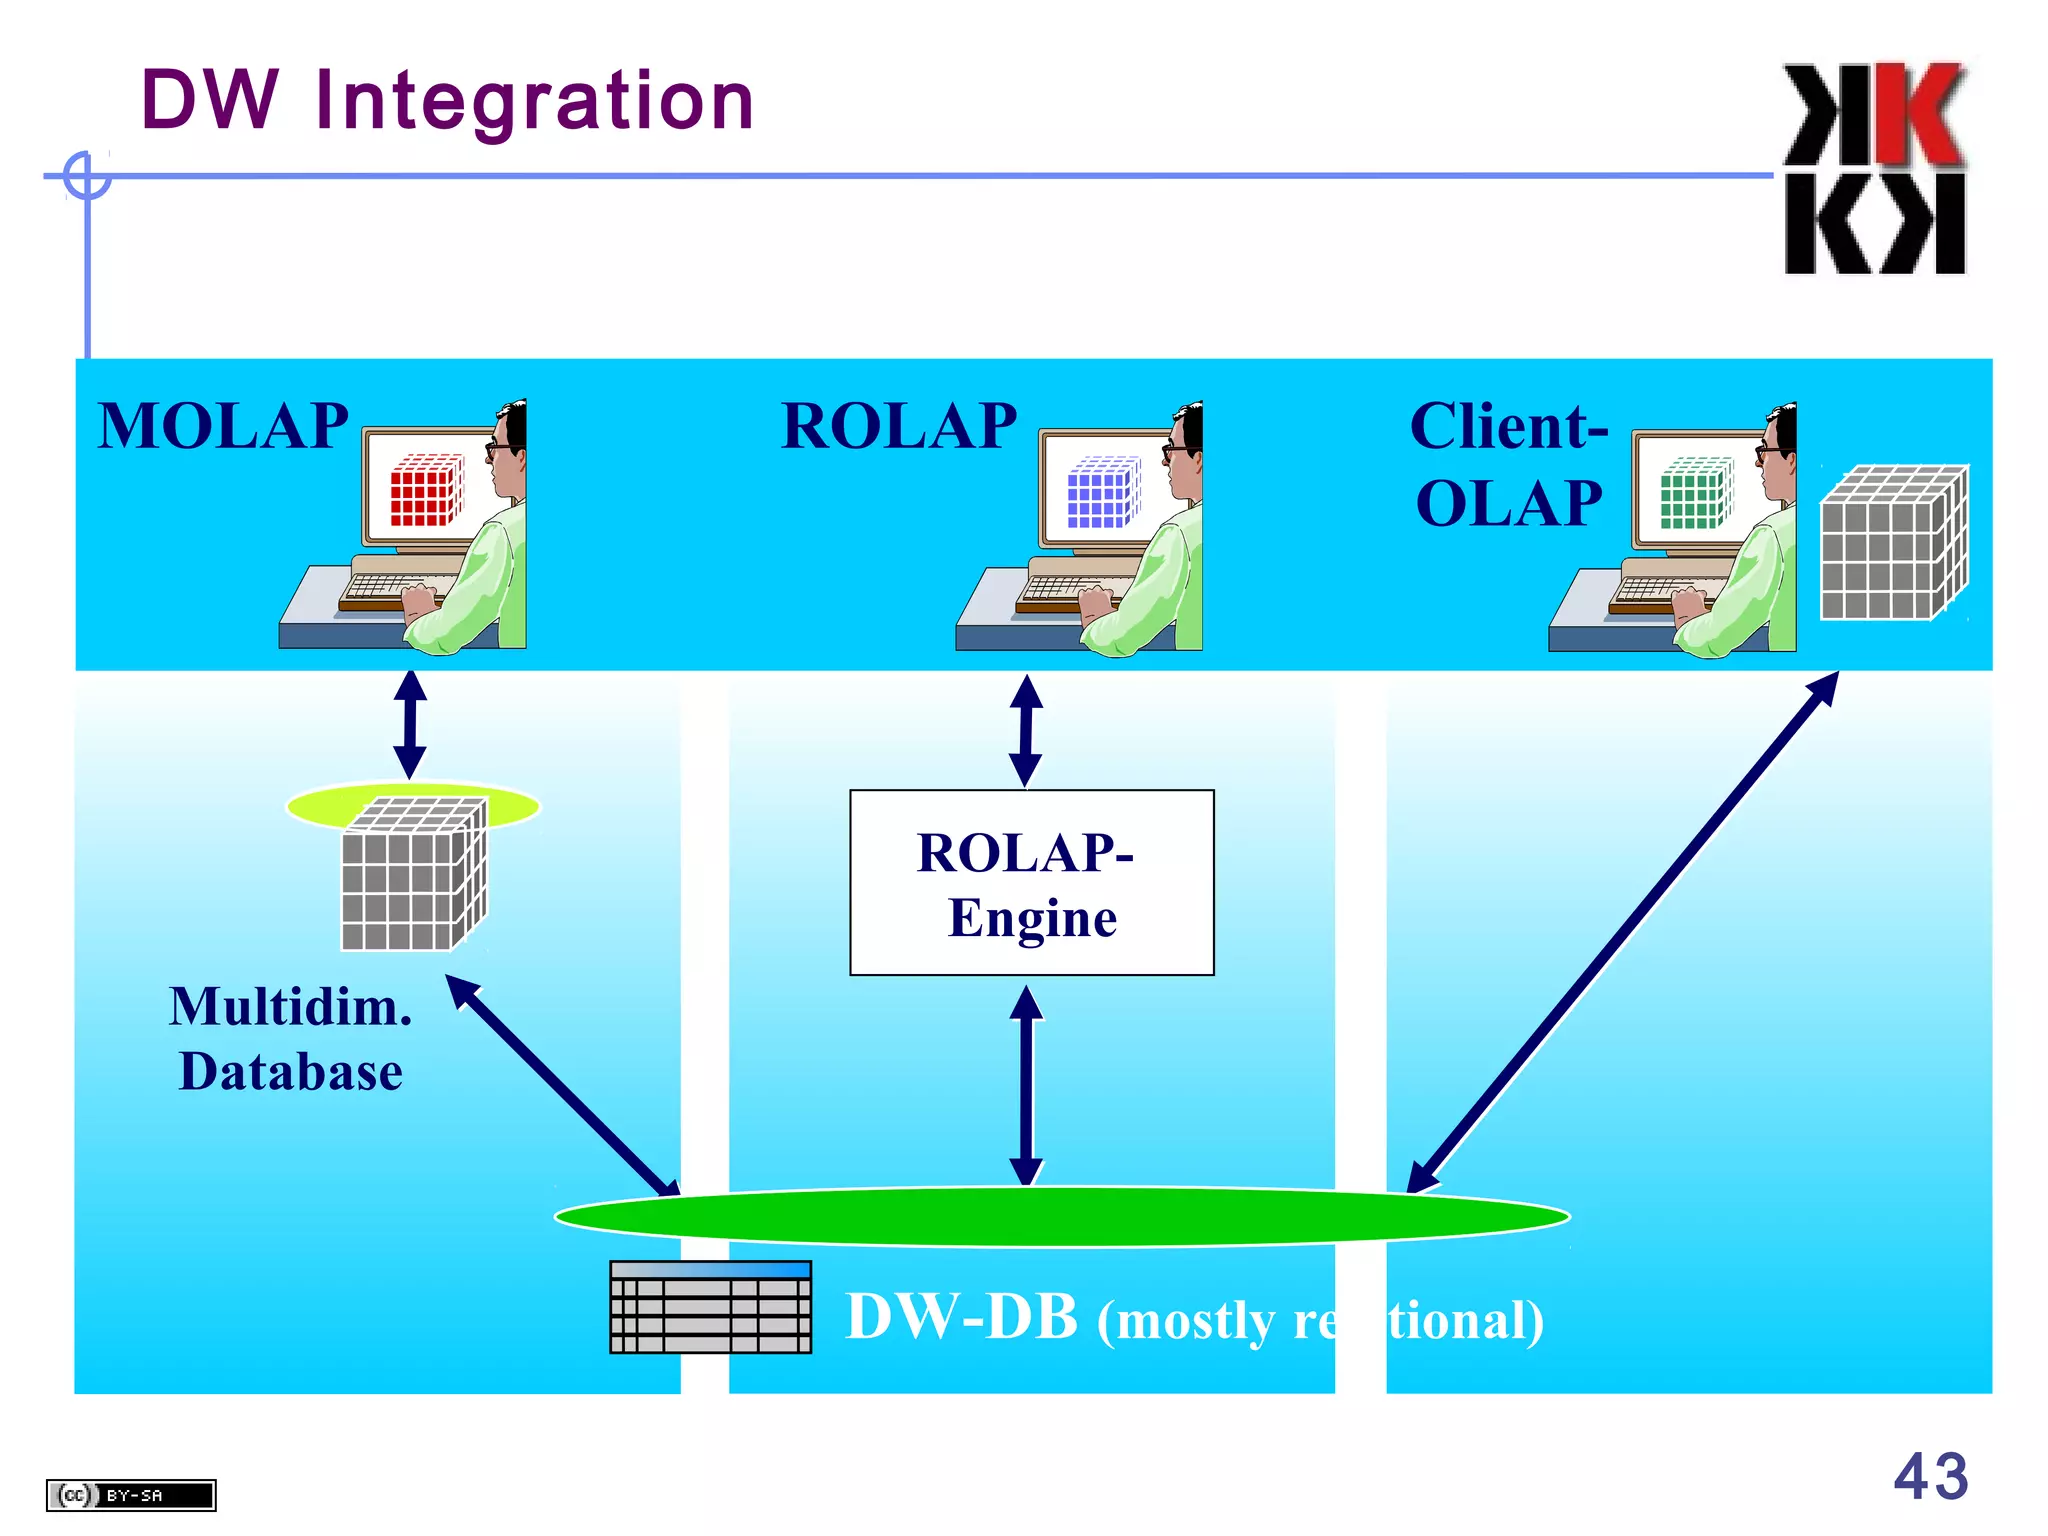
Business Information Systems

OLAP Cubes in Datawarehousing
Prithwis Mukerjee, Ph.D.

•Acknowledgement
•Hector Garcia Molina – Stanford
•FORWISS - Bavarian Research Centre for Knowledge Based Systems
OLTP vs. OLAP
OLTP: On Line
Transaction Processing










Describes processing at
operational sites
Mostly updates
Many small transactions
Mb-Tb of data
Raw data
Clerical users
Up-to-date data
Consistency,
recoverability critical

OLAP: On Line
Analytical Processing









Describes processing
at warehouse
Mostly reads
Queries long, complex
Gb-Tb of data
Summarized,
consolidated data
Decision-makers,
analysts as users

2

2
Warehouse Models & Operators
Data Models




relations
stars & snowflakes
cubes

Operators





slice & dice
roll-up, drill down
pivoting
other

3

3
Star Schema Terms
Fact table
Dimension tables
Measures
product
prodId
name
price

sale
orderId
date
custId
prodId
storeId
qty
amt

customer
custId
name
address
city

store
storeId
city

4

4
Star

product

prodId
p1
p2

name price
bolt
10
nut
5

sale oderId date
o100 1/7/97
o102 2/7/97
105 3/8/97

customer

custId
53
81
111

store storeId
c1
c2
c3

custId
53
53
111

name
joe
fred
sally

prodId
p1
p2
p1

storeId
c1
c1
c3

address
10 main
12 main
80 willow

qty
1
2
5

city
nyc
sfo
la

amt
12
11
50

city
sfo
sfo
la

5

5
Dimension Hierarchies

sType
store

store storeId
s5
s7
s9

city
cityId
sfo
sfo
la

tId
t1
t2
t1

mgr
joe
fred
nancy

 snowflake schema
 constellations

region
sType tId
t1
t2
city

size
small
large

cityId pop
sfo
1M
la
5M

location
downtown
suburbs
regId
north
south

region regId
name
north cold region
south warm region

6

6
Cube

Fact table view:
sale

prodId
p1
p2
p1
p2

storeId
c1
c1
c3
c2

Multi-dimensional cube:
amt
12
11
50
8

p1
p2

c1
12
11

c2

c3
50

8

dimensions = 2

7

7
3-D Cube

Fact table view:
sale

prodId
p1
p2
p1
p2
p1
p1

storeId
c1
c1
c3
c2
c1
c2

Multi-dimensional cube:
date
1
1
1
1
2
2

amt
12
11
50
8
44
4

day 2
day 1

p1
p2 c1
p1
12
p2
11

c1
44

c2
4
c2

c3
c3
50

8

dimensions = 3

8

8
ROLAP vs. MOLAP
ROLAP:
Relational On-Line Analytical Processing
MOLAP:
Multi-Dimensional On-Line Analytical Processing

9

9
Aggregates

• Add up amounts for day 1
• In SQL: SELECT sum(amt) FROM SALE
WHERE date = 1
sale

prodId storeId
p1
c1
p2
c1
p1
c3
p2
c2
p1
c1
p1
c2

date
1
1
1
1
2
2

amt
12
11
50
8
44
4

81

10

10
Aggregates

• Add up amounts by day
• In SQL: SELECT date, sum(amt) FROM SALE
GROUP BY date
sale

prodId storeId
p1
c1
p2
c1
p1
c3
p2
c2
p1
c1
p1
c2

date
1
1
1
1
2
2

amt
12
11
50
8
44
4

ans

date
1
2

11

sum
81
48

11
Another Example

• Add up amounts by day, product
• In SQL: SELECT date, sum(amt) FROM SALE
GROUP BY date, prodId
sale

prodId storeId
p1
c1
p2
c1
p1
c3
p2
c2
p1
c1
p1
c2

date
1
1
1
1
2
2

amt
12
11
50
8
44
4

sale

prodId
p1
p2
p1

date
1
1
2

amt
62
19
48

rollup
drill-down
12

12
Aggregates
Operators: sum, count, max, min,
median, ave
“Having” clause
Using dimension hierarchy



average by region (within store)
maximum by month (within date)

13

13
Cube Aggregation

day 2
day 1

p1
p2 c1
p1
12
p2
11

p1
p2

c1
56
11

c1
44

c2
4
c2

c3

Example: computing sums
...

c3
50

8

c2
4
8

rollup
drill-down

c3
50

sum

c1
67

c2
12

c3
50

129
p1
p2

sum
110
19

14

14
Cube Operators

day 2
day 1

p1
p2 c1
p1
12
p2
11

p1
p2

c1
56
11

c1
44

c2
4
c2

c3

...

c3
50

sale(c1,*,*)

8

c2
4
8

c3
50

sale(c2,p2,*)

sum

c1
67

c2
12

c3
50

129
p1
p2

sum
110
19

sale(*,*,*)
15

15
Extended Cube

c2
4
8
12
c3

p1
p2
c1
*
12

p1
p2
*
c1
44

c1
56
11
67
c2
4

c2
44

c3
4
50

11
23

8
8

50

*
62
19
81

*

day 2

day 1

p1
p2
*

c3
50

* 50
48
48

*
110
19
129

sale(*,p2,*)

16

16
Aggregation Using Hierarchies

day 2
day 1

p1
p2 c1
p1
12
p2
11

c1
44

c2
4
c2

c3
c3
50

8

customer
region
country

p1
p2

region A
56
11

region B
54
8

(customer c1 in Region A;
customers c2, c3 in Region B)

17

17
Pivoting

Fact table view:
sale

prodId storeId
p1
c1
p2
c1
p1
c3
p2
c2
p1
c1
p1
c2

Multi-dimensional cube:
date
1
1
1
1
2
2

amt
12
11
50
8
44
4

day 2
day 1

p1
p2 c1
p1
12
p2
11

p1
p2

c1
56
11

c1
44

c2
4
c2

c3
c3
50

8

c2
4
8

18

c3
50

18
What is a Multi-Dimensional
Database?
A multidimensional database (MDDB) is a computer
software system designed to allow for the efficient and
convenient storage and retrieval of large volumes of data that
are
• intimately related and
• stored, viewed and analyzed from different perspectives.
These perspectives are called dimensions.

19
Relational and Multi-Dimensional
Models: An Example

2

SALES VOLUMES FOR GLEASON DEALERSHIP
MODEL
MINI VAN
MINI VAN
MINI VAN
SPORTS COUPE
SPORTS COUPE
SPORTS COUPE
SEDAN
SEDAN
SEDAN

COLOR
BLUE
RED
WHITE
BLUE
RED
WHITE
BLUE
RED
WHITE

SALES VOLUME
6
5
4
3
5
5
4
3
2

The Relational Structure
20
Multidimentional Structure

Sales Volumes

Dimension

Mini Van

6

5

4

Coupe

3

5

5

Sedan

4

3

2

Blue

M
O
D
E
L

Red

White

COLOR

Positions

Measurement

Dimension

21
The “Classic” Star Scheme

Fact Table
Store Dimension
STORE KEY
Store Description
City
State
District ID
District Desc.
Region_ID
Region Desc.
Regional Mgr.

STORE KEY
PRODUCT KEY
PERIOD KEY
Dollars
Units
Price

Product Dimension
PRODUCT KEY

Time Dimension
PERIOD KEY
Period Desc
Year
Quarter
Month
Day

Product Desc.
Brand
Color
Size
Manufacturer

22
Differences between MDDB and
Relational Databases
Normalized Relational

MDDB

Data reorganized based on
query. Perspectives are placed
in the fields – tells us nothing
about the contents

Perspectives embedded directly
in the structure.

Browsing and data manipulation Data retrieval and manipulation
are not intuitive to user
are easy
Slows down for large datasets
Fast retrieval for large datasets
due to multiple JOIN operations due to predefined structure.
needed.
Flexible. Anything an MDDB
can do, can be done this way.

Relatively Inflexible. Changes in
perspectives necessitate
reprogramming of structure.

23
Relational Model and Multi
Dimensional Databases -Example 2
SALES VOLUMES FOR ALL DEALERSHIPS
MODEL
MINI VAN
MINI VAN
MINI VAN
MINI VAN
MINI VAN
MINI VAN
MINI VAN
MINI VAN
MINI VAN
SPORTS COUPE
SPORTS COUPE
SPORTS COUPE
SPORTS COUPE
SPORTS COUPE
SPORTS COUPE
SPORTS COUPE
SPORTS COUPE
SPORTS COUPE
SEDAN
SEDAN
SEDAN
SEDAN
SEDAN
SEDAN
SEDAN
SEDAN
SEDAN

COLOR
BLUE
BLUE
BLUE
RED
RED
RED
WHITE
WHITE
WHITE
BLUE
BLUE
BLUE
RED
RED
RED
WHITE
WHITE
WHITE
BLUE
BLUE
BLUE
RED
RED
RED
WHITE
WHITE
WHITE

DEALERSHIP
CLYDE
GLEASON
CARR
CLYDE
GLEASON
CARR
CLYDE
GLEASON
CARR
CLYDE
GLEASON
CARR
CLYDE
GLEASON
CARR
CLYDE
GLEASON
CARR
CLYDE
GLEASON
CARR
CLYDE
GLEASON
CARR
CLYDE
GLEASON
CARR

VOLUME
6
6
2
3
5
5
2
4
3
2
3
2
7
5
2
4
5
1
6
4
2
1
3
4
2
2
3

24
Mutlidimensional Representation

Sales Volumes

M
O
D
E
L

Mini Van
Coupe
Carr
Gleason
Clyde

Sedan
Blue

Red

DEALERSHIP

White

COLOR

25
Viewing Data - An Example

Sales Volumes

M
O
D
E
L
DEALERSHIP
COLOR

•Assume that each dimension has 10 positions, as shown in the cube above
•How many records would be there in a relational table?
•Implications for viewing data from an end-user standpoint?

26
Adding Dimensions- An Example

Sales Volumes
M
O
D
E
L

Mini Van

Mini Van

Coupe

Mini Van

Coupe
Carr
Gleason
Clyde

Sedan
Blue

Red

White

COLOR

JANUARY

Coupe
Carr
Gleason
Clyde

Sedan
Blue

Red

White

COLOR

FEBRUARY

Carr
Gleason
Clyde

Sedan
Blue

Red

DEALERSHIP

White

COLOR

MARCH

27
3
When is MDD (In)appropriate?

First, consider situation 1
PERSONNEL
LAST NAME
SMITH
REGAN
FOX
WELD
KELLY
LINK
KRANZ
LUCUS
WEISS

EMPLOYEE#
01
12
31
14
54
03
41
33
23

EMPLOYEE AGE
21
19
63
31
27
56
45
41
19

28
When is MDD (In)appropriate?

Now consider situation 2

SALES VOLUMES FOR GLEASON DEALERSHIP
MODEL
MINI VAN
MINI VAN
MINI VAN
SPORTS COUPE
SPORTS COUPE
SPORTS COUPE
SEDAN
SEDAN
SEDAN

COLOR
BLUE
RED
WHITE
BLUE
RED
WHITE
BLUE
RED
WHITE

VOLUME
6
5
4
3
5
5
4
3
2

1. Set up a MDD structure for situation 1, with LAST NAME
and Employee# as dimensions, and AGE as the measurement.
2. Set up a MDD structure for situation 2, with MODEL and
COLOR as dimensions, and SALES VOLUME as the measurement .

29
When is MDD (In)appropriate?

MDD Structures for the Situations
Employee Age
Smith

21

Regan

Sales Volumes
Miini Van

6

5

4

Coupe

3

5

5

4

3

2

Blue

M
O
D
E
L

Red

White

Sedan

Fox

L
A
S
T
N
A
M
E

19
63

Weld

31

Kelly

27

Link

56

Kranz

45

COLOR
Lucas

41

Weiss

19
31

41

23

01

14

54

03

12

33

EMPLOYEE #

Note the sparseness in the second MDD representation
30
When is MDD (In)appropriate?
Highly interrelated dataset types be placed in a
multidimensional data structure for greatest ease of
access and analysis. When there are no
interrelationships, the MDD structure is not appropriate.

31
4

MDD Features - Rotation

Sales Volumes

Mini Van

6

5

4

Coupe

3

5

5

Sedan

4

3

2

Blue

M
O
D
E
L

Red

White

COLOR

View #1

C
O
L
O
R
o

( ROTATE 90 )

Blue

6

3

4

Red

5

5

3

White

4

5

2

Mini Van Coupe

Sedan

MODEL

View #2

•Also referred to as “data slicing.”
•Each rotation yields a different slice or two dimensional table
of data – a different face of the cube.

32
MDD Features - Rotation

Sales Volumes

M
O
D
E
L

C
O
L
O
R

Mini Van
Coupe
Carr
Gleason
Clyde

Sedan
Blue

Red

Red
Carr
Gleason
Clyde

White
Sedan

White

COLOR

Coupe

D
E
A
L
E
R
S
H
I
P

Gleason
Mini Van
Coupe
Sedan
White

Red

Blue

COLOR

DEALERSHIP

o

o

( ROTATE 90 )

MODEL

View #3

Carr

M
O
D
E
L

Gleason
Blue
Red
White

Clyde
Mini Van Coupe Sedan

o

( ROTATE 90 )

MODEL

MODEL

View #4

Gleason Clyde

( ROTATE 90 )

View #2

Carr

Mini Van
Coupe
Sedan

DEALERSHIP

View #1

Clyde

Red
White
Carr

MODEL

o

( ROTATE 90 )

Blue

Mini Van

DEALERSHIP

D
E
A
L
E
R
S
H
I
P

C
O
L
O
R

Blue

Mini Van
Coupe
Blue
Red
White

Sedan
Clyde Gleason Carr

o

DEALERSHIP

( ROTATE 90 )

COLOR

View #5

COLOR

View #6

33
MDD Features - Ranging

Sales Volumes

M
O
D
E
L

Mini Van

Mini Van
Coupe

Coupe

Normal
Blue

Carr
Clyde

Normal
Blue

Metal
Blue

Carr
Clyde
Metal
Blue

DEALERSHIP

COLOR

• The end user selects the desired positions along each dimension.
• Also referred to as "data dicing."
• The data is scoped down to a subset grouping

34
MDD Features - Roll-Ups & Drill
Downs
ORGANIZATION DIMENSION
Midwest

REGION

DISTRICT
DEALERSHIP

Chicago
Clyde

Gleason

St. Louis
Carr

Levi

Gary
Lucas

Bolton

• The figure presents a definition of a hierarchy within the
organization dimension.
• Aggregations perceived as being part of the same dimension.
• Moving up and moving down levels in a hierarchy is referred to
as “roll-up” and “drill-down.”

35
The Time Dimension

TIME as a predefined hierarchy for rolling-up and
drilling-down across days, weeks, months, years and
special periods, such as fiscal years.




Eliminates the effort required to build sophisticated
hierarchies every time a database is set up.
Extra performance advantages

36
Pros/Cons of MDD

5

Cognitive Advantages for the User
Ease of Data Presentation and Navigation,
Time dimension
Performance
Less flexible
Requires greater initial effort

37
Multidimensional OLAP (MOLAP)

Frontend
Tool

specialized database technology
multidimensional storage structures
E.g. Hyperion Essbase, Oracle
Express, Cognos PowerPlay (Server)
Query Performance
Powerful MD Model


write access

Database Features
 multiuser access/ backup and recovery

Multidim.
Database

Sparsity Handling -> DB Explosion

38
MOLAP Server

ty

Multi-Dimensional OLAP Server
Sales

M.D. tools

Product

Ci

B
A

milk
soda
eggs
soap

1

utilities

multidimensional
server

2 3 4
Date

could also
sit on
relational
DBMS

39

39
Relational OLAP (ROLAP)
idea: use relational data
storage
star (snowflake) schema
E.g. Microstrategy, SAP BW
+ advantages of RDBMS

Frontend
Tool

MDInterface

ROLAPEngine
SQL

+

Meta Data

+




scalability, reliability, security
etc.

Sparsity handling
Query Performance
Data Model Complexity
no write access

Relational DB
40
ROLAP Server
Relational OLAP Server
sale

prodId
p1
p2
p1

date
1
1
2

sum
62
19
48

tools

utilities

ROLAP
server

Special indices, tuning;
Schema is “denormalized”

relational
DBMS
41

41
Client (Desktop) OLAP
proprietary data structure on the
client
data stored as file
mostly RAM based architectures
E.g. Business Objects, Cognos
PowerPlay

ClientOLAP

+
+



mobile user
ease of installation and use
data volume
no multiuser capabilites
42
DW Integration

MOLAP

ROLAP

ClientOLAP

ROLAPEngine
Multidim.
Database

DW-DB (mostly relational)
43

05 OLAP v6 weekend

  • 1.
    Business Information Systems OLAPCubes in Datawarehousing Prithwis Mukerjee, Ph.D. •Acknowledgement •Hector Garcia Molina – Stanford •FORWISS - Bavarian Research Centre for Knowledge Based Systems
  • 2.
    OLTP vs. OLAP OLTP:On Line Transaction Processing         Describes processing at operational sites Mostly updates Many small transactions Mb-Tb of data Raw data Clerical users Up-to-date data Consistency, recoverability critical OLAP: On Line Analytical Processing       Describes processing at warehouse Mostly reads Queries long, complex Gb-Tb of data Summarized, consolidated data Decision-makers, analysts as users 2 2
  • 3.
    Warehouse Models &Operators Data Models    relations stars & snowflakes cubes Operators     slice & dice roll-up, drill down pivoting other 3 3
  • 4.
    Star Schema Terms Facttable Dimension tables Measures product prodId name price sale orderId date custId prodId storeId qty amt customer custId name address city store storeId city 4 4
  • 5.
    Star product prodId p1 p2 name price bolt 10 nut 5 sale oderIddate o100 1/7/97 o102 2/7/97 105 3/8/97 customer custId 53 81 111 store storeId c1 c2 c3 custId 53 53 111 name joe fred sally prodId p1 p2 p1 storeId c1 c1 c3 address 10 main 12 main 80 willow qty 1 2 5 city nyc sfo la amt 12 11 50 city sfo sfo la 5 5
  • 6.
    Dimension Hierarchies sType store store storeId s5 s7 s9 city cityId sfo sfo la tId t1 t2 t1 mgr joe fred nancy snowflake schema  constellations region sType tId t1 t2 city size small large cityId pop sfo 1M la 5M location downtown suburbs regId north south region regId name north cold region south warm region 6 6
  • 7.
    Cube Fact table view: sale prodId p1 p2 p1 p2 storeId c1 c1 c3 c2 Multi-dimensionalcube: amt 12 11 50 8 p1 p2 c1 12 11 c2 c3 50 8 dimensions = 2 7 7
  • 8.
    3-D Cube Fact tableview: sale prodId p1 p2 p1 p2 p1 p1 storeId c1 c1 c3 c2 c1 c2 Multi-dimensional cube: date 1 1 1 1 2 2 amt 12 11 50 8 44 4 day 2 day 1 p1 p2 c1 p1 12 p2 11 c1 44 c2 4 c2 c3 c3 50 8 dimensions = 3 8 8
  • 9.
    ROLAP vs. MOLAP ROLAP: RelationalOn-Line Analytical Processing MOLAP: Multi-Dimensional On-Line Analytical Processing 9 9
  • 10.
    Aggregates • Add upamounts for day 1 • In SQL: SELECT sum(amt) FROM SALE WHERE date = 1 sale prodId storeId p1 c1 p2 c1 p1 c3 p2 c2 p1 c1 p1 c2 date 1 1 1 1 2 2 amt 12 11 50 8 44 4 81 10 10
  • 11.
    Aggregates • Add upamounts by day • In SQL: SELECT date, sum(amt) FROM SALE GROUP BY date sale prodId storeId p1 c1 p2 c1 p1 c3 p2 c2 p1 c1 p1 c2 date 1 1 1 1 2 2 amt 12 11 50 8 44 4 ans date 1 2 11 sum 81 48 11
  • 12.
    Another Example • Addup amounts by day, product • In SQL: SELECT date, sum(amt) FROM SALE GROUP BY date, prodId sale prodId storeId p1 c1 p2 c1 p1 c3 p2 c2 p1 c1 p1 c2 date 1 1 1 1 2 2 amt 12 11 50 8 44 4 sale prodId p1 p2 p1 date 1 1 2 amt 62 19 48 rollup drill-down 12 12
  • 13.
    Aggregates Operators: sum, count,max, min, median, ave “Having” clause Using dimension hierarchy   average by region (within store) maximum by month (within date) 13 13
  • 14.
    Cube Aggregation day 2 day1 p1 p2 c1 p1 12 p2 11 p1 p2 c1 56 11 c1 44 c2 4 c2 c3 Example: computing sums ... c3 50 8 c2 4 8 rollup drill-down c3 50 sum c1 67 c2 12 c3 50 129 p1 p2 sum 110 19 14 14
  • 15.
    Cube Operators day 2 day1 p1 p2 c1 p1 12 p2 11 p1 p2 c1 56 11 c1 44 c2 4 c2 c3 ... c3 50 sale(c1,*,*) 8 c2 4 8 c3 50 sale(c2,p2,*) sum c1 67 c2 12 c3 50 129 p1 p2 sum 110 19 sale(*,*,*) 15 15
  • 16.
  • 17.
    Aggregation Using Hierarchies day2 day 1 p1 p2 c1 p1 12 p2 11 c1 44 c2 4 c2 c3 c3 50 8 customer region country p1 p2 region A 56 11 region B 54 8 (customer c1 in Region A; customers c2, c3 in Region B) 17 17
  • 18.
    Pivoting Fact table view: sale prodIdstoreId p1 c1 p2 c1 p1 c3 p2 c2 p1 c1 p1 c2 Multi-dimensional cube: date 1 1 1 1 2 2 amt 12 11 50 8 44 4 day 2 day 1 p1 p2 c1 p1 12 p2 11 p1 p2 c1 56 11 c1 44 c2 4 c2 c3 c3 50 8 c2 4 8 18 c3 50 18
  • 19.
    What is aMulti-Dimensional Database? A multidimensional database (MDDB) is a computer software system designed to allow for the efficient and convenient storage and retrieval of large volumes of data that are • intimately related and • stored, viewed and analyzed from different perspectives. These perspectives are called dimensions. 19
  • 20.
    Relational and Multi-Dimensional Models:An Example 2 SALES VOLUMES FOR GLEASON DEALERSHIP MODEL MINI VAN MINI VAN MINI VAN SPORTS COUPE SPORTS COUPE SPORTS COUPE SEDAN SEDAN SEDAN COLOR BLUE RED WHITE BLUE RED WHITE BLUE RED WHITE SALES VOLUME 6 5 4 3 5 5 4 3 2 The Relational Structure 20
  • 21.
    Multidimentional Structure Sales Volumes Dimension MiniVan 6 5 4 Coupe 3 5 5 Sedan 4 3 2 Blue M O D E L Red White COLOR Positions Measurement Dimension 21
  • 22.
    The “Classic” StarScheme Fact Table Store Dimension STORE KEY Store Description City State District ID District Desc. Region_ID Region Desc. Regional Mgr. STORE KEY PRODUCT KEY PERIOD KEY Dollars Units Price Product Dimension PRODUCT KEY Time Dimension PERIOD KEY Period Desc Year Quarter Month Day Product Desc. Brand Color Size Manufacturer 22
  • 23.
    Differences between MDDBand Relational Databases Normalized Relational MDDB Data reorganized based on query. Perspectives are placed in the fields – tells us nothing about the contents Perspectives embedded directly in the structure. Browsing and data manipulation Data retrieval and manipulation are not intuitive to user are easy Slows down for large datasets Fast retrieval for large datasets due to multiple JOIN operations due to predefined structure. needed. Flexible. Anything an MDDB can do, can be done this way. Relatively Inflexible. Changes in perspectives necessitate reprogramming of structure. 23
  • 24.
    Relational Model andMulti Dimensional Databases -Example 2 SALES VOLUMES FOR ALL DEALERSHIPS MODEL MINI VAN MINI VAN MINI VAN MINI VAN MINI VAN MINI VAN MINI VAN MINI VAN MINI VAN SPORTS COUPE SPORTS COUPE SPORTS COUPE SPORTS COUPE SPORTS COUPE SPORTS COUPE SPORTS COUPE SPORTS COUPE SPORTS COUPE SEDAN SEDAN SEDAN SEDAN SEDAN SEDAN SEDAN SEDAN SEDAN COLOR BLUE BLUE BLUE RED RED RED WHITE WHITE WHITE BLUE BLUE BLUE RED RED RED WHITE WHITE WHITE BLUE BLUE BLUE RED RED RED WHITE WHITE WHITE DEALERSHIP CLYDE GLEASON CARR CLYDE GLEASON CARR CLYDE GLEASON CARR CLYDE GLEASON CARR CLYDE GLEASON CARR CLYDE GLEASON CARR CLYDE GLEASON CARR CLYDE GLEASON CARR CLYDE GLEASON CARR VOLUME 6 6 2 3 5 5 2 4 3 2 3 2 7 5 2 4 5 1 6 4 2 1 3 4 2 2 3 24
  • 25.
    Mutlidimensional Representation Sales Volumes M O D E L MiniVan Coupe Carr Gleason Clyde Sedan Blue Red DEALERSHIP White COLOR 25
  • 26.
    Viewing Data -An Example Sales Volumes M O D E L DEALERSHIP COLOR •Assume that each dimension has 10 positions, as shown in the cube above •How many records would be there in a relational table? •Implications for viewing data from an end-user standpoint? 26
  • 27.
    Adding Dimensions- AnExample Sales Volumes M O D E L Mini Van Mini Van Coupe Mini Van Coupe Carr Gleason Clyde Sedan Blue Red White COLOR JANUARY Coupe Carr Gleason Clyde Sedan Blue Red White COLOR FEBRUARY Carr Gleason Clyde Sedan Blue Red DEALERSHIP White COLOR MARCH 27
  • 28.
    3 When is MDD(In)appropriate? First, consider situation 1 PERSONNEL LAST NAME SMITH REGAN FOX WELD KELLY LINK KRANZ LUCUS WEISS EMPLOYEE# 01 12 31 14 54 03 41 33 23 EMPLOYEE AGE 21 19 63 31 27 56 45 41 19 28
  • 29.
    When is MDD(In)appropriate? Now consider situation 2 SALES VOLUMES FOR GLEASON DEALERSHIP MODEL MINI VAN MINI VAN MINI VAN SPORTS COUPE SPORTS COUPE SPORTS COUPE SEDAN SEDAN SEDAN COLOR BLUE RED WHITE BLUE RED WHITE BLUE RED WHITE VOLUME 6 5 4 3 5 5 4 3 2 1. Set up a MDD structure for situation 1, with LAST NAME and Employee# as dimensions, and AGE as the measurement. 2. Set up a MDD structure for situation 2, with MODEL and COLOR as dimensions, and SALES VOLUME as the measurement . 29
  • 30.
    When is MDD(In)appropriate? MDD Structures for the Situations Employee Age Smith 21 Regan Sales Volumes Miini Van 6 5 4 Coupe 3 5 5 4 3 2 Blue M O D E L Red White Sedan Fox L A S T N A M E 19 63 Weld 31 Kelly 27 Link 56 Kranz 45 COLOR Lucas 41 Weiss 19 31 41 23 01 14 54 03 12 33 EMPLOYEE # Note the sparseness in the second MDD representation 30
  • 31.
    When is MDD(In)appropriate? Highly interrelated dataset types be placed in a multidimensional data structure for greatest ease of access and analysis. When there are no interrelationships, the MDD structure is not appropriate. 31
  • 32.
    4 MDD Features -Rotation Sales Volumes Mini Van 6 5 4 Coupe 3 5 5 Sedan 4 3 2 Blue M O D E L Red White COLOR View #1 C O L O R o ( ROTATE 90 ) Blue 6 3 4 Red 5 5 3 White 4 5 2 Mini Van Coupe Sedan MODEL View #2 •Also referred to as “data slicing.” •Each rotation yields a different slice or two dimensional table of data – a different face of the cube. 32
  • 33.
    MDD Features -Rotation Sales Volumes M O D E L C O L O R Mini Van Coupe Carr Gleason Clyde Sedan Blue Red Red Carr Gleason Clyde White Sedan White COLOR Coupe D E A L E R S H I P Gleason Mini Van Coupe Sedan White Red Blue COLOR DEALERSHIP o o ( ROTATE 90 ) MODEL View #3 Carr M O D E L Gleason Blue Red White Clyde Mini Van Coupe Sedan o ( ROTATE 90 ) MODEL MODEL View #4 Gleason Clyde ( ROTATE 90 ) View #2 Carr Mini Van Coupe Sedan DEALERSHIP View #1 Clyde Red White Carr MODEL o ( ROTATE 90 ) Blue Mini Van DEALERSHIP D E A L E R S H I P C O L O R Blue Mini Van Coupe Blue Red White Sedan Clyde Gleason Carr o DEALERSHIP ( ROTATE 90 ) COLOR View #5 COLOR View #6 33
  • 34.
    MDD Features -Ranging Sales Volumes M O D E L Mini Van Mini Van Coupe Coupe Normal Blue Carr Clyde Normal Blue Metal Blue Carr Clyde Metal Blue DEALERSHIP COLOR • The end user selects the desired positions along each dimension. • Also referred to as "data dicing." • The data is scoped down to a subset grouping 34
  • 35.
    MDD Features -Roll-Ups & Drill Downs ORGANIZATION DIMENSION Midwest REGION DISTRICT DEALERSHIP Chicago Clyde Gleason St. Louis Carr Levi Gary Lucas Bolton • The figure presents a definition of a hierarchy within the organization dimension. • Aggregations perceived as being part of the same dimension. • Moving up and moving down levels in a hierarchy is referred to as “roll-up” and “drill-down.” 35
  • 36.
    The Time Dimension TIMEas a predefined hierarchy for rolling-up and drilling-down across days, weeks, months, years and special periods, such as fiscal years.   Eliminates the effort required to build sophisticated hierarchies every time a database is set up. Extra performance advantages 36
  • 37.
    Pros/Cons of MDD 5 CognitiveAdvantages for the User Ease of Data Presentation and Navigation, Time dimension Performance Less flexible Requires greater initial effort 37
  • 38.
    Multidimensional OLAP (MOLAP) Frontend Tool specializeddatabase technology multidimensional storage structures E.g. Hyperion Essbase, Oracle Express, Cognos PowerPlay (Server) Query Performance Powerful MD Model  write access Database Features  multiuser access/ backup and recovery Multidim. Database Sparsity Handling -> DB Explosion 38
  • 39.
    MOLAP Server ty Multi-Dimensional OLAPServer Sales M.D. tools Product Ci B A milk soda eggs soap 1 utilities multidimensional server 2 3 4 Date could also sit on relational DBMS 39 39
  • 40.
    Relational OLAP (ROLAP) idea:use relational data storage star (snowflake) schema E.g. Microstrategy, SAP BW + advantages of RDBMS Frontend Tool MDInterface ROLAPEngine SQL + Meta Data +    scalability, reliability, security etc. Sparsity handling Query Performance Data Model Complexity no write access Relational DB 40
  • 41.
    ROLAP Server Relational OLAPServer sale prodId p1 p2 p1 date 1 1 2 sum 62 19 48 tools utilities ROLAP server Special indices, tuning; Schema is “denormalized” relational DBMS 41 41
  • 42.
    Client (Desktop) OLAP proprietarydata structure on the client data stored as file mostly RAM based architectures E.g. Business Objects, Cognos PowerPlay ClientOLAP + +   mobile user ease of installation and use data volume no multiuser capabilites 42
  • 43.

Editor's Notes

  • #23 The classic star schema is characterized by the following: A single “fact table” containing a compound primary key, with one segment for each “dimension,” and additional columns of additive, numeric facts A single “dimension” table (for each dimension) with a generated key, and a level indicator that describes the attribute level of each record. For example, if the dimension is STORE, records in the dimension table might refer to stores, districts or regions. We might assign a level number to these (such as 1=store, 2=district, 3=region) and put that value in the “level” column. The single fact table will contain detail (or “atomic”) data, such as sales dollars, for a given store, for a given product in a given time period. The fact table may also contain partially consolidated data, such as sales dollars for a region, for a given product for a given time period. Confusion is possible if ALL consolidated data isn’t included. For example, if data is consolidated only to the district level, a query for regional information will bring back no records and, hence, report no sales activity. For this reason, simple stars MUST contain either - ALL of the combinations of aggregated data or - At least views of every combination
  • #44 OLAP ist weitverbreitet: daher genauere Betrachtung der Architekturen: MOLAP: Benutzer greift eine spezielle Multidimensionale Datenbank zu. Diese kann seine Anfragen sehr performant beantworten, da sie extra für diesen Zweck optimiert ist. Daten werden häufig aus der zentralen DW-DB befüllt. ROLAP: Ausnutzung der relationalen Datenbank-Technologie. ROLAP Engine setzt multidim Operationen dynamisch in SQL um. DB Systeme nicht speziell für diese Anwendungs optimiert. Client-OLAP: Bildung des Würfels auf der Maschine des Benutzers. Persönlicher Würfel für jeden Benutzer, aber Kapazität!