Downloaded 567 times
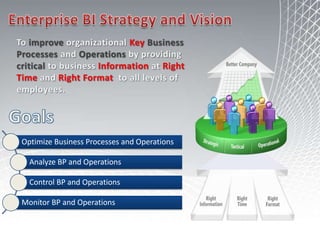
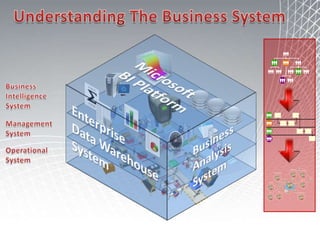
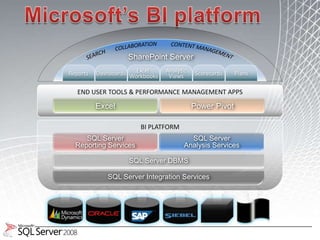
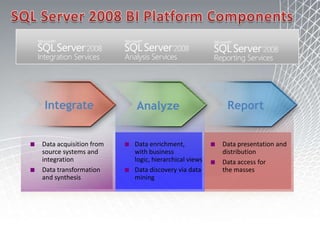
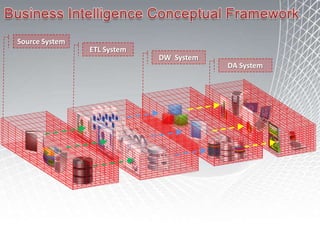
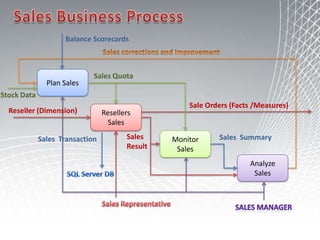
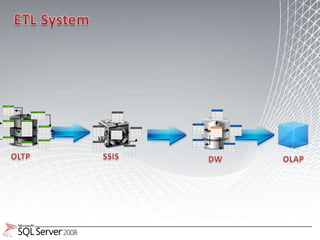
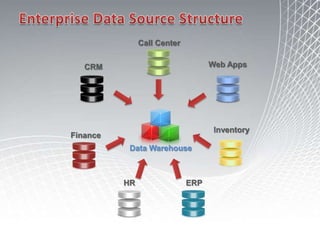
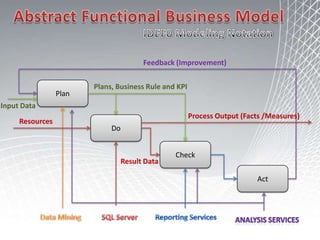
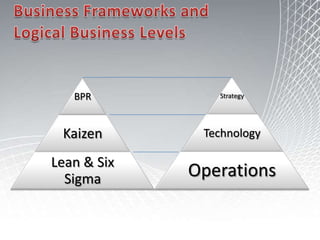
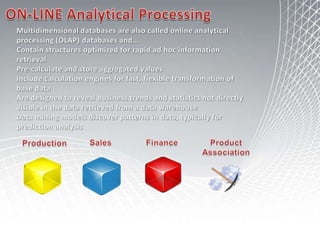

This document discusses business intelligence architecture and concepts. It covers topics like analysis services, SQL Server, data mining, integration services, and enterprise BI strategy and vision. It provides overviews of Microsoft's BI platform, conceptual frameworks, dimensional modeling, ETL processes, and data visualization systems. The goal is to improve organizational processes by providing critical business information to employees.