Downloaded 139 times

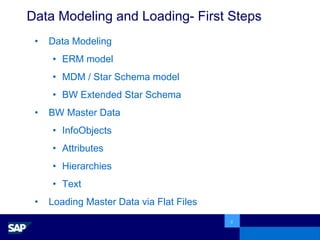
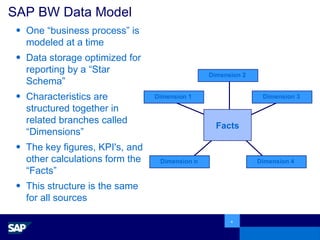
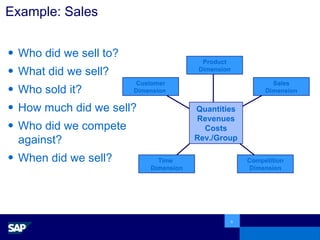
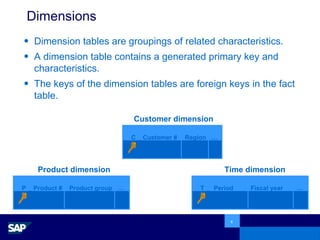
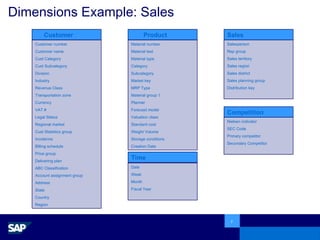
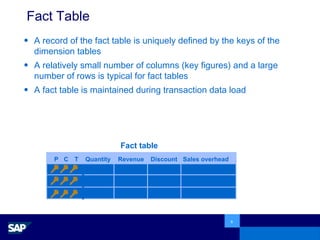
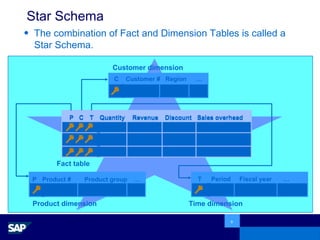
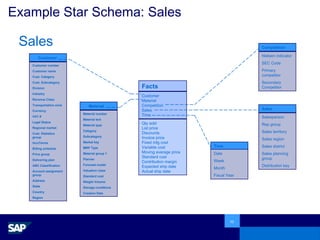
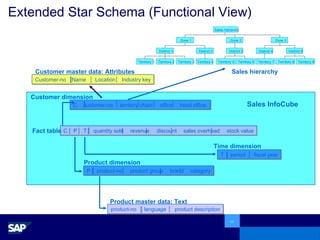
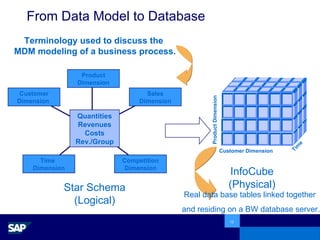
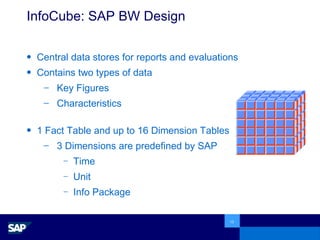

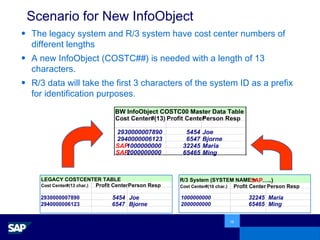
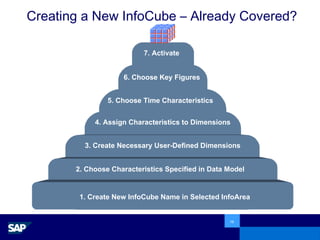

The document discusses data modeling and loading processes in SAP BW, including: - Modeling business processes using a star schema with dimensions and facts - Loading master and transactional data from flat files - Creating infoobjects, infocubes, and assigning characteristics and key figures


