Downloaded 887 times

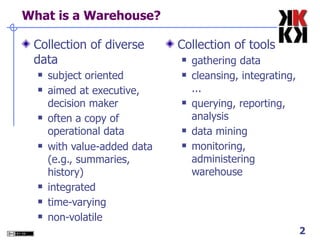
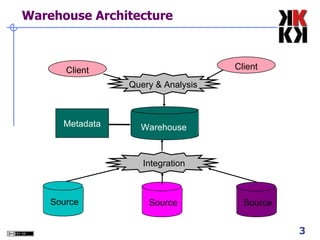
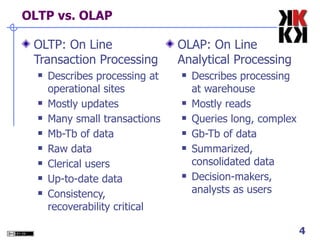
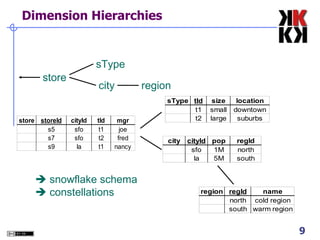
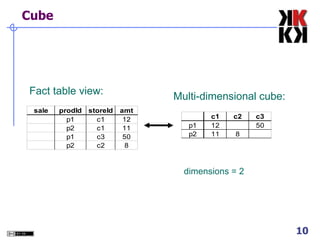
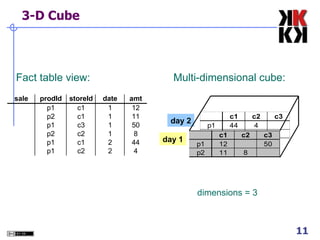
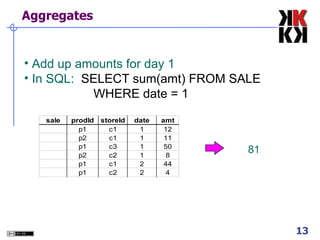
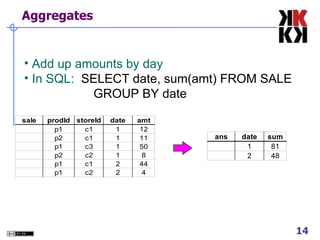
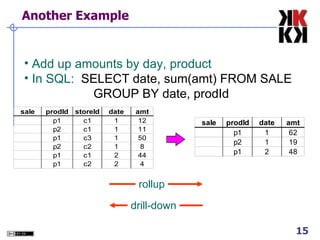
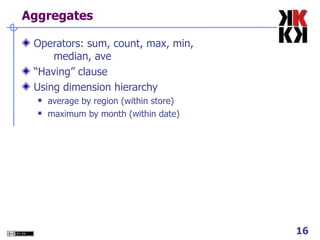
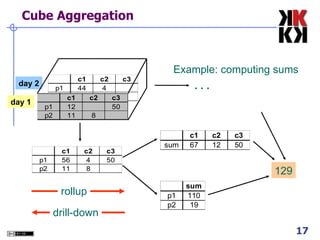
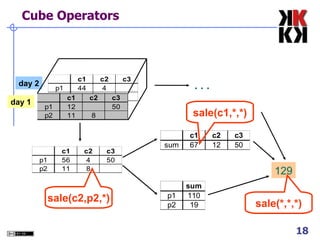
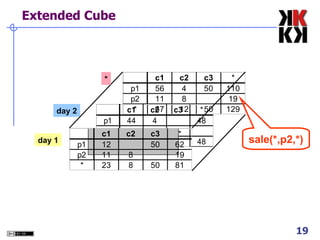
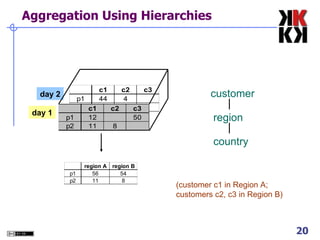
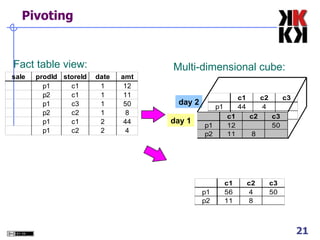
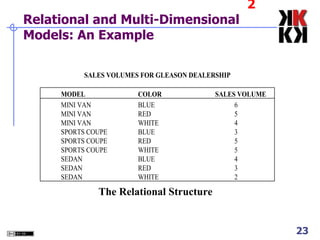
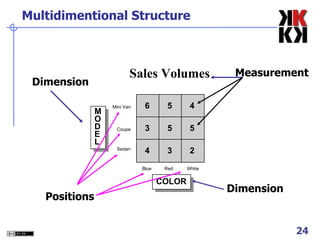
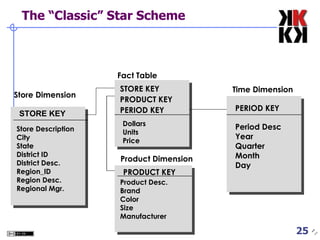
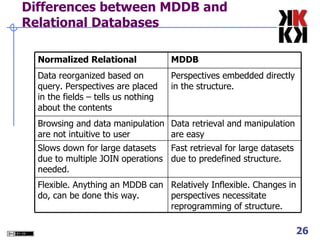
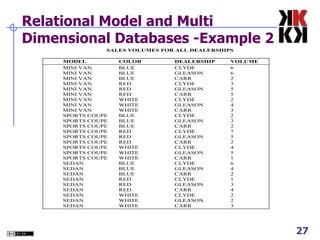
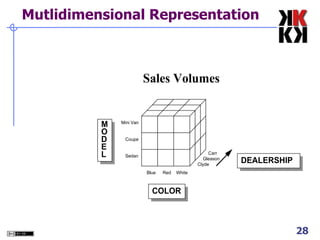
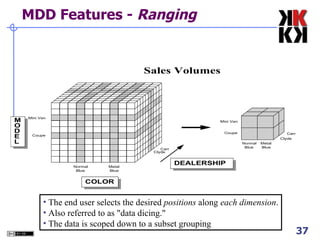
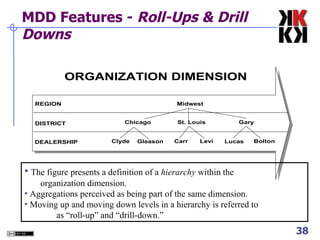
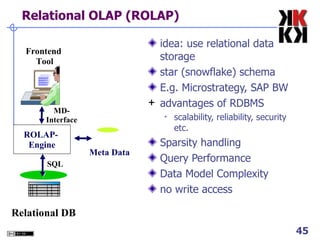
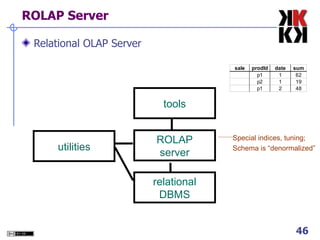
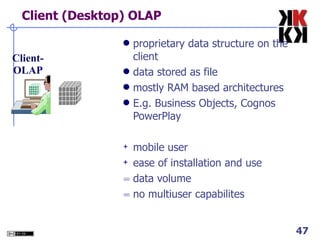
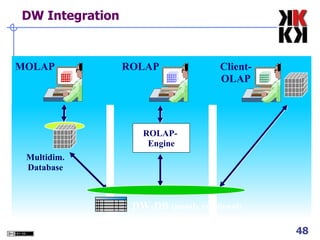
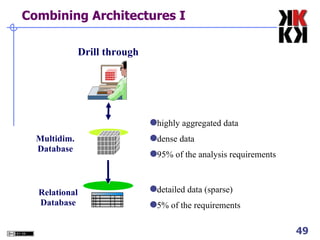
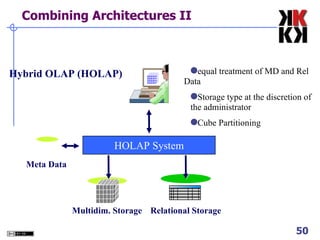


The document discusses OLAP cubes and data warehousing. It defines OLAP as online analytical processing used to analyze aggregated data in data warehouses. Key concepts covered include star schemas, dimensions and facts, cube operations like roll-up and drill-down, and different OLAP architectures like MOLAP and ROLAP that use multidimensional or relational storage respectively.