Downloaded 191 times

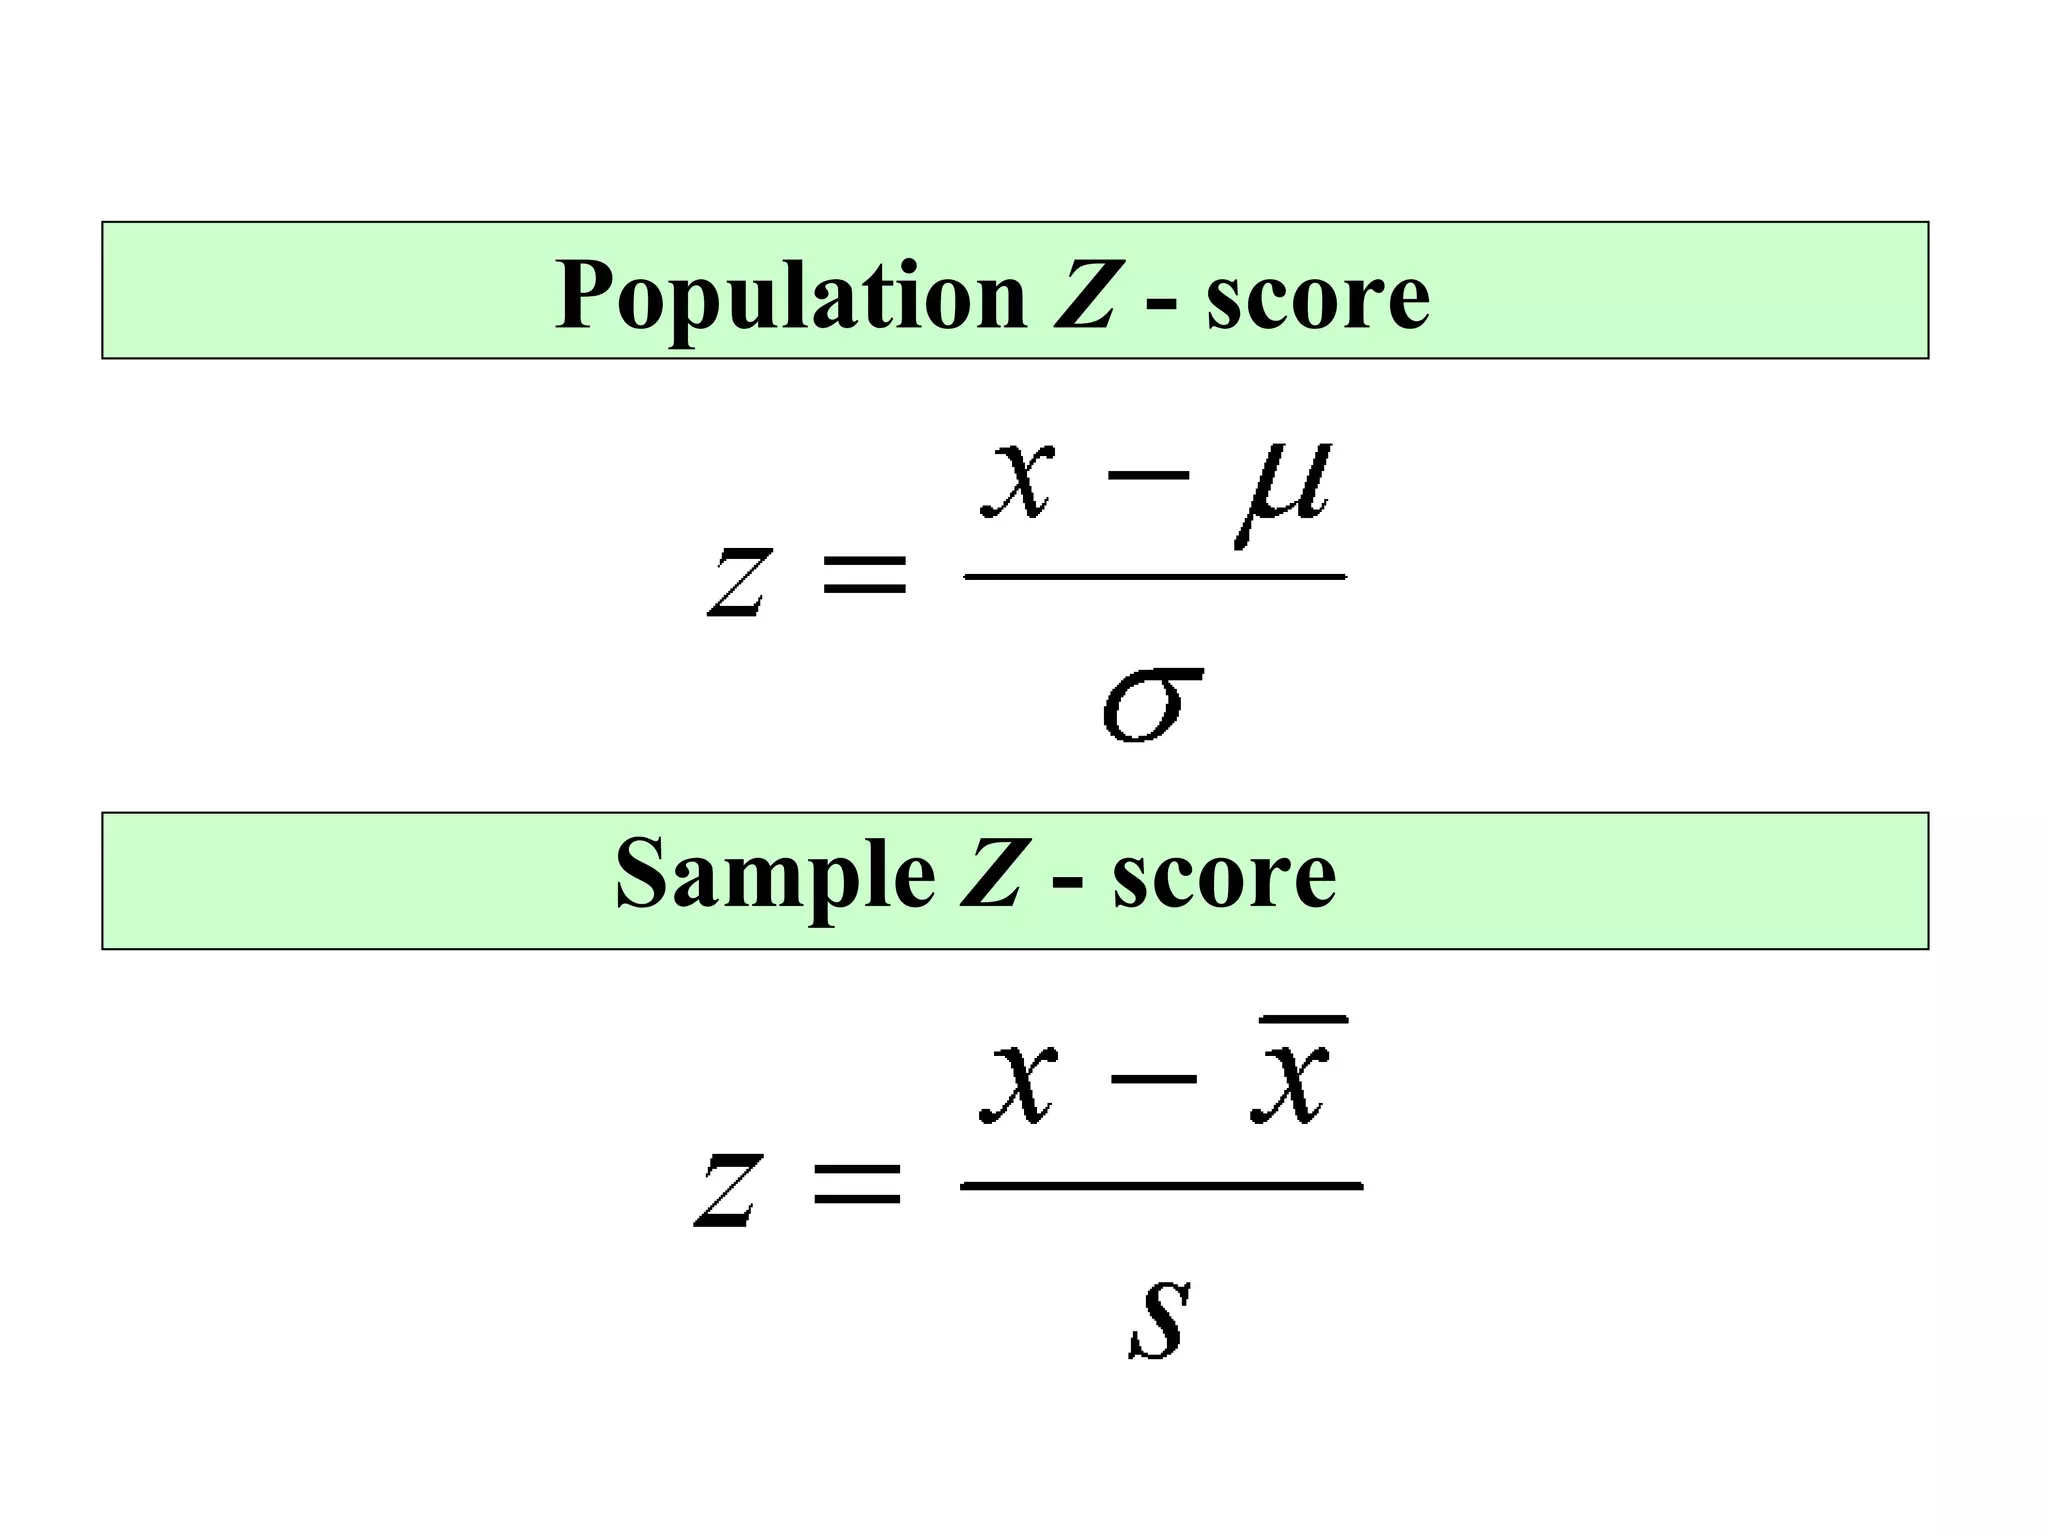


The document discusses z-scores and how they are used to standardize scores in a normal distribution. A z-score represents the number of standard deviations a data point is from the mean. It is calculated by subtracting the mean from the data value and dividing by the standard deviation. Examples are given to demonstrate how to calculate z-scores and use them to determine percentiles and the percentage of cases above or below a given score.