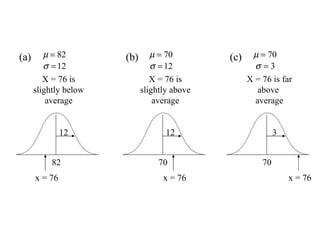
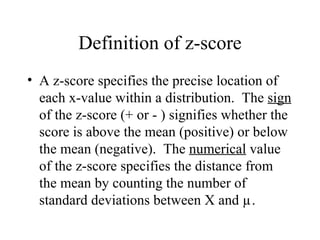
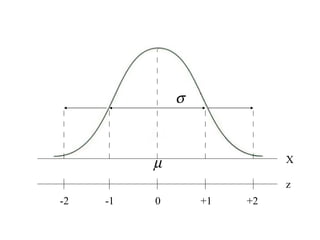
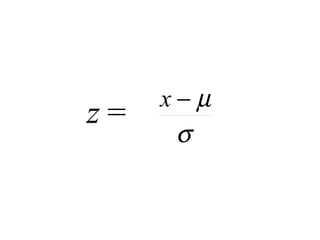
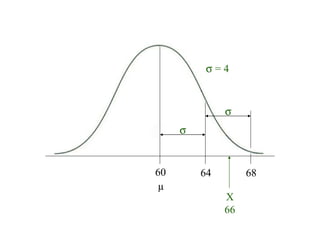
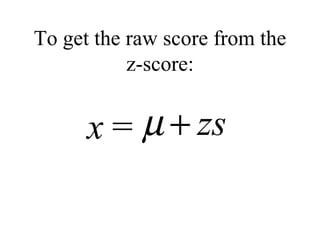
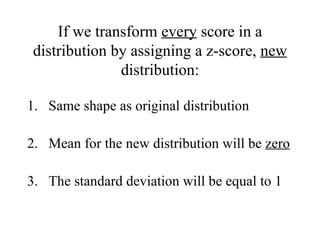
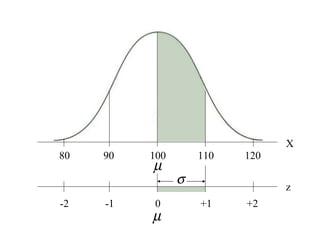
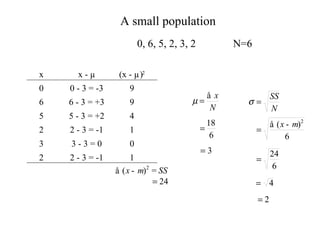
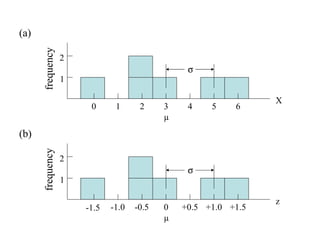
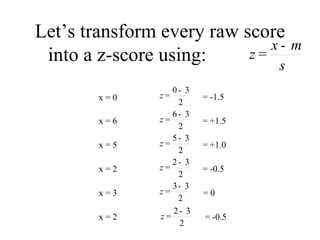
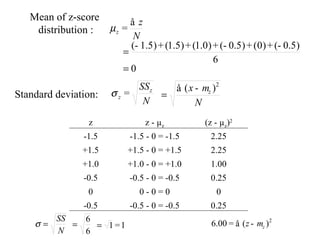
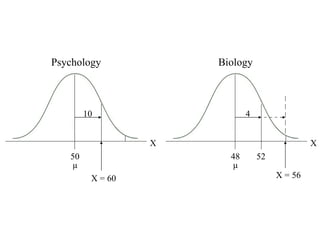
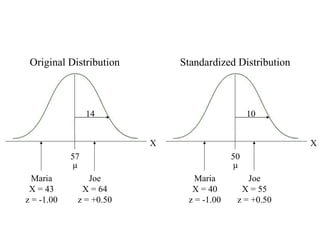
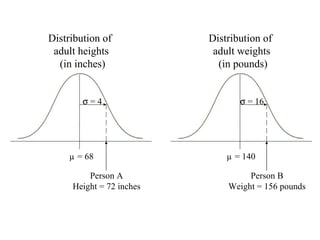
Chapter 5: z-Scores
Normal curve distribution comparisons 12 82 x = 76 (a) X = 76 is slightly below average 12 70 x = 76 (b) X = 76 is slightly above average 3 70 x = 76 (c) X = 76 is far above  average
Definition of z-score A z-score specifies the precise location of each x-value within a distribution.  The  sign  of the z-score (+ or - ) signifies whether the score is above the mean (positive) or below the mean (negative).  The  numerical  value of the z-score specifies the distance from the mean by counting the number of standard deviations between X and µ.
Normal curve segmented by sd’s X z -2 -1 0 +1 +2
Example 5.2 A distribution of exam scores has a mean (µ) of 50 and a standard deviation (σ) of 8.
Z formula
Normal curve with sd’s      = 4 60 64 68 µ X 66
Example 5.5 A distribution has a mean of µ = 40 and a standard deviation of    = 6.
To get the raw score from the z-score:
If we transform  every  score in a distribution by assigning a z-score,  new  distribution: Same shape as original distribution Mean for the new distribution will be  zero The standard deviation will be equal to 1
Z-distribution X z -2 -1 0 +1 +2 100 110 120 90 80
A small population 0, 6, 5, 2, 3, 2 N=6 x x - µ (x - µ) 2 0 0 - 3 = -3 9 6 6 - 3 = +3 9 5 5 - 3 = +2 4 2 2 - 3 = -1 1 3 3 - 3 = 0 0 2 2 - 3 = -1 1
Frequency distributions with sd’s 2 1 0 1 2 3 4 5 6 µ  X frequency (a) 2 1 -1.5 -1.0 -0.5 0 +0.5 +1.0 +1.5 µ  z frequency (b)
Let’s transform every raw score into a z-score using: x = 0 x = 6 x = 5 x = 2 x = 3 x = 2 = -1.5 = +1.5 = +1.0 = -0.5 = 0  = -0.5
Z problem computation Mean of z-score distribution : Standard deviation: z z - µ z (z - µ z ) 2 -1.5 -1.5 - 0 = -1.5 2.25 +1.5 +1.5 - 0 = +1.5 2.25 +1.0 +1.0 - 0 = +1.0 1.00 -0.5 -0.5 - 0 = -0.5 0.25 0 0 - 0 = 0 0 -0.5 -0.5 - 0 = -0.5 0.25
Psychology vs. Biology 10 50 µ X = 60 X Psychology 4 48 µ X = 56 X Biology 52
Converting Distributions of Scores
Original vs. standardized distribution 14 57 µ Joe X = 64 z = +0.50 X Original Distribution 10 50 µ X Standardized Distribution Maria X = 43 z = -1.00 Maria X = 40 z = -1.00 Joe X = 55 z = +0.50
Correlating Two Distributions of Scores with z-scores
Distributions of height and weight    = 4 µ = 68 Person A Height = 72 inches Distribution of  adult heights (in inches)    = 16 µ = 140 Person B Weight = 156 pounds Distribution of  adult weights (in pounds)

Z scores

  • 1.
  • 2.
    Normal curve distributioncomparisons 12 82 x = 76 (a) X = 76 is slightly below average 12 70 x = 76 (b) X = 76 is slightly above average 3 70 x = 76 (c) X = 76 is far above average
  • 3.
    Definition of z-scoreA z-score specifies the precise location of each x-value within a distribution. The sign of the z-score (+ or - ) signifies whether the score is above the mean (positive) or below the mean (negative). The numerical value of the z-score specifies the distance from the mean by counting the number of standard deviations between X and µ.
  • 4.
    Normal curve segmentedby sd’s X z -2 -1 0 +1 +2
  • 5.
    Example 5.2 Adistribution of exam scores has a mean (µ) of 50 and a standard deviation (σ) of 8.
  • 6.
  • 7.
    Normal curve withsd’s    = 4 60 64 68 µ X 66
  • 8.
    Example 5.5 Adistribution has a mean of µ = 40 and a standard deviation of  = 6.
  • 9.
    To get theraw score from the z-score:
  • 10.
    If we transform every score in a distribution by assigning a z-score, new distribution: Same shape as original distribution Mean for the new distribution will be zero The standard deviation will be equal to 1
  • 11.
    Z-distribution X z-2 -1 0 +1 +2 100 110 120 90 80
  • 12.
    A small population0, 6, 5, 2, 3, 2 N=6 x x - µ (x - µ) 2 0 0 - 3 = -3 9 6 6 - 3 = +3 9 5 5 - 3 = +2 4 2 2 - 3 = -1 1 3 3 - 3 = 0 0 2 2 - 3 = -1 1
  • 13.
    Frequency distributions withsd’s 2 1 0 1 2 3 4 5 6 µ  X frequency (a) 2 1 -1.5 -1.0 -0.5 0 +0.5 +1.0 +1.5 µ  z frequency (b)
  • 14.
    Let’s transform everyraw score into a z-score using: x = 0 x = 6 x = 5 x = 2 x = 3 x = 2 = -1.5 = +1.5 = +1.0 = -0.5 = 0 = -0.5
  • 15.
    Z problem computationMean of z-score distribution : Standard deviation: z z - µ z (z - µ z ) 2 -1.5 -1.5 - 0 = -1.5 2.25 +1.5 +1.5 - 0 = +1.5 2.25 +1.0 +1.0 - 0 = +1.0 1.00 -0.5 -0.5 - 0 = -0.5 0.25 0 0 - 0 = 0 0 -0.5 -0.5 - 0 = -0.5 0.25
  • 16.
    Psychology vs. Biology10 50 µ X = 60 X Psychology 4 48 µ X = 56 X Biology 52
  • 17.
  • 18.
    Original vs. standardizeddistribution 14 57 µ Joe X = 64 z = +0.50 X Original Distribution 10 50 µ X Standardized Distribution Maria X = 43 z = -1.00 Maria X = 40 z = -1.00 Joe X = 55 z = +0.50
  • 19.
    Correlating Two Distributionsof Scores with z-scores
  • 20.
    Distributions of heightand weight  = 4 µ = 68 Person A Height = 72 inches Distribution of adult heights (in inches)  = 16 µ = 140 Person B Weight = 156 pounds Distribution of adult weights (in pounds)

Editor's Notes

  • #12 Figure 5.6 Following a z -score transformation, the X -axis is relabeled in z -score units. The distance that is equivalent to 1 standard deviation on the X -axis (σ = 10 points in this example) corresponds to 1 point on the z -score scale.