The document discusses converting normal random variables to standard normal variables and vice versa using z-scores. It provides examples of calculating z-scores given population/sample means and standard deviations. The key points are:
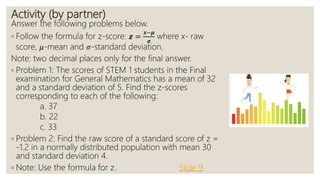
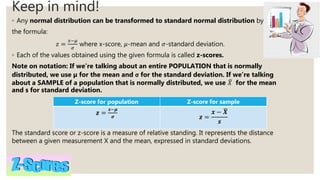
- A z-score represents the distance from the mean in terms of standard deviations and is used to convert a raw score to its standard normal equivalent.
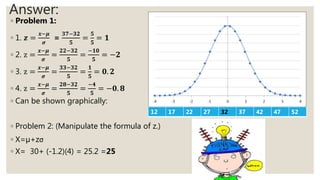
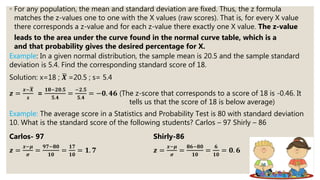
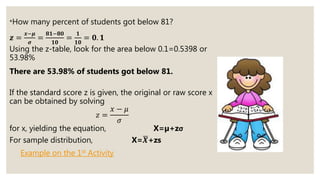
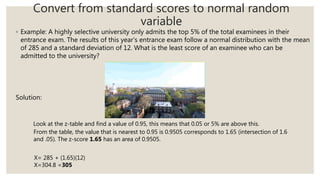
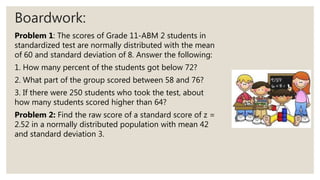
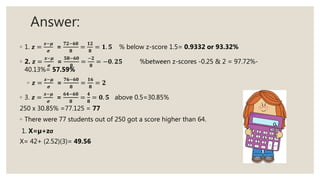
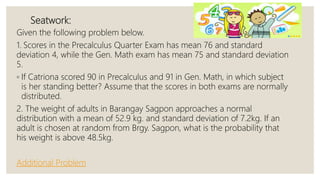
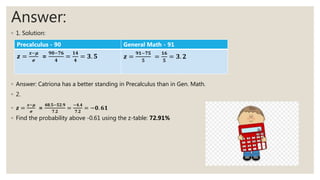
- The formula for converting a normal variable to standard is z = (x - μ) / σ, where x is the raw score, μ is the population mean, and σ is the population standard deviation.
- Converting from a z-score to a raw score uses the formula x = μ + zσ, allowing you to find the original value