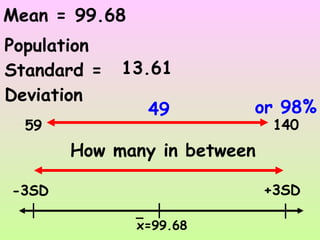
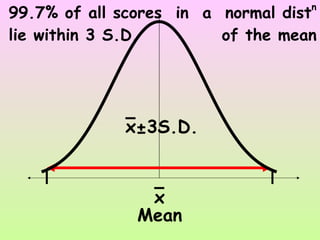
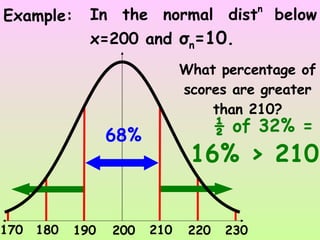
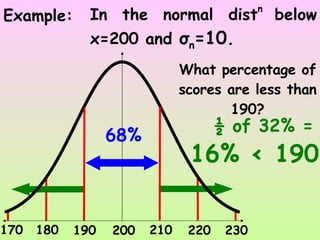
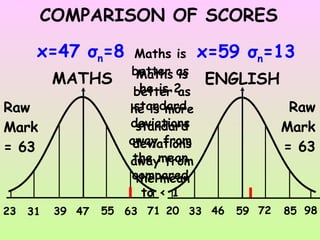
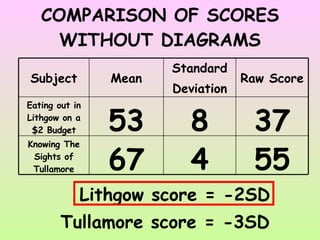
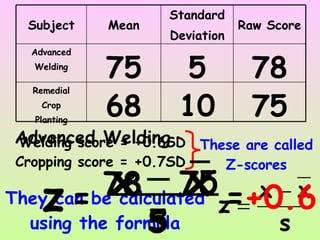
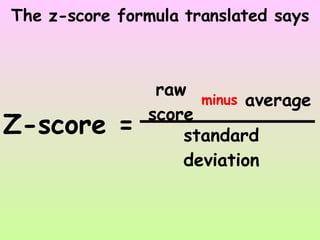
SlideShare a Scribd company logo
1 of 36
Z-Scores
Find the mean and standard deviation of the following Yr 12 Verbal Reasoning scores: 100 100 100 99 96 101 90 99 107 107 108 112 97 104 104 116 85 119 98 116 84 96 101 104 105 103 80 84 93 93 89 87 150 121 120 117 83 96 104 104 102 111 92 81 95 101 79 96 65 90
Mean =  99.68 Population Standard =  Deviation  13.61 x=99.68 -1SD +1SD How many in between 87 113 35 or   70%
Mean =  99.68 Population Standard =  Deviation  13.61 x=99.68 -2SD +2SD How many in between 73 126 48 or   96%
Mean =  99.68 Population Standard =  Deviation  13.61 x=99.68 -3SD +3SD How many in between 59 140 49 or   98%
Mean x x±1S.D. 68% of all scores in a normal dist n  lie within 1 S.D.  of the mean
Mean x x±2S.D. 95% of all scores in a normal dist n  lie within 2 S.D.  of the mean
Mean x x±3S.D. 99.7% of all scores  in  a  normal dist n  lie within 3 S.D.  of the mean
Example: The Yr 12 Science test results were normally distributed with a mean of 45% and a standard deviation of ±5.  What percentage of scores fell between 35 and 55?  35 = mean – 2 SD 55 = mean + 2 SD 95% of scores fell between 35 and 55
Example: The thickness of sheet metal at a mill is normally distributed with x=2mm and  σ n =0.1mm. What percentage of sheets will have a thickness exceeding 2.2mm? 2.0 95% 5% outside this band 2.2 1.8 2.2mm is 2SD above mean 2 ½% > 2.2mm
The lifetimes of D-size batteries is normally distributed x=150 hours and  σ n =7hours. 300 batteries are taken off the production line. How many should have a life below 143 hours? 150 157 143 68% 32% outside this band 143hrs is 1SD below the mean 16%  < 143hrs 16% of 300 = 48 batteries
Example: In the normal dist n  below x=200 and  σ n =10. 200 210 220 230 190 180 170 What percentage of scores lie between 190 and 210? 68%
Example: In the normal dist n  below x=200 and  σ n =10. 200 210 220 230 190 180 170 What percentage of scores lie between 200 and 210? ½ of 68% 34%
Example: In the normal dist n  below x=200 and  σ n =10. 200 210 220 230 190 180 170 What percentage of scores lie between 180 and 220? 95%
Example: In the normal dist n  below x=200 and  σ n =10. 200 210 220 230 190 180 170 What percentage of scores lie between 180 and 200? ½ of 95% 47½%
Example: In the normal dist n  below x=200 and  σ n =10. 200 210 220 230 190 180 170 What percentage of scores lie between 180 and 210? 47½% 34% 81 ½ %
Example: In the normal dist n  below x=200 and  σ n =10. 200 210 220 230 190 180 170 What percentage of scores are greater than 180? 47½% 50% 97½%
Example: In the normal dist n  below x=200 and  σ n =10. 200 210 220 230 190 180 170 What percentage of scores are greater than 210? 68% ½ of 32% =  16% > 210
Example: In the normal dist n  below x=200 and  σ n =10. 200 210 220 230 190 180 170 What percentage of scores are less than 190? 68% ½ of 32% =  16% < 190
Example: In the normal dist n  below x=200 and  σ n =10. 200 210 220 230 190 180 170 What percentage of scores are less than 230? 99.7% ½ of 0.3%  = 0.15%  0.15%  99.85%
Example: In the normal dist n  below x=200 and  σ n =10. 200 210 220 230 190 180 170 What percentage of scores lie between 180 and 190? 68% 95% Half of the difference between 95% and 68% = 13.5%
COMPARISON OF SCORES MATHS ENGLISH x=47  σ n =8 x=59  σ n =13 47 55 63 71 23 31 39 59 72 85 98 20 33 46 Raw  Mark  = 63 Raw Mark = 63 Maths is better as he is more standard deviations away from the mean Maths is better as he is 2 standard deviations away from the mean compared to < 1
COMPARISON OF SCORES GEOG LATIN x=56  σ n =4 x=38  σ n =7 56 60 64 68 44 48 52 38 45 52 59 17 24 31 Raw Mark = 52 Latin is better as he is more standard deviations away from the mean Latin is better as he is 2 standard deviations away from the mean compared to 1 for Geog Raw  Mark  = 60
COMPARISON OF SCORES LEGAL BUSINESS x=45  σ n =11 x=53  σ n =9 45 56 67 78 12 23 34 53 62 71 80 26 35 44 Raw Mark = 71 Business is better as his score relative to the mean is +2 compared to +1 for Legal Raw  Mark  = 56
COMPARISON OF SCORES HISTORY SCIENCE x=59  σ n =8 x=43  σ n =12 59 67 75 83 35 43 51 43 55 67 79 7 19 31 Raw Mark = 31 Science is better as his score relative to the mean is -1 compared to -1½ for History Raw  Mark  = 47
COMPARISON OF SCORES WITHOUT DIAGRAMS Origami score = -1SD Bonsai score = -2SD 44 6 56 Remedial Bonsai 35 10 45 Advanced  Origami Raw Score Standard Deviation Mean Subject
COMPARISON OF SCORES WITHOUT DIAGRAMS RE score = +2SD Economics score = +2SD Both equally good 77 14 49 Religious Education 72 6 60 Economics Raw Score Standard Deviation Mean Subject
COMPARISON OF SCORES WITHOUT DIAGRAMS Tullamore score = -3SD Lithgow score = -2SD 55 4 67 Knowing The Sights of Tullamore 37 8 53 Eating out in Lithgow on a $2 Budget Raw Score Standard Deviation Mean Subject
COMPARISON OF SCORES WITHOUT DIAGRAMS Cropping score = +0.7SD Welding score = +0.6SD 75 10 68 Remedial Crop Planting 78 5 75 Advanced Welding Raw Score Standard Deviation Mean Subject
Calculating Z-Scores
Cropping score = +0.7SD Welding score = +0.6SD These are called Z-scores They can be calculated using the formula 75 10 68 Remedial Crop Planting 78 5 75 Advanced Welding Raw Score Standard Deviation Mean Subject
Cropping score = +0.7SD Welding score = +0.6SD These are called Z-scores They can be calculated using the formula z = x x s 78 75 5 = +0.6 Advanced Welding 75 10 68 Remedial Crop Planting 78 5 75 Advanced Welding Raw Score Standard Deviation Mean Subject
The z-score formula translated says Z-score = raw score minus average standard deviation
Find the z-score for Crop Planting Z-score = raw score minus average standard deviation 75 68 10 = +0.7 7 75 10 68 Remedial Crop Planting 78 5 75 Advanced Welding Raw Score Standard Deviation Mean Subject
Practice Billy scores 54% in a test for remedial origami. The mean for the class was 60% with a standard deviation of ±8%. Calculate his z-score. z = x x s 54 8 60 = -0.5
Practice Abdul scores 68% in a test for advanced basket weaving. The mean for the class was 58% with a standard deviation of ±16%. Calculate his z-score. z = x x s 68 16 58 = +0.625 The plus/minus signs are necessary! Why? They indicate above/below the mean

More Related Content

What's hot

1st Test - If then, converse, inverse and contrapositive
1st Test - If then, converse, inverse and contrapositive1st Test - If then, converse, inverse and contrapositive
1st Test - If then, converse, inverse and contrapositiveBrandeis High School
 
Standard deviationnormal distributionshow
Standard deviationnormal distributionshowStandard deviationnormal distributionshow
Standard deviationnormal distributionshowBiologyIB
 
frequency distribution table
frequency distribution tablefrequency distribution table
frequency distribution tableMonie Ali
 
6. Categorical data analysis - Chi-Square & Fisher Exact Test
6. Categorical data analysis - Chi-Square & Fisher Exact Test6. Categorical data analysis - Chi-Square & Fisher Exact Test
6. Categorical data analysis - Chi-Square & Fisher Exact TestRazif Shahril
 
Lesson 2 percentiles
Lesson 2   percentilesLesson 2   percentiles
Lesson 2 percentileskarisashley
 
Deciles & Quartiles - Point Measures
Deciles & Quartiles - Point  MeasuresDeciles & Quartiles - Point  Measures
Deciles & Quartiles - Point MeasuresSweetChareyLouMapind
 
Chapter 2 understanding the normal curve distribution
Chapter 2   understanding the normal curve distributionChapter 2   understanding the normal curve distribution
Chapter 2 understanding the normal curve distributionAntonio F. Balatar Jr.
 
Probability Distribution
Probability DistributionProbability Distribution
Probability DistributionSagar Khairnar
 
parametric test of difference z test f test one-way_two-way_anova
parametric test of difference z test f test one-way_two-way_anova parametric test of difference z test f test one-way_two-way_anova
parametric test of difference z test f test one-way_two-way_anova Tess Anoza
 
Basics of statistics
Basics of statisticsBasics of statistics
Basics of statisticsdonthuraj
 
Inferential Statistics
Inferential StatisticsInferential Statistics
Inferential Statisticsewhite00
 
Day 1 - Measures of Position - Quartiles - Percentiles - ZScores-BoxPlots 2.6...
Day 1 - Measures of Position - Quartiles - Percentiles - ZScores-BoxPlots 2.6...Day 1 - Measures of Position - Quartiles - Percentiles - ZScores-BoxPlots 2.6...
Day 1 - Measures of Position - Quartiles - Percentiles - ZScores-BoxPlots 2.6...rich_26
 

What's hot (20)

Z scores
Z scoresZ scores
Z scores
 
1st Test - If then, converse, inverse and contrapositive
1st Test - If then, converse, inverse and contrapositive1st Test - If then, converse, inverse and contrapositive
1st Test - If then, converse, inverse and contrapositive
 
Probability and statistics
Probability and statisticsProbability and statistics
Probability and statistics
 
Quartile
QuartileQuartile
Quartile
 
Standard deviationnormal distributionshow
Standard deviationnormal distributionshowStandard deviationnormal distributionshow
Standard deviationnormal distributionshow
 
frequency distribution table
frequency distribution tablefrequency distribution table
frequency distribution table
 
6. Categorical data analysis - Chi-Square & Fisher Exact Test
6. Categorical data analysis - Chi-Square & Fisher Exact Test6. Categorical data analysis - Chi-Square & Fisher Exact Test
6. Categorical data analysis - Chi-Square & Fisher Exact Test
 
Lesson 2 percentiles
Lesson 2   percentilesLesson 2   percentiles
Lesson 2 percentiles
 
Hypothesis testing
Hypothesis testingHypothesis testing
Hypothesis testing
 
Deciles & Quartiles - Point Measures
Deciles & Quartiles - Point  MeasuresDeciles & Quartiles - Point  Measures
Deciles & Quartiles - Point Measures
 
Chapter 2 understanding the normal curve distribution
Chapter 2   understanding the normal curve distributionChapter 2   understanding the normal curve distribution
Chapter 2 understanding the normal curve distribution
 
Probability Distribution
Probability DistributionProbability Distribution
Probability Distribution
 
Variability
VariabilityVariability
Variability
 
parametric test of difference z test f test one-way_two-way_anova
parametric test of difference z test f test one-way_two-way_anova parametric test of difference z test f test one-way_two-way_anova
parametric test of difference z test f test one-way_two-way_anova
 
Normal distribution
Normal distribution Normal distribution
Normal distribution
 
Basics of statistics
Basics of statisticsBasics of statistics
Basics of statistics
 
Zscores
ZscoresZscores
Zscores
 
Inferential Statistics
Inferential StatisticsInferential Statistics
Inferential Statistics
 
Day 1 - Measures of Position - Quartiles - Percentiles - ZScores-BoxPlots 2.6...
Day 1 - Measures of Position - Quartiles - Percentiles - ZScores-BoxPlots 2.6...Day 1 - Measures of Position - Quartiles - Percentiles - ZScores-BoxPlots 2.6...
Day 1 - Measures of Position - Quartiles - Percentiles - ZScores-BoxPlots 2.6...
 
4. parameter and statistic
4. parameter and statistic4. parameter and statistic
4. parameter and statistic
 

Viewers also liked

Introduction to z-Scores
Introduction to z-Scores Introduction to z-Scores
Introduction to z-Scores Sr Edith Bogue
 
Z score
Z scoreZ score
Z scorefebru
 
Standard Scores
Standard ScoresStandard Scores
Standard Scoresshoffma5
 
Standard scores
Standard scores Standard scores
Standard scores Judith Ann
 
Altman zscore (Finance)
Altman zscore (Finance)Altman zscore (Finance)
Altman zscore (Finance)Jobin Mathew
 
Project "Z"Score Model
Project  "Z"Score ModelProject  "Z"Score Model
Project "Z"Score Modelmobilearun
 
Standard Score And The Normal Curve
Standard Score And The Normal CurveStandard Score And The Normal Curve
Standard Score And The Normal CurveJOHNY NATAD
 
Standard deviation (3)
Standard deviation (3)Standard deviation (3)
Standard deviation (3)Sonali Prasad
 
Modeling Structural Default Risk
Modeling Structural Default RiskModeling Structural Default Risk
Modeling Structural Default RiskAbdulmuttalib Garba
 
oct15/09dmciprecal30s
oct15/09dmciprecal30soct15/09dmciprecal30s
oct15/09dmciprecal30sRyanWatt
 
5.1 vertex symm t-table
5.1 vertex symm t-table5.1 vertex symm t-table
5.1 vertex symm t-tableandreagoings
 
Applications of the vertex formula edit
Applications of the vertex formula editApplications of the vertex formula edit
Applications of the vertex formula editsnewgas
 
"Credit Risk-Probabilities Of Default"
"Credit Risk-Probabilities Of Default""Credit Risk-Probabilities Of Default"
"Credit Risk-Probabilities Of Default"Arun Singh
 
Lect 2 basic ppt
Lect 2 basic pptLect 2 basic ppt
Lect 2 basic pptTao Hong
 
WWU PCard Training
WWU PCard TrainingWWU PCard Training
WWU PCard TrainingWWUWebTech
 
Estimation of the probability of default : Credit Rish
Estimation of the probability of default : Credit RishEstimation of the probability of default : Credit Rish
Estimation of the probability of default : Credit RishArsalan Qadri
 
Standard Normal Distribution (Education)
Standard Normal Distribution (Education)Standard Normal Distribution (Education)
Standard Normal Distribution (Education)Anjenette Columnas
 

Viewers also liked (20)

Introduction to z-Scores
Introduction to z-Scores Introduction to z-Scores
Introduction to z-Scores
 
Z score
Z scoreZ score
Z score
 
Standard Scores
Standard ScoresStandard Scores
Standard Scores
 
Z scores
Z scoresZ scores
Z scores
 
Standard score
Standard scoreStandard score
Standard score
 
Standard scores
Standard scores Standard scores
Standard scores
 
Altman zscore (Finance)
Altman zscore (Finance)Altman zscore (Finance)
Altman zscore (Finance)
 
Project "Z"Score Model
Project  "Z"Score ModelProject  "Z"Score Model
Project "Z"Score Model
 
Standard Score And The Normal Curve
Standard Score And The Normal CurveStandard Score And The Normal Curve
Standard Score And The Normal Curve
 
Standard deviation (3)
Standard deviation (3)Standard deviation (3)
Standard deviation (3)
 
Standard scores
Standard scoresStandard scores
Standard scores
 
Modeling Structural Default Risk
Modeling Structural Default RiskModeling Structural Default Risk
Modeling Structural Default Risk
 
oct15/09dmciprecal30s
oct15/09dmciprecal30soct15/09dmciprecal30s
oct15/09dmciprecal30s
 
5.1 vertex symm t-table
5.1 vertex symm t-table5.1 vertex symm t-table
5.1 vertex symm t-table
 
Applications of the vertex formula edit
Applications of the vertex formula editApplications of the vertex formula edit
Applications of the vertex formula edit
 
"Credit Risk-Probabilities Of Default"
"Credit Risk-Probabilities Of Default""Credit Risk-Probabilities Of Default"
"Credit Risk-Probabilities Of Default"
 
Lect 2 basic ppt
Lect 2 basic pptLect 2 basic ppt
Lect 2 basic ppt
 
WWU PCard Training
WWU PCard TrainingWWU PCard Training
WWU PCard Training
 
Estimation of the probability of default : Credit Rish
Estimation of the probability of default : Credit RishEstimation of the probability of default : Credit Rish
Estimation of the probability of default : Credit Rish
 
Standard Normal Distribution (Education)
Standard Normal Distribution (Education)Standard Normal Distribution (Education)
Standard Normal Distribution (Education)
 

Similar to Z-Scores Explained

The standard normal curve & its application in biomedical sciences
The standard normal curve & its application in biomedical sciencesThe standard normal curve & its application in biomedical sciences
The standard normal curve & its application in biomedical sciencesAbhi Manu
 
8. normal distribution qt pgdm 1st semester
8. normal distribution qt pgdm 1st  semester8. normal distribution qt pgdm 1st  semester
8. normal distribution qt pgdm 1st semesterKaran Kukreja
 
SIMS Quant Course Lecture 4
SIMS Quant Course Lecture 4SIMS Quant Course Lecture 4
SIMS Quant Course Lecture 4Rashmi Sinha
 
Estimating a Population Standard Deviation or Variance
Estimating a Population Standard Deviation or VarianceEstimating a Population Standard Deviation or Variance
Estimating a Population Standard Deviation or VarianceLong Beach City College
 
Estimating a Population Standard Deviation or Variance
Estimating a Population Standard Deviation or Variance Estimating a Population Standard Deviation or Variance
Estimating a Population Standard Deviation or Variance Long Beach City College
 
Converting normal to standard normal distribution and vice versa ppt
Converting normal to standard normal distribution and vice versa pptConverting normal to standard normal distribution and vice versa ppt
Converting normal to standard normal distribution and vice versa pptAilz Lositaño
 
Lecture 03 Inferential Statistics 1
Lecture 03 Inferential Statistics 1Lecture 03 Inferential Statistics 1
Lecture 03 Inferential Statistics 1Riri Ariyanty
 
Lecture 07 Regression Analysis Part 1
Lecture 07 Regression Analysis Part 1Lecture 07 Regression Analysis Part 1
Lecture 07 Regression Analysis Part 1Riri Ariyanty
 
Estimation part III
Estimation part IIIEstimation part III
Estimation part IIINadeem Uddin
 
Year 12 Maths A Textbook - Chapter 10
Year 12 Maths A Textbook - Chapter 10Year 12 Maths A Textbook - Chapter 10
Year 12 Maths A Textbook - Chapter 10westy67968
 
Mean, median, and mode ug
Mean, median, and mode ugMean, median, and mode ug
Mean, median, and mode ugAbhishekDas15
 
Statistics for interpreting test scores
Statistics for interpreting test scoresStatistics for interpreting test scores
Statistics for interpreting test scoresmpazhou
 
Percentage and its applications /COMMERCIAL MATHEMATICS
Percentage and its applications /COMMERCIAL MATHEMATICSPercentage and its applications /COMMERCIAL MATHEMATICS
Percentage and its applications /COMMERCIAL MATHEMATICSindianeducation
 

Similar to Z-Scores Explained (20)

The standard normal curve & its application in biomedical sciences
The standard normal curve & its application in biomedical sciencesThe standard normal curve & its application in biomedical sciences
The standard normal curve & its application in biomedical sciences
 
8. normal distribution qt pgdm 1st semester
8. normal distribution qt pgdm 1st  semester8. normal distribution qt pgdm 1st  semester
8. normal distribution qt pgdm 1st semester
 
SIMS Quant Course Lecture 4
SIMS Quant Course Lecture 4SIMS Quant Course Lecture 4
SIMS Quant Course Lecture 4
 
Estimating a Population Standard Deviation or Variance
Estimating a Population Standard Deviation or VarianceEstimating a Population Standard Deviation or Variance
Estimating a Population Standard Deviation or Variance
 
Estimating a Population Standard Deviation or Variance
Estimating a Population Standard Deviation or Variance Estimating a Population Standard Deviation or Variance
Estimating a Population Standard Deviation or Variance
 
227_ch7-hw-soln.pdf
227_ch7-hw-soln.pdf227_ch7-hw-soln.pdf
227_ch7-hw-soln.pdf
 
Converting normal to standard normal distribution and vice versa ppt
Converting normal to standard normal distribution and vice versa pptConverting normal to standard normal distribution and vice versa ppt
Converting normal to standard normal distribution and vice versa ppt
 
Semana7 dn
Semana7 dnSemana7 dn
Semana7 dn
 
Lecture 03 Inferential Statistics 1
Lecture 03 Inferential Statistics 1Lecture 03 Inferential Statistics 1
Lecture 03 Inferential Statistics 1
 
Lecture 07 Regression Analysis Part 1
Lecture 07 Regression Analysis Part 1Lecture 07 Regression Analysis Part 1
Lecture 07 Regression Analysis Part 1
 
Estimation part III
Estimation part IIIEstimation part III
Estimation part III
 
Year 12 Maths A Textbook - Chapter 10
Year 12 Maths A Textbook - Chapter 10Year 12 Maths A Textbook - Chapter 10
Year 12 Maths A Textbook - Chapter 10
 
QT1 - 07 - Estimation
QT1 - 07 - EstimationQT1 - 07 - Estimation
QT1 - 07 - Estimation
 
Cases of areas_under_the_normal_curve(2)
Cases of areas_under_the_normal_curve(2)Cases of areas_under_the_normal_curve(2)
Cases of areas_under_the_normal_curve(2)
 
Normal Distribution
Normal DistributionNormal Distribution
Normal Distribution
 
risk and return fm
risk and return fmrisk and return fm
risk and return fm
 
Mean, median, and mode ug
Mean, median, and mode ugMean, median, and mode ug
Mean, median, and mode ug
 
Statistics for interpreting test scores
Statistics for interpreting test scoresStatistics for interpreting test scores
Statistics for interpreting test scores
 
Percentage and its applications /COMMERCIAL MATHEMATICS
Percentage and its applications /COMMERCIAL MATHEMATICSPercentage and its applications /COMMERCIAL MATHEMATICS
Percentage and its applications /COMMERCIAL MATHEMATICS
 
3.2 Measures of variation
3.2 Measures of variation3.2 Measures of variation
3.2 Measures of variation
 

Recently uploaded

Key Features Of Token Development (1).pptx
Key  Features Of Token  Development (1).pptxKey  Features Of Token  Development (1).pptx
Key Features Of Token Development (1).pptxLBM Solutions
 
Unblocking The Main Thread Solving ANRs and Frozen Frames
Unblocking The Main Thread Solving ANRs and Frozen FramesUnblocking The Main Thread Solving ANRs and Frozen Frames
Unblocking The Main Thread Solving ANRs and Frozen FramesSinan KOZAK
 
My Hashitalk Indonesia April 2024 Presentation
My Hashitalk Indonesia April 2024 PresentationMy Hashitalk Indonesia April 2024 Presentation
My Hashitalk Indonesia April 2024 PresentationRidwan Fadjar
 
Azure Monitor & Application Insight to monitor Infrastructure & Application
Azure Monitor & Application Insight to monitor Infrastructure & ApplicationAzure Monitor & Application Insight to monitor Infrastructure & Application
Azure Monitor & Application Insight to monitor Infrastructure & ApplicationAndikSusilo4
 
Kotlin Multiplatform & Compose Multiplatform - Starter kit for pragmatics
Kotlin Multiplatform & Compose Multiplatform - Starter kit for pragmaticsKotlin Multiplatform & Compose Multiplatform - Starter kit for pragmatics
Kotlin Multiplatform & Compose Multiplatform - Starter kit for pragmaticscarlostorres15106
 
The Codex of Business Writing Software for Real-World Solutions 2.pptx
The Codex of Business Writing Software for Real-World Solutions 2.pptxThe Codex of Business Writing Software for Real-World Solutions 2.pptx
The Codex of Business Writing Software for Real-World Solutions 2.pptxMalak Abu Hammad
 
Understanding the Laravel MVC Architecture
Understanding the Laravel MVC ArchitectureUnderstanding the Laravel MVC Architecture
Understanding the Laravel MVC ArchitecturePixlogix Infotech
 
Snow Chain-Integrated Tire for a Safe Drive on Winter Roads
Snow Chain-Integrated Tire for a Safe Drive on Winter RoadsSnow Chain-Integrated Tire for a Safe Drive on Winter Roads
Snow Chain-Integrated Tire for a Safe Drive on Winter RoadsHyundai Motor Group
 
Injustice - Developers Among Us (SciFiDevCon 2024)
Injustice - Developers Among Us (SciFiDevCon 2024)Injustice - Developers Among Us (SciFiDevCon 2024)
Injustice - Developers Among Us (SciFiDevCon 2024)Allon Mureinik
 
Automating Business Process via MuleSoft Composer | Bangalore MuleSoft Meetup...
Automating Business Process via MuleSoft Composer | Bangalore MuleSoft Meetup...Automating Business Process via MuleSoft Composer | Bangalore MuleSoft Meetup...
Automating Business Process via MuleSoft Composer | Bangalore MuleSoft Meetup...shyamraj55
 
GenCyber Cyber Security Day Presentation
GenCyber Cyber Security Day PresentationGenCyber Cyber Security Day Presentation
GenCyber Cyber Security Day PresentationMichael W. Hawkins
 
Making_way_through_DLL_hollowing_inspite_of_CFG_by_Debjeet Banerjee.pptx
Making_way_through_DLL_hollowing_inspite_of_CFG_by_Debjeet Banerjee.pptxMaking_way_through_DLL_hollowing_inspite_of_CFG_by_Debjeet Banerjee.pptx
Making_way_through_DLL_hollowing_inspite_of_CFG_by_Debjeet Banerjee.pptxnull - The Open Security Community
 
SQL Database Design For Developers at php[tek] 2024
SQL Database Design For Developers at php[tek] 2024SQL Database Design For Developers at php[tek] 2024
SQL Database Design For Developers at php[tek] 2024Scott Keck-Warren
 
FULL ENJOY 🔝 8264348440 🔝 Call Girls in Diplomatic Enclave | Delhi
FULL ENJOY 🔝 8264348440 🔝 Call Girls in Diplomatic Enclave | DelhiFULL ENJOY 🔝 8264348440 🔝 Call Girls in Diplomatic Enclave | Delhi
FULL ENJOY 🔝 8264348440 🔝 Call Girls in Diplomatic Enclave | Delhisoniya singh
 
How to convert PDF to text with Nanonets
How to convert PDF to text with NanonetsHow to convert PDF to text with Nanonets
How to convert PDF to text with Nanonetsnaman860154
 
Pigging Solutions in Pet Food Manufacturing
Pigging Solutions in Pet Food ManufacturingPigging Solutions in Pet Food Manufacturing
Pigging Solutions in Pet Food ManufacturingPigging Solutions
 
08448380779 Call Girls In Friends Colony Women Seeking Men
08448380779 Call Girls In Friends Colony Women Seeking Men08448380779 Call Girls In Friends Colony Women Seeking Men
08448380779 Call Girls In Friends Colony Women Seeking MenDelhi Call girls
 
Artificial intelligence in the post-deep learning era
Artificial intelligence in the post-deep learning eraArtificial intelligence in the post-deep learning era
Artificial intelligence in the post-deep learning eraDeakin University
 

Recently uploaded (20)

Vulnerability_Management_GRC_by Sohang Sengupta.pptx
Vulnerability_Management_GRC_by Sohang Sengupta.pptxVulnerability_Management_GRC_by Sohang Sengupta.pptx
Vulnerability_Management_GRC_by Sohang Sengupta.pptx
 
Key Features Of Token Development (1).pptx
Key  Features Of Token  Development (1).pptxKey  Features Of Token  Development (1).pptx
Key Features Of Token Development (1).pptx
 
Unblocking The Main Thread Solving ANRs and Frozen Frames
Unblocking The Main Thread Solving ANRs and Frozen FramesUnblocking The Main Thread Solving ANRs and Frozen Frames
Unblocking The Main Thread Solving ANRs and Frozen Frames
 
My Hashitalk Indonesia April 2024 Presentation
My Hashitalk Indonesia April 2024 PresentationMy Hashitalk Indonesia April 2024 Presentation
My Hashitalk Indonesia April 2024 Presentation
 
Azure Monitor & Application Insight to monitor Infrastructure & Application
Azure Monitor & Application Insight to monitor Infrastructure & ApplicationAzure Monitor & Application Insight to monitor Infrastructure & Application
Azure Monitor & Application Insight to monitor Infrastructure & Application
 
The transition to renewables in India.pdf
The transition to renewables in India.pdfThe transition to renewables in India.pdf
The transition to renewables in India.pdf
 
Kotlin Multiplatform & Compose Multiplatform - Starter kit for pragmatics
Kotlin Multiplatform & Compose Multiplatform - Starter kit for pragmaticsKotlin Multiplatform & Compose Multiplatform - Starter kit for pragmatics
Kotlin Multiplatform & Compose Multiplatform - Starter kit for pragmatics
 
The Codex of Business Writing Software for Real-World Solutions 2.pptx
The Codex of Business Writing Software for Real-World Solutions 2.pptxThe Codex of Business Writing Software for Real-World Solutions 2.pptx
The Codex of Business Writing Software for Real-World Solutions 2.pptx
 
Understanding the Laravel MVC Architecture
Understanding the Laravel MVC ArchitectureUnderstanding the Laravel MVC Architecture
Understanding the Laravel MVC Architecture
 
Snow Chain-Integrated Tire for a Safe Drive on Winter Roads
Snow Chain-Integrated Tire for a Safe Drive on Winter RoadsSnow Chain-Integrated Tire for a Safe Drive on Winter Roads
Snow Chain-Integrated Tire for a Safe Drive on Winter Roads
 
Injustice - Developers Among Us (SciFiDevCon 2024)
Injustice - Developers Among Us (SciFiDevCon 2024)Injustice - Developers Among Us (SciFiDevCon 2024)
Injustice - Developers Among Us (SciFiDevCon 2024)
 
Automating Business Process via MuleSoft Composer | Bangalore MuleSoft Meetup...
Automating Business Process via MuleSoft Composer | Bangalore MuleSoft Meetup...Automating Business Process via MuleSoft Composer | Bangalore MuleSoft Meetup...
Automating Business Process via MuleSoft Composer | Bangalore MuleSoft Meetup...
 
GenCyber Cyber Security Day Presentation
GenCyber Cyber Security Day PresentationGenCyber Cyber Security Day Presentation
GenCyber Cyber Security Day Presentation
 
Making_way_through_DLL_hollowing_inspite_of_CFG_by_Debjeet Banerjee.pptx
Making_way_through_DLL_hollowing_inspite_of_CFG_by_Debjeet Banerjee.pptxMaking_way_through_DLL_hollowing_inspite_of_CFG_by_Debjeet Banerjee.pptx
Making_way_through_DLL_hollowing_inspite_of_CFG_by_Debjeet Banerjee.pptx
 
SQL Database Design For Developers at php[tek] 2024
SQL Database Design For Developers at php[tek] 2024SQL Database Design For Developers at php[tek] 2024
SQL Database Design For Developers at php[tek] 2024
 
FULL ENJOY 🔝 8264348440 🔝 Call Girls in Diplomatic Enclave | Delhi
FULL ENJOY 🔝 8264348440 🔝 Call Girls in Diplomatic Enclave | DelhiFULL ENJOY 🔝 8264348440 🔝 Call Girls in Diplomatic Enclave | Delhi
FULL ENJOY 🔝 8264348440 🔝 Call Girls in Diplomatic Enclave | Delhi
 
How to convert PDF to text with Nanonets
How to convert PDF to text with NanonetsHow to convert PDF to text with Nanonets
How to convert PDF to text with Nanonets
 
Pigging Solutions in Pet Food Manufacturing
Pigging Solutions in Pet Food ManufacturingPigging Solutions in Pet Food Manufacturing
Pigging Solutions in Pet Food Manufacturing
 
08448380779 Call Girls In Friends Colony Women Seeking Men
08448380779 Call Girls In Friends Colony Women Seeking Men08448380779 Call Girls In Friends Colony Women Seeking Men
08448380779 Call Girls In Friends Colony Women Seeking Men
 
Artificial intelligence in the post-deep learning era
Artificial intelligence in the post-deep learning eraArtificial intelligence in the post-deep learning era
Artificial intelligence in the post-deep learning era
 

Z-Scores Explained

  • 2. Find the mean and standard deviation of the following Yr 12 Verbal Reasoning scores: 100 100 100 99 96 101 90 99 107 107 108 112 97 104 104 116 85 119 98 116 84 96 101 104 105 103 80 84 93 93 89 87 150 121 120 117 83 96 104 104 102 111 92 81 95 101 79 96 65 90
  • 3. Mean = 99.68 Population Standard = Deviation 13.61 x=99.68 -1SD +1SD How many in between 87 113 35 or 70%
  • 4. Mean = 99.68 Population Standard = Deviation 13.61 x=99.68 -2SD +2SD How many in between 73 126 48 or 96%
  • 5. Mean = 99.68 Population Standard = Deviation 13.61 x=99.68 -3SD +3SD How many in between 59 140 49 or 98%
  • 6. Mean x x±1S.D. 68% of all scores in a normal dist n lie within 1 S.D. of the mean
  • 7. Mean x x±2S.D. 95% of all scores in a normal dist n lie within 2 S.D. of the mean
  • 8. Mean x x±3S.D. 99.7% of all scores in a normal dist n lie within 3 S.D. of the mean
  • 9. Example: The Yr 12 Science test results were normally distributed with a mean of 45% and a standard deviation of ±5. What percentage of scores fell between 35 and 55? 35 = mean – 2 SD 55 = mean + 2 SD 95% of scores fell between 35 and 55
  • 10. Example: The thickness of sheet metal at a mill is normally distributed with x=2mm and σ n =0.1mm. What percentage of sheets will have a thickness exceeding 2.2mm? 2.0 95% 5% outside this band 2.2 1.8 2.2mm is 2SD above mean 2 ½% > 2.2mm
  • 11. The lifetimes of D-size batteries is normally distributed x=150 hours and σ n =7hours. 300 batteries are taken off the production line. How many should have a life below 143 hours? 150 157 143 68% 32% outside this band 143hrs is 1SD below the mean 16% < 143hrs 16% of 300 = 48 batteries
  • 12. Example: In the normal dist n below x=200 and σ n =10. 200 210 220 230 190 180 170 What percentage of scores lie between 190 and 210? 68%
  • 13. Example: In the normal dist n below x=200 and σ n =10. 200 210 220 230 190 180 170 What percentage of scores lie between 200 and 210? ½ of 68% 34%
  • 14. Example: In the normal dist n below x=200 and σ n =10. 200 210 220 230 190 180 170 What percentage of scores lie between 180 and 220? 95%
  • 15. Example: In the normal dist n below x=200 and σ n =10. 200 210 220 230 190 180 170 What percentage of scores lie between 180 and 200? ½ of 95% 47½%
  • 16. Example: In the normal dist n below x=200 and σ n =10. 200 210 220 230 190 180 170 What percentage of scores lie between 180 and 210? 47½% 34% 81 ½ %
  • 17. Example: In the normal dist n below x=200 and σ n =10. 200 210 220 230 190 180 170 What percentage of scores are greater than 180? 47½% 50% 97½%
  • 18. Example: In the normal dist n below x=200 and σ n =10. 200 210 220 230 190 180 170 What percentage of scores are greater than 210? 68% ½ of 32% = 16% > 210
  • 19. Example: In the normal dist n below x=200 and σ n =10. 200 210 220 230 190 180 170 What percentage of scores are less than 190? 68% ½ of 32% = 16% < 190
  • 20. Example: In the normal dist n below x=200 and σ n =10. 200 210 220 230 190 180 170 What percentage of scores are less than 230? 99.7% ½ of 0.3% = 0.15% 0.15% 99.85%
  • 21. Example: In the normal dist n below x=200 and σ n =10. 200 210 220 230 190 180 170 What percentage of scores lie between 180 and 190? 68% 95% Half of the difference between 95% and 68% = 13.5%
  • 22. COMPARISON OF SCORES MATHS ENGLISH x=47 σ n =8 x=59 σ n =13 47 55 63 71 23 31 39 59 72 85 98 20 33 46 Raw Mark = 63 Raw Mark = 63 Maths is better as he is more standard deviations away from the mean Maths is better as he is 2 standard deviations away from the mean compared to < 1
  • 23. COMPARISON OF SCORES GEOG LATIN x=56 σ n =4 x=38 σ n =7 56 60 64 68 44 48 52 38 45 52 59 17 24 31 Raw Mark = 52 Latin is better as he is more standard deviations away from the mean Latin is better as he is 2 standard deviations away from the mean compared to 1 for Geog Raw Mark = 60
  • 24. COMPARISON OF SCORES LEGAL BUSINESS x=45 σ n =11 x=53 σ n =9 45 56 67 78 12 23 34 53 62 71 80 26 35 44 Raw Mark = 71 Business is better as his score relative to the mean is +2 compared to +1 for Legal Raw Mark = 56
  • 25. COMPARISON OF SCORES HISTORY SCIENCE x=59 σ n =8 x=43 σ n =12 59 67 75 83 35 43 51 43 55 67 79 7 19 31 Raw Mark = 31 Science is better as his score relative to the mean is -1 compared to -1½ for History Raw Mark = 47
  • 26. COMPARISON OF SCORES WITHOUT DIAGRAMS Origami score = -1SD Bonsai score = -2SD 44 6 56 Remedial Bonsai 35 10 45 Advanced Origami Raw Score Standard Deviation Mean Subject
  • 27. COMPARISON OF SCORES WITHOUT DIAGRAMS RE score = +2SD Economics score = +2SD Both equally good 77 14 49 Religious Education 72 6 60 Economics Raw Score Standard Deviation Mean Subject
  • 28. COMPARISON OF SCORES WITHOUT DIAGRAMS Tullamore score = -3SD Lithgow score = -2SD 55 4 67 Knowing The Sights of Tullamore 37 8 53 Eating out in Lithgow on a $2 Budget Raw Score Standard Deviation Mean Subject
  • 29. COMPARISON OF SCORES WITHOUT DIAGRAMS Cropping score = +0.7SD Welding score = +0.6SD 75 10 68 Remedial Crop Planting 78 5 75 Advanced Welding Raw Score Standard Deviation Mean Subject
  • 31. Cropping score = +0.7SD Welding score = +0.6SD These are called Z-scores They can be calculated using the formula 75 10 68 Remedial Crop Planting 78 5 75 Advanced Welding Raw Score Standard Deviation Mean Subject
  • 32. Cropping score = +0.7SD Welding score = +0.6SD These are called Z-scores They can be calculated using the formula z = x x s 78 75 5 = +0.6 Advanced Welding 75 10 68 Remedial Crop Planting 78 5 75 Advanced Welding Raw Score Standard Deviation Mean Subject
  • 33. The z-score formula translated says Z-score = raw score minus average standard deviation
  • 34. Find the z-score for Crop Planting Z-score = raw score minus average standard deviation 75 68 10 = +0.7 7 75 10 68 Remedial Crop Planting 78 5 75 Advanced Welding Raw Score Standard Deviation Mean Subject
  • 35. Practice Billy scores 54% in a test for remedial origami. The mean for the class was 60% with a standard deviation of ±8%. Calculate his z-score. z = x x s 54 8 60 = -0.5
  • 36. Practice Abdul scores 68% in a test for advanced basket weaving. The mean for the class was 58% with a standard deviation of ±16%. Calculate his z-score. z = x x s 68 16 58 = +0.625 The plus/minus signs are necessary! Why? They indicate above/below the mean