Download to read offline


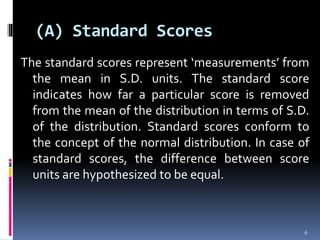


1) Derived scores help interpret raw scores and make them comparable by expressing them in terms of standard deviations from the mean. 2) There are two main types of derived scores - standard scores (z-scores) which indicate how many standard deviations a score is from the mean, and percentile ranks which show the percentage of scores in the group that are the same or lower. 3) Z-scores are calculated using the formula z = (x - M) / SD, where x is the raw score, M is the mean, and SD is the standard deviation. This expresses how many standard deviations a score is from the mean.