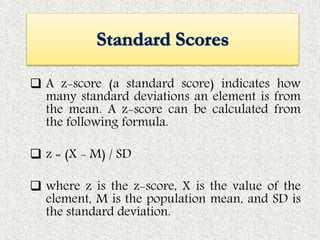
SlideShare a Scribd company logo
Presented by
Samarakoon Bandara
 Marks awarded by counting the number of
correct answers on a test script are known
as raw marks.
 Chandralatha got 16 marks out of 20 for
Psychology at the monthly test.
 Is it a high mark or a low mark? What do
you think?
 It may appear a high mark, but in fact the
statement is virtually meaningless on its
own.
 16 may be the lowest mark of a particular
group of scores. If the test was difficult, 16
may well be a very high mark.
Raw scores by themselves are not
very useful.
Raw scores need to be converted
into standard scores.
 A z-score (a standard score) indicates how
many standard deviations an element is from
the mean. A z-score can be calculated from
the following formula.
 z = (X - M) / SD
 where z is the z-score, X is the value of the
element, M is the population mean, and SD is
the standard deviation.
 The z-score is associated with the normal
distribution and it is a number that may be
used to:
 tell you where a score lies compared with the
rest of the data, above/below mean.
 compare scores from different normal
distributions
 The Z-score is a number that may be
calculated for each data point in a set of data.
 The number is continuous and may be
negative or positive, and there is no max/min
value.
 The z-score tells us how "far" that data point
is from the mean. This distance from the
mean is measured in terms of standard
deviation.
 We may make statements such as "the data
point(score) is 1 standard deviation above the
mean" and "the score is 3 standard deviations
above the mean", which means the latter
score is three times further from the mean.
 The Mean for a set of scores is 50 while the
SD is 10.
 What can we say about someone with a score
of
 50?
 The z-score is (50-50)/10 = 0.
 Interpretation: student score is 0 distance (in
units of SD) from the mean, so the student
has scored average.
 60?
 The z-score is (60-50)/10 = 1.
 Interpretation: student has scored above
average - a distance of 1 standard deviation
above the mean.
 69.6?
 The z-score is (69.6-50)/10 = 1.96.
Interpretation: The student has scored above
average - a distance of 1.96 above the average
score.
 A z-score less than 0 represents an element
less than the mean.
 A z-score greater than 0 represents an
element greater than the mean.
 A z-score equal to 0 represents an element
equal to the mean.
 A z-score equal to 1 represents an element
that is 1 standard deviation greater than the
mean; a z-score equal to 2, 2 standard
deviations greater than the mean; etc.
 A z-score equal to -1 represents an element
that is 1 standard deviation less than the
mean; a z-score equal to -2, 2 standard
deviations less than the mean; etc.
 If the number of elements in the set is large,
about 68% of the elements have a z-score
between -1 and 1; about 95% have a z-score
between -2 and 2; and about 99% have a z-
score between -3 and 3.
Z scores

More Related Content

What's hot

Z scores
Z scoresZ scores
T distribution
T distributionT distribution
T distribution
Stephan Jade Navarro
 
illustrating the t-distribution.pptx
illustrating the t-distribution.pptxillustrating the t-distribution.pptx
illustrating the t-distribution.pptx
MARYGRACEBARBACENA
 
z-scores
z-scoresz-scores
Types of Scores & Types of Standard Scores
Types of Scores & Types of Standard ScoresTypes of Scores & Types of Standard Scores
Types of Scores & Types of Standard Scores
CRISALDO CORDURA
 
Measures of dispersion
Measures of dispersionMeasures of dispersion
Measures of dispersion
Nilanjan Bhaumik
 
Normal distribution
Normal distribution Normal distribution
Normal distribution
NoorulainRazzaq
 
Introduction to z-Scores
Introduction to z-Scores Introduction to z-Scores
Introduction to z-Scores
Sr Edith Bogue
 
Measures of Variation
Measures of VariationMeasures of Variation
Measures of Variation
Rica Joy Pontilar
 
Percentile
PercentilePercentile
Percentile
Fahadi302
 
Z score
Z scoreZ score
Z score
febru
 
variability (statistics) an introduction
variability (statistics) an introductionvariability (statistics) an introduction
variability (statistics) an introduction
Dr Rajesh Verma
 
Central limit theorem
Central limit theoremCentral limit theorem
Central limit theorem
Nadeem Uddin
 
Skew or kurtosis
Skew or kurtosisSkew or kurtosis
Skew or kurtosis
Ken Plummer
 
Normal probability curve zubia
Normal probability curve zubiaNormal probability curve zubia
Normal probability curve zubia
zubia sadiq
 
Skewness
SkewnessSkewness
Skewness
Nadeem Uddin
 
Mean, Median, and Mode - Introductory Statistics
Mean, Median, and Mode - Introductory StatisticsMean, Median, and Mode - Introductory Statistics
Mean, Median, and Mode - Introductory Statistics
quantitative_specialists
 
Normal distribution
Normal distributionNormal distribution
Normal distribution
Global Polis
 
Z scores lecture chapter 2 and 4
Z scores lecture chapter 2 and 4Z scores lecture chapter 2 and 4
Z scores lecture chapter 2 and 4Karen Price
 

What's hot (20)

Z scores
Z scoresZ scores
Z scores
 
Tscore
TscoreTscore
Tscore
 
T distribution
T distributionT distribution
T distribution
 
illustrating the t-distribution.pptx
illustrating the t-distribution.pptxillustrating the t-distribution.pptx
illustrating the t-distribution.pptx
 
z-scores
z-scoresz-scores
z-scores
 
Types of Scores & Types of Standard Scores
Types of Scores & Types of Standard ScoresTypes of Scores & Types of Standard Scores
Types of Scores & Types of Standard Scores
 
Measures of dispersion
Measures of dispersionMeasures of dispersion
Measures of dispersion
 
Normal distribution
Normal distribution Normal distribution
Normal distribution
 
Introduction to z-Scores
Introduction to z-Scores Introduction to z-Scores
Introduction to z-Scores
 
Measures of Variation
Measures of VariationMeasures of Variation
Measures of Variation
 
Percentile
PercentilePercentile
Percentile
 
Z score
Z scoreZ score
Z score
 
variability (statistics) an introduction
variability (statistics) an introductionvariability (statistics) an introduction
variability (statistics) an introduction
 
Central limit theorem
Central limit theoremCentral limit theorem
Central limit theorem
 
Skew or kurtosis
Skew or kurtosisSkew or kurtosis
Skew or kurtosis
 
Normal probability curve zubia
Normal probability curve zubiaNormal probability curve zubia
Normal probability curve zubia
 
Skewness
SkewnessSkewness
Skewness
 
Mean, Median, and Mode - Introductory Statistics
Mean, Median, and Mode - Introductory StatisticsMean, Median, and Mode - Introductory Statistics
Mean, Median, and Mode - Introductory Statistics
 
Normal distribution
Normal distributionNormal distribution
Normal distribution
 
Z scores lecture chapter 2 and 4
Z scores lecture chapter 2 and 4Z scores lecture chapter 2 and 4
Z scores lecture chapter 2 and 4
 

Viewers also liked

Z scores
Z scoresZ scores
Normal Curve and Standard Scores
Normal Curve and Standard ScoresNormal Curve and Standard Scores
Normal Curve and Standard Scores
Jenewel Azuelo
 
Altman zscore (Finance)
Altman zscore (Finance)Altman zscore (Finance)
Altman zscore (Finance)Jobin Mathew
 
Standard Score And The Normal Curve
Standard Score And The Normal CurveStandard Score And The Normal Curve
Standard Score And The Normal Curve
JOHNY NATAD
 
Thiyagu normal probability curve
Thiyagu   normal probability curveThiyagu   normal probability curve
Thiyagu normal probability curve
Thiyagu K
 
Standard deviation (3)
Standard deviation (3)Standard deviation (3)
Standard deviation (3)Sonali Prasad
 
Normal Distribution
Normal DistributionNormal Distribution
Normal Distribution
dheard3
 
Lect 2 basic ppt
Lect 2 basic pptLect 2 basic ppt
Lect 2 basic pptTao Hong
 
WWU PCard Training
WWU PCard TrainingWWU PCard Training
WWU PCard TrainingWWUWebTech
 
Using excel to convert raw score to z score
Using excel to convert raw score to z scoreUsing excel to convert raw score to z score
Using excel to convert raw score to z scoreSandra Nicks
 
Standard Normal Distribution (Education)
Standard Normal Distribution (Education)Standard Normal Distribution (Education)
Standard Normal Distribution (Education)
Anjenette Columnas
 
Sesión 5 Medidas de tendencia central
Sesión 5 Medidas de tendencia centralSesión 5 Medidas de tendencia central
Sesión 5 Medidas de tendencia central
Emilio Vega
 
HYPOTHESIS TESTING
HYPOTHESIS TESTINGHYPOTHESIS TESTING
HYPOTHESIS TESTING
Amna Sheikh
 
Elementos de estadistica_descriptiva
Elementos de estadistica_descriptivaElementos de estadistica_descriptiva
Elementos de estadistica_descriptiva
Charle1966
 
20101 d403020321203010401114460
20101 d40302032120301040111446020101 d403020321203010401114460
20101 d403020321203010401114460
Cindyta Meza Peralta
 

Viewers also liked (18)

Standard score
Standard scoreStandard score
Standard score
 
Z scores
Z scoresZ scores
Z scores
 
Normal Curve and Standard Scores
Normal Curve and Standard ScoresNormal Curve and Standard Scores
Normal Curve and Standard Scores
 
Altman zscore (Finance)
Altman zscore (Finance)Altman zscore (Finance)
Altman zscore (Finance)
 
Standard Score And The Normal Curve
Standard Score And The Normal CurveStandard Score And The Normal Curve
Standard Score And The Normal Curve
 
Thiyagu normal probability curve
Thiyagu   normal probability curveThiyagu   normal probability curve
Thiyagu normal probability curve
 
Standard deviation (3)
Standard deviation (3)Standard deviation (3)
Standard deviation (3)
 
Z test
Z testZ test
Z test
 
T test
T testT test
T test
 
Normal Distribution
Normal DistributionNormal Distribution
Normal Distribution
 
Lect 2 basic ppt
Lect 2 basic pptLect 2 basic ppt
Lect 2 basic ppt
 
WWU PCard Training
WWU PCard TrainingWWU PCard Training
WWU PCard Training
 
Using excel to convert raw score to z score
Using excel to convert raw score to z scoreUsing excel to convert raw score to z score
Using excel to convert raw score to z score
 
Standard Normal Distribution (Education)
Standard Normal Distribution (Education)Standard Normal Distribution (Education)
Standard Normal Distribution (Education)
 
Sesión 5 Medidas de tendencia central
Sesión 5 Medidas de tendencia centralSesión 5 Medidas de tendencia central
Sesión 5 Medidas de tendencia central
 
HYPOTHESIS TESTING
HYPOTHESIS TESTINGHYPOTHESIS TESTING
HYPOTHESIS TESTING
 
Elementos de estadistica_descriptiva
Elementos de estadistica_descriptivaElementos de estadistica_descriptiva
Elementos de estadistica_descriptiva
 
20101 d403020321203010401114460
20101 d40302032120301040111446020101 d403020321203010401114460
20101 d403020321203010401114460
 

Similar to Z scores

Interpreting Test Scores
Interpreting Test ScoresInterpreting Test Scores
Interpreting Test Scores
Elton John Embodo
 
Work hard to make certain that the results you have are accurate b.docx
Work hard to make certain that the results you have are accurate b.docxWork hard to make certain that the results you have are accurate b.docx
Work hard to make certain that the results you have are accurate b.docx
keilenettie
 
Derived Scores
Derived ScoresDerived Scores
Derived Scores
Dr. Sarita Anand
 
Descriptive statistics
Descriptive statisticsDescriptive statistics
Descriptive statistics
mercy rani
 
O Z Scores 68 O The Normal Curve 73 O Sample and Popul.docx
O Z Scores 68 O The Normal Curve 73 O Sample and Popul.docxO Z Scores 68 O The Normal Curve 73 O Sample and Popul.docx
O Z Scores 68 O The Normal Curve 73 O Sample and Popul.docx
hopeaustin33688
 
Frequencies, Proportion, GraphsFebruary 8th, 2016Frequen.docx
Frequencies, Proportion, GraphsFebruary 8th, 2016Frequen.docxFrequencies, Proportion, GraphsFebruary 8th, 2016Frequen.docx
Frequencies, Proportion, GraphsFebruary 8th, 2016Frequen.docx
hanneloremccaffery
 
Lesson 8 zscore
Lesson 8 zscoreLesson 8 zscore
Lesson 8 zscorenurun2010
 
Median
MedianMedian
#06198 Topic PSY 325 Statistics for the Behavioral & Social Scien.docx
#06198 Topic PSY 325 Statistics for the Behavioral & Social Scien.docx#06198 Topic PSY 325 Statistics for the Behavioral & Social Scien.docx
#06198 Topic PSY 325 Statistics for the Behavioral & Social Scien.docx
AASTHA76
 
Statistics and probability lesson6&7
Statistics and probability lesson6&7Statistics and probability lesson6&7
Statistics and probability lesson6&7
MARIA CHRISTITA POLINAG
 
F ProjHOSPITAL INPATIENT P & L20162017Variance Variance Per DC 20.docx
F ProjHOSPITAL INPATIENT P & L20162017Variance Variance Per DC 20.docxF ProjHOSPITAL INPATIENT P & L20162017Variance Variance Per DC 20.docx
F ProjHOSPITAL INPATIENT P & L20162017Variance Variance Per DC 20.docx
mecklenburgstrelitzh
 
zScores_HANDOUT.pdf
zScores_HANDOUT.pdfzScores_HANDOUT.pdf
zScores_HANDOUT.pdf
Joebest8
 
Converting-a-Normal-Random-Variable-to-a-Standard.pptx
Converting-a-Normal-Random-Variable-to-a-Standard.pptxConverting-a-Normal-Random-Variable-to-a-Standard.pptx
Converting-a-Normal-Random-Variable-to-a-Standard.pptx
borielroy279
 
Day 4 normal curve and standard scores
Day 4 normal curve and standard scoresDay 4 normal curve and standard scores
Day 4 normal curve and standard scores
Elih Sutisna Yanto
 
Statistics And Correlation
Statistics And CorrelationStatistics And Correlation
Statistics And Correlationpankaj prabhakar
 
Interpretation of test Scores
Interpretation of test ScoresInterpretation of test Scores
Interpretation of test Scores
ShaharyarShoukatShou
 

Similar to Z scores (20)

Interpreting Test Scores
Interpreting Test ScoresInterpreting Test Scores
Interpreting Test Scores
 
Work hard to make certain that the results you have are accurate b.docx
Work hard to make certain that the results you have are accurate b.docxWork hard to make certain that the results you have are accurate b.docx
Work hard to make certain that the results you have are accurate b.docx
 
Chapters 2 & 4
Chapters 2 & 4Chapters 2 & 4
Chapters 2 & 4
 
Chapters 2 & 4
Chapters 2 & 4Chapters 2 & 4
Chapters 2 & 4
 
Derived Scores
Derived ScoresDerived Scores
Derived Scores
 
Descriptive statistics
Descriptive statisticsDescriptive statistics
Descriptive statistics
 
Chapters 2 4
Chapters 2  4Chapters 2  4
Chapters 2 4
 
O Z Scores 68 O The Normal Curve 73 O Sample and Popul.docx
O Z Scores 68 O The Normal Curve 73 O Sample and Popul.docxO Z Scores 68 O The Normal Curve 73 O Sample and Popul.docx
O Z Scores 68 O The Normal Curve 73 O Sample and Popul.docx
 
Frequencies, Proportion, GraphsFebruary 8th, 2016Frequen.docx
Frequencies, Proportion, GraphsFebruary 8th, 2016Frequen.docxFrequencies, Proportion, GraphsFebruary 8th, 2016Frequen.docx
Frequencies, Proportion, GraphsFebruary 8th, 2016Frequen.docx
 
Lesson 8 zscore
Lesson 8 zscoreLesson 8 zscore
Lesson 8 zscore
 
Median
MedianMedian
Median
 
#06198 Topic PSY 325 Statistics for the Behavioral & Social Scien.docx
#06198 Topic PSY 325 Statistics for the Behavioral & Social Scien.docx#06198 Topic PSY 325 Statistics for the Behavioral & Social Scien.docx
#06198 Topic PSY 325 Statistics for the Behavioral & Social Scien.docx
 
Statistics and probability lesson6&7
Statistics and probability lesson6&7Statistics and probability lesson6&7
Statistics and probability lesson6&7
 
F ProjHOSPITAL INPATIENT P & L20162017Variance Variance Per DC 20.docx
F ProjHOSPITAL INPATIENT P & L20162017Variance Variance Per DC 20.docxF ProjHOSPITAL INPATIENT P & L20162017Variance Variance Per DC 20.docx
F ProjHOSPITAL INPATIENT P & L20162017Variance Variance Per DC 20.docx
 
zScores_HANDOUT.pdf
zScores_HANDOUT.pdfzScores_HANDOUT.pdf
zScores_HANDOUT.pdf
 
Converting-a-Normal-Random-Variable-to-a-Standard.pptx
Converting-a-Normal-Random-Variable-to-a-Standard.pptxConverting-a-Normal-Random-Variable-to-a-Standard.pptx
Converting-a-Normal-Random-Variable-to-a-Standard.pptx
 
Day 4 normal curve and standard scores
Day 4 normal curve and standard scoresDay 4 normal curve and standard scores
Day 4 normal curve and standard scores
 
Statistics And Correlation
Statistics And CorrelationStatistics And Correlation
Statistics And Correlation
 
statistics
statisticsstatistics
statistics
 
Interpretation of test Scores
Interpretation of test ScoresInterpretation of test Scores
Interpretation of test Scores
 

Recently uploaded

The Accursed House by Émile Gaboriau.pptx
The Accursed House by Émile Gaboriau.pptxThe Accursed House by Émile Gaboriau.pptx
The Accursed House by Émile Gaboriau.pptx
DhatriParmar
 
Digital Tools and AI for Teaching Learning and Research
Digital Tools and AI for Teaching Learning and ResearchDigital Tools and AI for Teaching Learning and Research
Digital Tools and AI for Teaching Learning and Research
Vikramjit Singh
 
Mule 4.6 & Java 17 Upgrade | MuleSoft Mysore Meetup #46
Mule 4.6 & Java 17 Upgrade | MuleSoft Mysore Meetup #46Mule 4.6 & Java 17 Upgrade | MuleSoft Mysore Meetup #46
Mule 4.6 & Java 17 Upgrade | MuleSoft Mysore Meetup #46
MysoreMuleSoftMeetup
 
special B.ed 2nd year old paper_20240531.pdf
special B.ed 2nd year old paper_20240531.pdfspecial B.ed 2nd year old paper_20240531.pdf
special B.ed 2nd year old paper_20240531.pdf
Special education needs
 
Lapbook sobre os Regimes Totalitários.pdf
Lapbook sobre os Regimes Totalitários.pdfLapbook sobre os Regimes Totalitários.pdf
Lapbook sobre os Regimes Totalitários.pdf
Jean Carlos Nunes Paixão
 
Biological Screening of Herbal Drugs in detailed.
Biological Screening of Herbal Drugs in detailed.Biological Screening of Herbal Drugs in detailed.
Biological Screening of Herbal Drugs in detailed.
Ashokrao Mane college of Pharmacy Peth-Vadgaon
 
Additional Benefits for Employee Website.pdf
Additional Benefits for Employee Website.pdfAdditional Benefits for Employee Website.pdf
Additional Benefits for Employee Website.pdf
joachimlavalley1
 
Embracing GenAI - A Strategic Imperative
Embracing GenAI - A Strategic ImperativeEmbracing GenAI - A Strategic Imperative
Embracing GenAI - A Strategic Imperative
Peter Windle
 
Polish students' mobility in the Czech Republic
Polish students' mobility in the Czech RepublicPolish students' mobility in the Czech Republic
Polish students' mobility in the Czech Republic
Anna Sz.
 
Sha'Carri Richardson Presentation 202345
Sha'Carri Richardson Presentation 202345Sha'Carri Richardson Presentation 202345
Sha'Carri Richardson Presentation 202345
beazzy04
 
The French Revolution Class 9 Study Material pdf free download
The French Revolution Class 9 Study Material pdf free downloadThe French Revolution Class 9 Study Material pdf free download
The French Revolution Class 9 Study Material pdf free download
Vivekanand Anglo Vedic Academy
 
Operation Blue Star - Saka Neela Tara
Operation Blue Star   -  Saka Neela TaraOperation Blue Star   -  Saka Neela Tara
Operation Blue Star - Saka Neela Tara
Balvir Singh
 
The basics of sentences session 5pptx.pptx
The basics of sentences session 5pptx.pptxThe basics of sentences session 5pptx.pptx
The basics of sentences session 5pptx.pptx
heathfieldcps1
 
Thesis Statement for students diagnonsed withADHD.ppt
Thesis Statement for students diagnonsed withADHD.pptThesis Statement for students diagnonsed withADHD.ppt
Thesis Statement for students diagnonsed withADHD.ppt
EverAndrsGuerraGuerr
 
1.4 modern child centered education - mahatma gandhi-2.pptx
1.4 modern child centered education - mahatma gandhi-2.pptx1.4 modern child centered education - mahatma gandhi-2.pptx
1.4 modern child centered education - mahatma gandhi-2.pptx
JosvitaDsouza2
 
Acetabularia Information For Class 9 .docx
Acetabularia Information For Class 9  .docxAcetabularia Information For Class 9  .docx
Acetabularia Information For Class 9 .docx
vaibhavrinwa19
 
Unit 8 - Information and Communication Technology (Paper I).pdf
Unit 8 - Information and Communication Technology (Paper I).pdfUnit 8 - Information and Communication Technology (Paper I).pdf
Unit 8 - Information and Communication Technology (Paper I).pdf
Thiyagu K
 
How libraries can support authors with open access requirements for UKRI fund...
How libraries can support authors with open access requirements for UKRI fund...How libraries can support authors with open access requirements for UKRI fund...
How libraries can support authors with open access requirements for UKRI fund...
Jisc
 
678020731-Sumas-y-Restas-Para-Colorear.pdf
678020731-Sumas-y-Restas-Para-Colorear.pdf678020731-Sumas-y-Restas-Para-Colorear.pdf
678020731-Sumas-y-Restas-Para-Colorear.pdf
CarlosHernanMontoyab2
 
Supporting (UKRI) OA monographs at Salford.pptx
Supporting (UKRI) OA monographs at Salford.pptxSupporting (UKRI) OA monographs at Salford.pptx
Supporting (UKRI) OA monographs at Salford.pptx
Jisc
 

Recently uploaded (20)

The Accursed House by Émile Gaboriau.pptx
The Accursed House by Émile Gaboriau.pptxThe Accursed House by Émile Gaboriau.pptx
The Accursed House by Émile Gaboriau.pptx
 
Digital Tools and AI for Teaching Learning and Research
Digital Tools and AI for Teaching Learning and ResearchDigital Tools and AI for Teaching Learning and Research
Digital Tools and AI for Teaching Learning and Research
 
Mule 4.6 & Java 17 Upgrade | MuleSoft Mysore Meetup #46
Mule 4.6 & Java 17 Upgrade | MuleSoft Mysore Meetup #46Mule 4.6 & Java 17 Upgrade | MuleSoft Mysore Meetup #46
Mule 4.6 & Java 17 Upgrade | MuleSoft Mysore Meetup #46
 
special B.ed 2nd year old paper_20240531.pdf
special B.ed 2nd year old paper_20240531.pdfspecial B.ed 2nd year old paper_20240531.pdf
special B.ed 2nd year old paper_20240531.pdf
 
Lapbook sobre os Regimes Totalitários.pdf
Lapbook sobre os Regimes Totalitários.pdfLapbook sobre os Regimes Totalitários.pdf
Lapbook sobre os Regimes Totalitários.pdf
 
Biological Screening of Herbal Drugs in detailed.
Biological Screening of Herbal Drugs in detailed.Biological Screening of Herbal Drugs in detailed.
Biological Screening of Herbal Drugs in detailed.
 
Additional Benefits for Employee Website.pdf
Additional Benefits for Employee Website.pdfAdditional Benefits for Employee Website.pdf
Additional Benefits for Employee Website.pdf
 
Embracing GenAI - A Strategic Imperative
Embracing GenAI - A Strategic ImperativeEmbracing GenAI - A Strategic Imperative
Embracing GenAI - A Strategic Imperative
 
Polish students' mobility in the Czech Republic
Polish students' mobility in the Czech RepublicPolish students' mobility in the Czech Republic
Polish students' mobility in the Czech Republic
 
Sha'Carri Richardson Presentation 202345
Sha'Carri Richardson Presentation 202345Sha'Carri Richardson Presentation 202345
Sha'Carri Richardson Presentation 202345
 
The French Revolution Class 9 Study Material pdf free download
The French Revolution Class 9 Study Material pdf free downloadThe French Revolution Class 9 Study Material pdf free download
The French Revolution Class 9 Study Material pdf free download
 
Operation Blue Star - Saka Neela Tara
Operation Blue Star   -  Saka Neela TaraOperation Blue Star   -  Saka Neela Tara
Operation Blue Star - Saka Neela Tara
 
The basics of sentences session 5pptx.pptx
The basics of sentences session 5pptx.pptxThe basics of sentences session 5pptx.pptx
The basics of sentences session 5pptx.pptx
 
Thesis Statement for students diagnonsed withADHD.ppt
Thesis Statement for students diagnonsed withADHD.pptThesis Statement for students diagnonsed withADHD.ppt
Thesis Statement for students diagnonsed withADHD.ppt
 
1.4 modern child centered education - mahatma gandhi-2.pptx
1.4 modern child centered education - mahatma gandhi-2.pptx1.4 modern child centered education - mahatma gandhi-2.pptx
1.4 modern child centered education - mahatma gandhi-2.pptx
 
Acetabularia Information For Class 9 .docx
Acetabularia Information For Class 9  .docxAcetabularia Information For Class 9  .docx
Acetabularia Information For Class 9 .docx
 
Unit 8 - Information and Communication Technology (Paper I).pdf
Unit 8 - Information and Communication Technology (Paper I).pdfUnit 8 - Information and Communication Technology (Paper I).pdf
Unit 8 - Information and Communication Technology (Paper I).pdf
 
How libraries can support authors with open access requirements for UKRI fund...
How libraries can support authors with open access requirements for UKRI fund...How libraries can support authors with open access requirements for UKRI fund...
How libraries can support authors with open access requirements for UKRI fund...
 
678020731-Sumas-y-Restas-Para-Colorear.pdf
678020731-Sumas-y-Restas-Para-Colorear.pdf678020731-Sumas-y-Restas-Para-Colorear.pdf
678020731-Sumas-y-Restas-Para-Colorear.pdf
 
Supporting (UKRI) OA monographs at Salford.pptx
Supporting (UKRI) OA monographs at Salford.pptxSupporting (UKRI) OA monographs at Salford.pptx
Supporting (UKRI) OA monographs at Salford.pptx
 

Z scores

  • 2.  Marks awarded by counting the number of correct answers on a test script are known as raw marks.  Chandralatha got 16 marks out of 20 for Psychology at the monthly test.  Is it a high mark or a low mark? What do you think?
  • 3.  It may appear a high mark, but in fact the statement is virtually meaningless on its own.  16 may be the lowest mark of a particular group of scores. If the test was difficult, 16 may well be a very high mark.
  • 4. Raw scores by themselves are not very useful. Raw scores need to be converted into standard scores.
  • 5.  A z-score (a standard score) indicates how many standard deviations an element is from the mean. A z-score can be calculated from the following formula.  z = (X - M) / SD  where z is the z-score, X is the value of the element, M is the population mean, and SD is the standard deviation.
  • 6.  The z-score is associated with the normal distribution and it is a number that may be used to:  tell you where a score lies compared with the rest of the data, above/below mean.  compare scores from different normal distributions
  • 7.  The Z-score is a number that may be calculated for each data point in a set of data.  The number is continuous and may be negative or positive, and there is no max/min value.  The z-score tells us how "far" that data point is from the mean. This distance from the mean is measured in terms of standard deviation.
  • 8.  We may make statements such as "the data point(score) is 1 standard deviation above the mean" and "the score is 3 standard deviations above the mean", which means the latter score is three times further from the mean.
  • 9.  The Mean for a set of scores is 50 while the SD is 10.  What can we say about someone with a score of  50?  The z-score is (50-50)/10 = 0.  Interpretation: student score is 0 distance (in units of SD) from the mean, so the student has scored average.
  • 10.  60?  The z-score is (60-50)/10 = 1.  Interpretation: student has scored above average - a distance of 1 standard deviation above the mean.
  • 11.  69.6?  The z-score is (69.6-50)/10 = 1.96. Interpretation: The student has scored above average - a distance of 1.96 above the average score.
  • 12.  A z-score less than 0 represents an element less than the mean.  A z-score greater than 0 represents an element greater than the mean.  A z-score equal to 0 represents an element equal to the mean.
  • 13.  A z-score equal to 1 represents an element that is 1 standard deviation greater than the mean; a z-score equal to 2, 2 standard deviations greater than the mean; etc.  A z-score equal to -1 represents an element that is 1 standard deviation less than the mean; a z-score equal to -2, 2 standard deviations less than the mean; etc.
  • 14.  If the number of elements in the set is large, about 68% of the elements have a z-score between -1 and 1; about 95% have a z-score between -2 and 2; and about 99% have a z- score between -3 and 3.