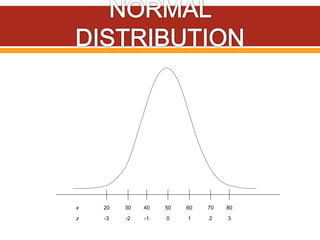
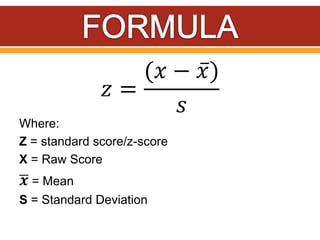
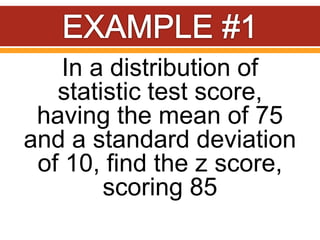
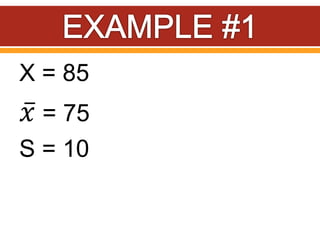
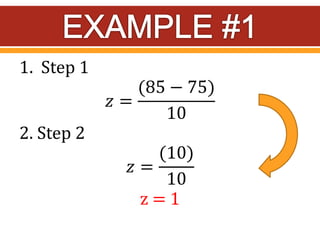
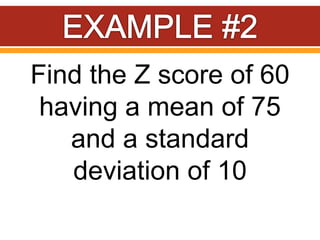
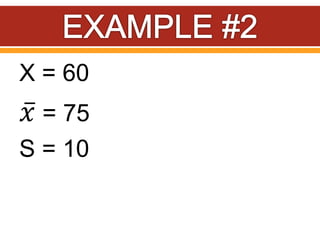
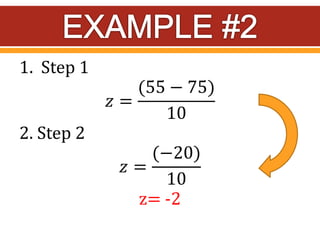
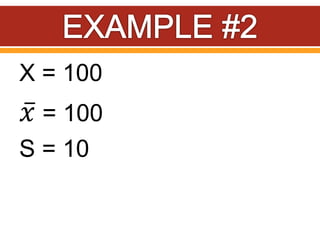
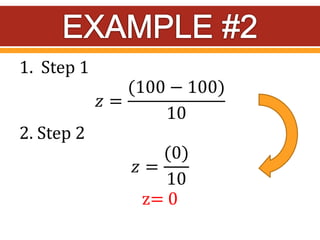
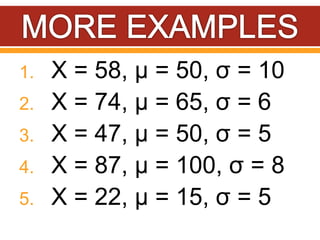
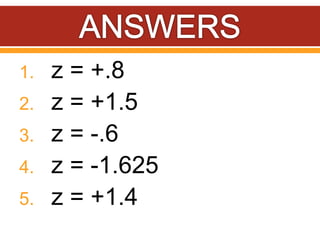
Z-scores, also called standard scores, measure how many standard deviations a raw score is above or below the mean of its distribution. A z-score indicates where a particular score lies in relation to all other scores in the distribution. To calculate a z-score, the raw score is subtracted from the mean and divided by the standard deviation of the distribution. Z-scores can be positive, negative, or zero, depending on whether the raw score is above, below, or equal to the mean. Several examples are provided to demonstrate calculating z-scores from raw scores, means, and standard deviations.
In statistics, the standard score is the (signed) number of standard deviations an observation or datum is above the mean. Thus, a positive standard score represents a datum above the mean, while a negative standard score represents a datum below the mean. It is a dimensionless quantity obtained by subtracting the population mean from an individual raw score and then dividing the difference by the population standard deviation. This conversion process is called standardizing or normalizing (however, "normalizing" can refer to many types of ratios; see normalization (statistics) for more).Standard scores are also called z-values, z-scores, normal scores, and standardized variables; the use of "Z" is because the normal distribution is also known as the "Z distribution". They are most frequently used to compare a sample to a standard normal deviate (standard normal distribution, with μ = 0 and σ = 1), though they can be defined without assumptions of normality.
The quartile deviation is half of the difference between first quartile (Q1) and third quartile (Q3). This is also known as quartile coefficient of dispersion.
QD = (푸ퟑ−푸ퟏ)/ퟐ
Measures of Central Tendency
Requirements of good measures of central tendency
mean, median, mode
skewness of distribution
relation between mean, median,mode
Variability, the normal distribution and converted scoresNema Grace Medillo
Understanding mean and standard deviation in the normal distribution curve, Understanding scores using range, semi-interquartile range, standard deviation and variance. Converting scores through z- scores and t - scores,
Please Subscribe to this Channel for more solutions and lectures
http://www.youtube.com/onlineteaching
Chapter 7: Estimating Parameters and Determining Sample Sizes
7.3: Estimating a Population Standard Deviation or Variance
Please Subscribe to this Channel for more solutions and lectures
http://www.youtube.com/onlineteaching
Chapter 7: Estimating Parameters and Determining Sample Sizes
7.3: Estimating a Population Standard Deviation or Variance
Read| The latest issue of The Challenger is here! We are thrilled to announce that our school paper has qualified for the NATIONAL SCHOOLS PRESS CONFERENCE (NSPC) 2024. Thank you for your unwavering support and trust. Dive into the stories that made us stand out!
The Indian economy is classified into different sectors to simplify the analysis and understanding of economic activities. For Class 10, it's essential to grasp the sectors of the Indian economy, understand their characteristics, and recognize their importance. This guide will provide detailed notes on the Sectors of the Indian Economy Class 10, using specific long-tail keywords to enhance comprehension.
For more information, visit-www.vavaclasses.com
Instructions for Submissions thorugh G- Classroom.pptxJheel Barad
This presentation provides a briefing on how to upload submissions and documents in Google Classroom. It was prepared as part of an orientation for new Sainik School in-service teacher trainees. As a training officer, my goal is to ensure that you are comfortable and proficient with this essential tool for managing assignments and fostering student engagement.
The French Revolution, which began in 1789, was a period of radical social and political upheaval in France. It marked the decline of absolute monarchies, the rise of secular and democratic republics, and the eventual rise of Napoleon Bonaparte. This revolutionary period is crucial in understanding the transition from feudalism to modernity in Europe.
For more information, visit-www.vavaclasses.com
2024.06.01 Introducing a competency framework for languag learning materials ...Sandy Millin
http://sandymillin.wordpress.com/iateflwebinar2024
Published classroom materials form the basis of syllabuses, drive teacher professional development, and have a potentially huge influence on learners, teachers and education systems. All teachers also create their own materials, whether a few sentences on a blackboard, a highly-structured fully-realised online course, or anything in between. Despite this, the knowledge and skills needed to create effective language learning materials are rarely part of teacher training, and are mostly learnt by trial and error.
Knowledge and skills frameworks, generally called competency frameworks, for ELT teachers, trainers and managers have existed for a few years now. However, until I created one for my MA dissertation, there wasn’t one drawing together what we need to know and do to be able to effectively produce language learning materials.
This webinar will introduce you to my framework, highlighting the key competencies I identified from my research. It will also show how anybody involved in language teaching (any language, not just English!), teacher training, managing schools or developing language learning materials can benefit from using the framework.
How to Make a Field invisible in Odoo 17Celine George
It is possible to hide or invisible some fields in odoo. Commonly using “invisible” attribute in the field definition to invisible the fields. This slide will show how to make a field invisible in odoo 17.
How to Split Bills in the Odoo 17 POS ModuleCeline George
Bills have a main role in point of sale procedure. It will help to track sales, handling payments and giving receipts to customers. Bill splitting also has an important role in POS. For example, If some friends come together for dinner and if they want to divide the bill then it is possible by POS bill splitting. This slide will show how to split bills in odoo 17 POS.
We all have good and bad thoughts from time to time and situation to situation. We are bombarded daily with spiraling thoughts(both negative and positive) creating all-consuming feel , making us difficult to manage with associated suffering. Good thoughts are like our Mob Signal (Positive thought) amidst noise(negative thought) in the atmosphere. Negative thoughts like noise outweigh positive thoughts. These thoughts often create unwanted confusion, trouble, stress and frustration in our mind as well as chaos in our physical world. Negative thoughts are also known as “distorted thinking”.
Students, digital devices and success - Andreas Schleicher - 27 May 2024..pptxEduSkills OECD
Andreas Schleicher presents at the OECD webinar ‘Digital devices in schools: detrimental distraction or secret to success?’ on 27 May 2024. The presentation was based on findings from PISA 2022 results and the webinar helped launch the PISA in Focus ‘Managing screen time: How to protect and equip students against distraction’ https://www.oecd-ilibrary.org/education/managing-screen-time_7c225af4-en and the OECD Education Policy Perspective ‘Students, digital devices and success’ can be found here - https://oe.cd/il/5yV
Unit 8 - Information and Communication Technology (Paper I).pdfThiyagu K
This slides describes the basic concepts of ICT, basics of Email, Emerging Technology and Digital Initiatives in Education. This presentations aligns with the UGC Paper I syllabus.
2. Also called as z scores
Measures the difference
between the raw score and the
mean of the distribution using
standard deviation of the
distribution as a unit of
4. By itself, a raw score or X
value provides very little
information about how that
particular score compares
with other values in the
distribution.
5. A score of X = 53, for
example, may be a
relatively low score, or an
average score, or an
extremely high score
depending on the mean and
standard deviation for the
distribution from which the
score was obtained.
7. If the raw score is
transformed into a z-score,
however, the value of the z-
score tells exactly where the
score is located relative to
all the other scores in the
distribution.
8. 𝑧 =
(𝑥 − 𝑥)
𝑠
Where:
Z = standard score/z-score
X = Raw Score
𝒙 = Mean
S = Standard Deviation
9. 𝑧 =
(𝑥 − 𝜇)
𝜎
Where:
Z = standard score/z-score
X = Raw Score
𝝁 = Mean
𝝈 = (sigma) Standard Deviation
10. Z-scores can be positive
(above the mean),
negative (below the
mean), or zero (equal to
the mean)