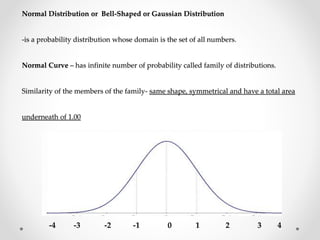
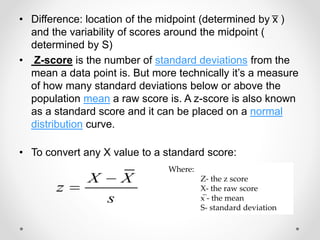
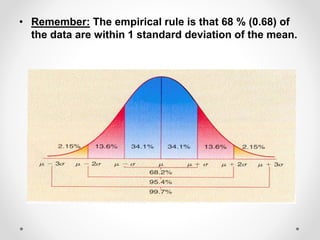
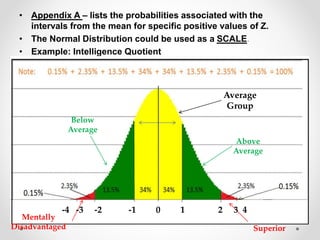
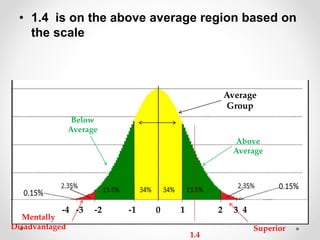
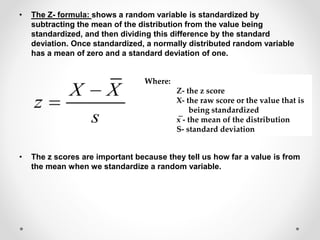
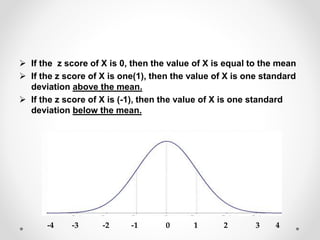
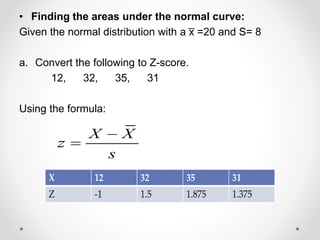
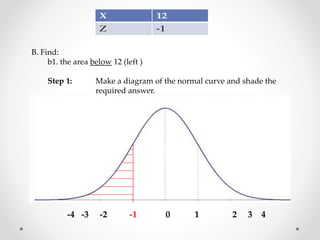
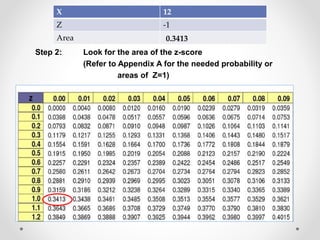
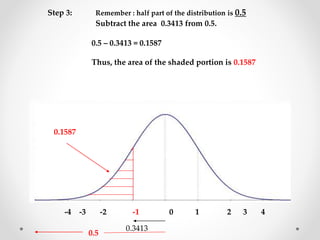
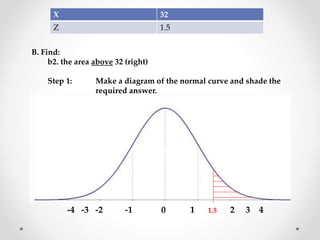
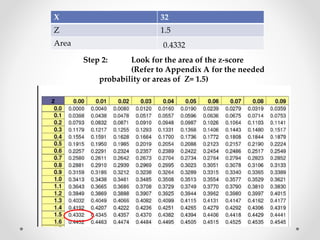
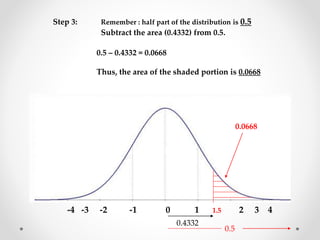
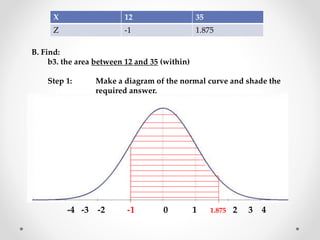
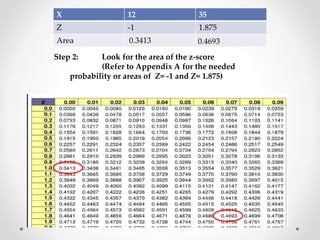
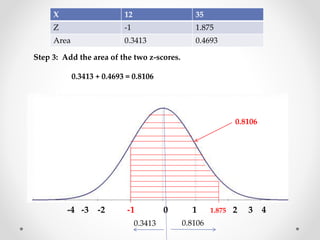
Standard Scores
and the Normal
Curve
Reporters:
Grace V. Domingo
Elizabeth Aireen V. Villanueva
Normal Distribution or Bell-Shaped or Gaussian Distribution
-is a probability distribution whose domain is the set of all numbers.
Normal Curve – has infinite number of probability called family of distributions.
Similarity of the members of the family- same shape, symmetrical and have a total area
underneath of 1.00
-4 -3 -2 -1 0 1 2 3 4
• Difference: location of the midpoint (determined by x̅ )
and the variability of scores around the midpoint (
determined by S)
• Z-score is the number of standard deviations from the
mean a data point is. But more technically it’s a measure
of how many standard deviations below or above the
population mean a raw score is. A z-score is also known
as a standard score and it can be placed on a normal
distribution curve.
• To convert any X value to a standard score:
Where:
Z- the z score
X- the raw score
x̅ - the mean
S- standard deviation
• Remember: The empirical rule is that 68 % (0.68) of
the data are within 1 standard deviation of the mean.
• Appendix A – lists the probabilities associated with the
intervals from the mean for specific positive values of Z.
• The Normal Distribution could be used as a SCALE.
• Example: Intelligence Quotient
Average
Group
Above
Average
Superior
Below
Average
Mentally
Disadvantaged
-4 -3 -2 -1 0 1 2 3 4
• Convert the following score to Z score and locate
them in the Normal distribution.
• Given: X=79, x̅ = 72, S=5
• Using the formula:
= 79 – 72 = 1.4
5
• 1.4 is on the above average region based on
the scale
Average
Group
Above
Average
Superior
Below
Average
Mentally
Disadvantaged
1.4
-4 -3 -2 -1 0 1 2 3 4
• The Z- formula: shows a random variable is standardized by
subtracting the mean of the distribution from the value being
standardized, and then dividing this difference by the standard
deviation. Once standardized, a normally distributed random variable
has a mean of zero and a standard deviation of one.
• The z scores are important because they tell us how far a value is from
the mean when we standardize a random variable.
Where:
Z- the z score
X- the raw score or the value that is
being standardized
x̅ - the mean of the distribution
S- standard deviation
 If the z score of X is 0, then the value of X is equal to the mean
 If the z score of X is one(1), then the value of X is one standard
deviation above the mean.
 If the z score of X is (-1), then the value of X is one standard
deviation below the mean.
-4 -3 -2 -1 0 1 2 3 4
• Finding the areas under the normal curve:
Given the normal distribution with a x̅ =20 and S= 8
a. Convert the following to Z-score.
12, 32, 35, 31
Using the formula:
B. Find:
b1. the area below 12 (left )
Step 1: Make a diagram of the normal curve and shade the
required answer.
-4 -3 -2 -1 0 1 2 3 4
Step 2: Look for the area of the z-score
(Refer to Appendix A for the needed probability or
areas of Z=1)
X 12
Z -1
Area 0.3413
-4 -3 -2 -1 0 1 2 3 4
Step 3: Remember : half part of the distribution is 0.5
Subtract the area 0.3413 from 0.5.
0.3413
0.5
0.1587
0.5 – 0.3413 = 0.1587
Thus, the area of the shaded portion is 0.1587
B. Find:
b2. the area above 32 (right)
Step 1: Make a diagram of the normal curve and shade the
required answer.
-4 -3 -2 -1 0 1 1.5 2 3 4
X 32
Z 1.5
Step 2: Look for the area of the z-score
(Refer to Appendix A for the needed
probability or areas of Z= 1.5)
X 32
Z 1.5
Area 0.4332
Step 3: Remember : half part of the distribution is 0.5
Subtract the area (0.4332) from 0.5.
-4 -3 -2 -1 0 1 1.5 2 3 4
0.4332
0.5
0.5 – 0.4332 = 0.0668
Thus, the area of the shaded portion is 0.0668
0.0668
B. Find:
b3. the area between 12 and 35 (within)
Step 1: Make a diagram of the normal curve and shade the
required answer.
-4 -3 -2 -1 0 1 1.875 2 3 4
X 12 35
Z -1 1.875
Step 2: Look for the area of the z-score
(Refer to Appendix A for the needed
probability or areas of Z= -1 and Z= 1.875)
X 12 35
Z -1 1.875
Area 0.3413 0.4693
Step 3: Add the area of the two z-scores.
0.3413 + 0.4693 = 0.8106
-4 -3 -2 -1 0 1 1.875 2 3 4
X 12 35
Z -1 1.875
Area 0.3413 0.4693
0.8106
0.3413 0.8106
Standard Scores and the Normal Curve

Standard Scores and the Normal Curve

  • 1.
    Standard Scores and theNormal Curve Reporters: Grace V. Domingo Elizabeth Aireen V. Villanueva
  • 2.
    Normal Distribution orBell-Shaped or Gaussian Distribution -is a probability distribution whose domain is the set of all numbers. Normal Curve – has infinite number of probability called family of distributions. Similarity of the members of the family- same shape, symmetrical and have a total area underneath of 1.00 -4 -3 -2 -1 0 1 2 3 4
  • 3.
    • Difference: locationof the midpoint (determined by x̅ ) and the variability of scores around the midpoint ( determined by S) • Z-score is the number of standard deviations from the mean a data point is. But more technically it’s a measure of how many standard deviations below or above the population mean a raw score is. A z-score is also known as a standard score and it can be placed on a normal distribution curve. • To convert any X value to a standard score: Where: Z- the z score X- the raw score x̅ - the mean S- standard deviation
  • 4.
    • Remember: Theempirical rule is that 68 % (0.68) of the data are within 1 standard deviation of the mean.
  • 5.
    • Appendix A– lists the probabilities associated with the intervals from the mean for specific positive values of Z. • The Normal Distribution could be used as a SCALE. • Example: Intelligence Quotient Average Group Above Average Superior Below Average Mentally Disadvantaged -4 -3 -2 -1 0 1 2 3 4
  • 6.
    • Convert thefollowing score to Z score and locate them in the Normal distribution. • Given: X=79, x̅ = 72, S=5 • Using the formula: = 79 – 72 = 1.4 5
  • 7.
    • 1.4 ison the above average region based on the scale Average Group Above Average Superior Below Average Mentally Disadvantaged 1.4 -4 -3 -2 -1 0 1 2 3 4
  • 8.
    • The Z-formula: shows a random variable is standardized by subtracting the mean of the distribution from the value being standardized, and then dividing this difference by the standard deviation. Once standardized, a normally distributed random variable has a mean of zero and a standard deviation of one. • The z scores are important because they tell us how far a value is from the mean when we standardize a random variable. Where: Z- the z score X- the raw score or the value that is being standardized x̅ - the mean of the distribution S- standard deviation
  • 9.
     If thez score of X is 0, then the value of X is equal to the mean  If the z score of X is one(1), then the value of X is one standard deviation above the mean.  If the z score of X is (-1), then the value of X is one standard deviation below the mean. -4 -3 -2 -1 0 1 2 3 4
  • 10.
    • Finding theareas under the normal curve: Given the normal distribution with a x̅ =20 and S= 8 a. Convert the following to Z-score. 12, 32, 35, 31 Using the formula:
  • 11.
    B. Find: b1. thearea below 12 (left ) Step 1: Make a diagram of the normal curve and shade the required answer. -4 -3 -2 -1 0 1 2 3 4
  • 12.
    Step 2: Lookfor the area of the z-score (Refer to Appendix A for the needed probability or areas of Z=1) X 12 Z -1 Area 0.3413
  • 13.
    -4 -3 -2-1 0 1 2 3 4 Step 3: Remember : half part of the distribution is 0.5 Subtract the area 0.3413 from 0.5. 0.3413 0.5 0.1587 0.5 – 0.3413 = 0.1587 Thus, the area of the shaded portion is 0.1587
  • 14.
    B. Find: b2. thearea above 32 (right) Step 1: Make a diagram of the normal curve and shade the required answer. -4 -3 -2 -1 0 1 1.5 2 3 4 X 32 Z 1.5
  • 15.
    Step 2: Lookfor the area of the z-score (Refer to Appendix A for the needed probability or areas of Z= 1.5) X 32 Z 1.5 Area 0.4332
  • 16.
    Step 3: Remember: half part of the distribution is 0.5 Subtract the area (0.4332) from 0.5. -4 -3 -2 -1 0 1 1.5 2 3 4 0.4332 0.5 0.5 – 0.4332 = 0.0668 Thus, the area of the shaded portion is 0.0668 0.0668
  • 17.
    B. Find: b3. thearea between 12 and 35 (within) Step 1: Make a diagram of the normal curve and shade the required answer. -4 -3 -2 -1 0 1 1.875 2 3 4 X 12 35 Z -1 1.875
  • 18.
    Step 2: Lookfor the area of the z-score (Refer to Appendix A for the needed probability or areas of Z= -1 and Z= 1.875) X 12 35 Z -1 1.875 Area 0.3413 0.4693
  • 19.
    Step 3: Addthe area of the two z-scores. 0.3413 + 0.4693 = 0.8106 -4 -3 -2 -1 0 1 1.875 2 3 4 X 12 35 Z -1 1.875 Area 0.3413 0.4693 0.8106 0.3413 0.8106

Editor's Notes