1. 26th Sept’14 Equity Bazaar
Nifty
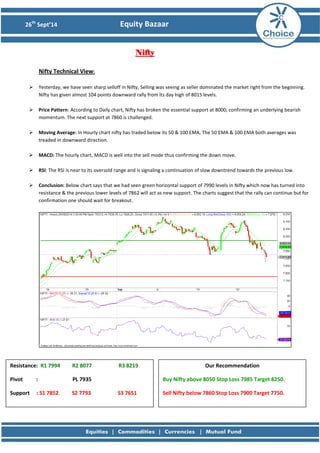
Nifty Technical View:
Yesterday, we have seen sharp selloff in Nifty, Selling was seeing as seller dominated the market right from the beginning. Nifty has given almost 104 points downward rally from its day high of 8015 levels.
Price Pattern: According to Daily chart, Nifty has broken the essential support at 8000, confirming an underlying bearish momentum. The next support at 7860 is challenged.
Moving Average: In Hourly chart nifty has traded below its 50 & 100 EMA, The 50 EMA & 100 EMA both averages was treaded in downward direction.
MACD: The hourly chart, MACD is well into the sell mode thus confirming the down move.
RSI: The RSI is near to its oversold range and is signaling a continuation of slow downtrend towards the previous low.
Conclusion: Below chart says that we had seen green horizontal support of 7990 levels in Nifty which now has turned into resistance & the previous lower levels of 7862 will act as new support. The charts suggest that the rally can continue but for confirmation one should wait for breakout.
Resistance: R1 7994 R2 8077 R3 8219
Pivot : PL 7935
Support : S1 7852 S2 7793 S3 7651
Our Recommendation
Buy Nifty above 8050 Stop Loss 7985 Target 8250.
Sell Nifty below 7860 Stop Loss 7900 Target 7750.
2. 26th Sept’14 Equity Bazaar
Bank Nifty
Bank Nifty Technical View:
Yesterday, we have seen Bank Nifty has also given almost 411 points correction in a single trading session.
Price Pattern: In Daily chart, Bank Nifty has formed Bearish Engulfing Pattern after the form of Long Green Candle indicating selling pressures and opens the way for further decline towards the strong support at 15060 levels.
Moving Average: In Hourly chart Bank Nifty has traded below its 50 & 100 EMA, which could sign of strong bearish move.
MACD: The MACD on the hourly charts continue to remain in negative divergence & favoring short term bears.
RSI: The divergence of short term RSI on hourly chart is suggesting a caution and to avoid fresh trading positions at the current levels.
Conclusion: The chart suggests that the Bank Nifty could trade in large range. The strong resistance is at 15460 levels as shown by green horizontal line & lower support of 15070 levels as shown by the red horizontal line. The charts suggest that wait & watch policy is good in this situation.
Resistance: R1 15617 R2 15936 R3 16457
Pivot : PL 15415
Support : S1 15096 S2 14894 S3 14373
Our Recommendation
Buy BNF above 15700 Stop Loss 15600 Target 16000.
Sell BNF below 15050 Stop Loss 15200 Target 14700.
3. 26th Sept’14 Equity Bazaar
Stock of the Day
Wipro View:
We have seen, Wipro has given upward trend line breakout and given close below its important support of 585 levels.
Price Pattern: According to daily chart Wipro has formed Bearish Engulfing Pattern which could sing as trend reversal.
Moving Average: In Hourly chart, Wipro has traded below its 50 &100 EMA, soon we could see 50 EMA crosses below 100 EMA which is suggesting weakness in prices. There is a possibility that Wipro could test 50 EMA or 100 EMA & start moving downward for the fresh falls.
MACD: The MACD on the hourly charts has given strong downward divergence which is negative for prices.
RSI: RSI is trading near 40 levels which suggest bearishness in the stock.
Conclusion: The charts suggest that this falls is going to continue till 560 levels. Wipro trades in shrinking direction therefore hike can be used as selling opportunities to test lower levels for the day.
Resistance : R1 594 R2 606 R3 628
Pivot : PL 585
Support : S1 573 S2 564 S3 543
Our Recommendation
Sell Wipro @590 Stop Loss 610 Target 560
4. 26th Sept’14 Equity Bazaar
Derivative Analysis FIIS Data: FII’s are the net seller on 25th September 2014 is Rs 851.24 Cr and Dll’s are the net buyres on 25th September 2014 is Rs 818.62 Cr. Option Data: 8200 CE has the highest OI with 36 lakhs and 8100 CE has the second highest OI with 32 lakhs and 7900 PE has the highest OI with 38 lakhs and 8000 PE has the second highest OI with 32 lakhs. Open Interest: The above options data shows nifty has now a strong support at 7900 and resistance at 8200 the trend change level as per option data is 8000. Intraday Option Strategy: (A) Buy Nifty 8000 calls and Sell Nifty 8100 puts if buy level is breached. (B) Sell Nifty 7900 calls and Buy Nifty 8000 puts if sell level is breached.
7. 26th Sept’14 Equity Bazaar
Disclaimer
This is solely for information of clients of Choice India and does not construe to be an investment advice. It is also not intended as an offer or solicitation for the purchase and sale of any financial instruments. Any action taken by you on the basis of the information contained herein is your responsibility alone and Choice India its subsidiaries or its employees or associates will not be liable in any manner for the consequences of such action taken by you. We have exercised due diligence in checking the correctness and authenticity of the information contained in this recommendation, but Choice India or any of its subsidiaries or associates or employees shall not be in any way responsible for any loss or damage that may arise to any person from any inadvertent error in the information contained in this recommendation or any action taken on basis of this information. Technical analysis studies market psychology, price patterns and volume levels. It is used to forecast future price and market movements. Technical analysis is complementary to fundamental analysis and news sources. The recommendations issued herewith might be contrary to recommendations issued by Choice India in the company research undertaken as the recommendations stated in this report is derived purely from technical analysis. Choice India has based this document on information obtained from sources it believes to be reliable but which it has not independently verified; Choice India makes no guarantee, representation or warranty and accepts no responsibility or liability as to its accuracy or completeness. The opinions contained within the report are based upon publicly available information at the time of publication and are subject to change without notice. The information and any disclosures provided herein are in summary form and have been prepared for informational purposes. The recommendations and suggested price levels are intended purely for trading purposes. The recommendations are valid for the day of the report however trading trends and volumes might vary substantially on an intraday basis and the recommendations may be subject to change. The information and any disclosures provided herein may be considered confidential. Any use, distribution, modification, copying, forwarding or disclosure by any person is strictly prohibited. The information and any disclosures provided herein do not constitute a solicitation or offer to purchase or sell any security or other financial product or instrument. The current performance may be unaudited. Past performance does not guarantee future returns. There can be no assurance that investments will achieve any targeted rates of return, and there is no guarantee against the loss of your entire investment.
POTENTIAL CONFLICT OF INTEREST DISCLOSURE (as on date of report) Disclosure of interest statement – • Analyst interest of the stock /Instrument(s): - No. • Firm interest of the stock / Instrument (s): - No.