1. 29th Sept’14 Equity Bazaar
Nifty
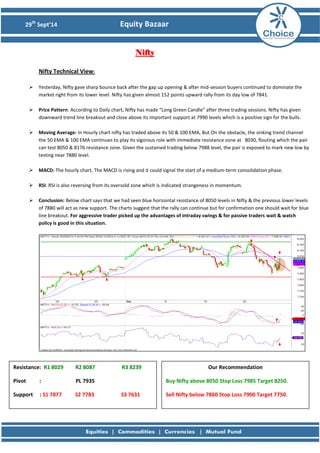
Nifty Technical View:
Yesterday, Nifty gave sharp bounce back after the gap up opening & after mid-session buyers continued to dominate the market right from its lower level. Nifty has given almost 152 points upward rally from its day low of 7841.
Price Pattern: According to Daily chart, Nifty has made “Long Green Candle” after three trading sessions. Nifty has given downward trend line breakout and close above its important support at 7990 levels which is a positive sign for the bulls.
Moving Average: In Hourly chart nifty has traded above its 50 & 100 EMA, But On the obstacle, the sinking trend channel the 50 EMA & 100 EMA continues to play its vigorous role with immediate resistance zone at 8030, flouting which the pair can test 8050 & 8176 resistance zone. Given the sustained trading below 7988 level, the pair is exposed to mark new low by testing near 7880 level.
MACD: The hourly chart, The MACD is rising and it could signal the start of a medium-term consolidation phase.
RSI: RSI is also reversing from its oversold zone which is indicated strangeness in momentum.
Conclusion: Below chart says that we had seen blue horizontal resistance of 8050 levels in Nifty & the previous lower levels of 7880 will act as new support. The charts suggest that the rally can continue but for confirmation one should wait for blue line breakout. For aggressive trader picked up the advantages of intraday swings & for passive traders wait & watch policy is good in this situation.
Resistance: R1 8029 R2 8087 R3 8239
Pivot : PL 7935
Support : S1 7877 S2 7783 S3 7631
Our Recommendation
Buy Nifty above 8050 Stop Loss 7985 Target 8250.
Sell Nifty below 7860 Stop Loss 7900 Target 7750.
2. 29th Sept’14 Equity Bazaar
Bank Nifty
Bank Nifty Technical View:
Bank Nifty remained within a narrow range throughout the first half but, posts the midsession; we witnessed tremendous volatility in the market. As a result, the index recovered from the intraday lows and closed near to its higher level. Bank Nifty has given almost 498 points upward rally from its day low of 15168.
Price Pattern: According to Daily chart, Nifty has made “Long Green Candle” which sights as the bulls were dominated precise. Bank Nifty it has also given downward trend line breakout and sustain above its important support 15333 level.
Moving Average: The Bank Nifty is trading around the 50 EMA & below 100 EMA ie 15591 and 15810 respectively, which are crucial levels in the immediate run.
MACD: The hourly MACD has yet to confirm the buying crossover.
RSI: RSI has formed positive reversal on hourly chart of Bank Nifty which would add bullishness to prices.
Conclusion: Bank Nifty could trade in large range. The strong resistance is at 16288 levels as shown by green horizontal line & lower support of 15070 levels as shown by the red horizontal line. The charts suggest that current trend is not yet clear so for aggressive trader picked up the advantages of intraday swings & for passive traders wait & watch policy is good in this situation.
Resistance: R1 15802 R2 15983 R3 16481
Pivot : PL 15485
Support : S1 15304 S2 14987 S3 14489
Our Recommendation
Buy BNF above 15900 Stop Loss 15800 Target: 16200.
Sell BNF below 15700 Stop Loss 15800 Target: 15200.
3. 29th Sept’14 Equity Bazaar
Stock of the Day
Ashok Leyland View:
We have seen, Ashok Leyland have tested the downtrend line as shown in the below chart & stock has consolidated before giving breakout along with making double bottom.
Price Pattern: According to hourly chart the pair still trades in a range which is quite visible from the charts that it is forming a symmetrical triangle pattern.
Moving Average: In Hourly chart, Ashok Leyland has traded above its 50 &100 EMA, soon we could see 50 EMA crosses above 100 EMA which is suggesting strength in prices. There is a possibility that Ashok Leyland could test 50 EMA or 100 EMA & start moving upward for the fresh rally.
ADX (24.18) is showing some up-tick from last few hours and now it could head towards 40 levels.
RSI: RSI is on bullish mode (58.19 levels) that suggests upside is still left.
Conclusion: The charts suggest that this rise is going to continue till 43 levels. Ashok Leylend trades in optimistic direction therefore plummet can be used as buying opportunities to test sophisticated levels for the day. For short term target will be Rs.41 shown by blue horizontal line & for intermediate term the target should be Rs.43 previous high shown by green horizontal line.
Resistance : R1 40.47 R2 41.18 R3 43.08
Pivot : PL39.28
Support : S1 38.57 S2 37.38 S3 35.48
Our Recommendation
Buy Ashok Leyland at 39.2 Stop Loss 38 Target: 43
4. 29th Sept’14 Equity Bazaar
Derivative Analysis FIIS Data: FII’s are the net seller on 26th September 2014 is Rs 1133.64 Cr and Dll’s are the net buyres on 26th September 2014 is Rs 1335.33 Cr. Option Data: 8200 CE has the highest OI with 46 lakhs and 8100 CE has the second highest OI with 36 lakhs and 7800 PE has the highest OI with 46 lakhs and 7900 PE has the second highest OI with 37 lakhs. Open Interest: The above options data shows nifty has now a strong support at 7900 and resistance at 8200 the trend change level as per option data is 8100. Intraday Option Strategy: (A) Buy Nifty 7900 calls and Sell Nifty 8200 puts if buy level is breached. (B) Sell Nifty 8200 calls and Buy Nifty 7900 puts if sell level is breached.
7. 29th Sept’14 Equity Bazaar
Disclaimer
This is solely for information of clients of Choice India and does not construe to be an investment advice. It is also not intended as an offer or solicitation for the purchase and sale of any financial instruments. Any action taken by you on the basis of the information contained herein is your responsibility alone and Choice India its subsidiaries or its employees or associates will not be liable in any manner for the consequences of such action taken by you. We have exercised due diligence in checking the correctness and authenticity of the information contained in this recommendation, but Choice India or any of its subsidiaries or associates or employees shall not be in any way responsible for any loss or damage that may arise to any person from any inadvertent error in the information contained in this recommendation or any action taken on basis of this information. Technical analysis studies market psychology, price patterns and volume levels. It is used to forecast future price and market movements. Technical analysis is complementary to fundamental analysis and news sources. The recommendations issued herewith might be contrary to recommendations issued by Choice India in the company research undertaken as the recommendations stated in this report is derived purely from technical analysis. Choice India has based this document on information obtained from sources it believes to be reliable but which it has not independently verified; Choice India makes no guarantee, representation or warranty and accepts no responsibility or liability as to its accuracy or completeness. The opinions contained within the report are based upon publicly available information at the time of publication and are subject to change without notice. The information and any disclosures provided herein are in summary form and have been prepared for informational purposes. The recommendations and suggested price levels are intended purely for trading purposes. The recommendations are valid for the day of the report however trading trends and volumes might vary substantially on an intraday basis and the recommendations may be subject to change. The information and any disclosures provided herein may be considered confidential. Any use, distribution, modification, copying, forwarding or disclosure by any person is strictly prohibited. The information and any disclosures provided herein do not constitute a solicitation or offer to purchase or sell any security or other financial product or instrument. The current performance may be unaudited. Past performance does not guarantee future returns. There can be no assurance that investments will achieve any targeted rates of return, and there is no guarantee against the loss of your entire investment.
POTENTIAL CONFLICT OF INTEREST DISCLOSURE (as on date of report) Disclosure of interest statement – • Analyst interest of the stock /Instrument(s): - No. • Firm interest of the stock / Instrument (s): - No.