1. 28th Oct’14 Equity Bazaar
Nifty
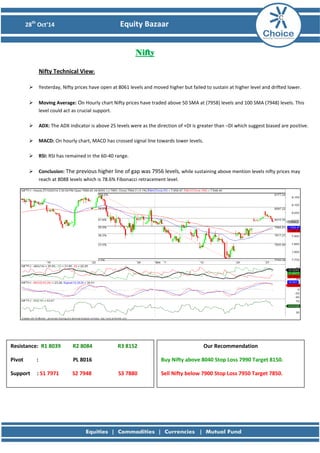
Nifty Technical View:
Yesterday, Nifty prices have open at 8061 levels and moved higher but failed to sustain at higher level and drifted lower.
Moving Average: On Hourly chart Nifty prices have traded above 50 SMA at (7958) levels and 100 SMA (7948) levels. This level could act as crucial support.
ADX: The ADX indicator is above 25 levels were as the direction of +DI is greater than –DI which suggest biased are positive.
MACD: On hourly chart, MACD has crossed signal line towards lower levels.
RSI: RSI has remained in the 60-40 range.
Conclusion: The previous higher line of gap was 7956 levels, while sustaining above mention levels nifty prices may reach at 8088 levels which is 78.6% Fibonacci retracement level.
Resistance: R1 8039 R2 8084 R3 8152
Pivot : PL 8016
Support : S1 7971 S2 7948 S3 7880
Our Recommendation
Buy Nifty above 8040 Stop Loss 7990 Target 8150.
Sell Nifty below 7900 Stop Loss 7950 Target 7850.
2. 28th Oct’14 Equity Bazaar
Bank Nifty
Bank Nifty Technical View:
Yesterday Bank Nifty was very volatile.
Candlesticks Pattern: On daily chart Bank Nifty prices have formed doji which means indecision in current trend.
Moving Average: On Hourly chart Bank Nifty have traded above 50 SMA (16296) & 100 SMA (16080) levels. These levels could be act as strong support for Bank Nifty.
ADX: ADX indicator is above the 25 were as +DI is greater than –DI which is positive sign for prices.
MACD: On hourly chart we have seen, MACD signal line have turned and given cross under signals which could be sign as accumulation.
RSI: RSI has managed to give close above 60 levels which would add bullishness in prices.
Conclusion: If Bank Nifty prices will sustain above its previous session high, prices can move towards 17000 levels.
Resistance: R1 16694 R2 16802 R3 17013
Pivot : PL 16590
Support : S1 16483 S2 16380 S3 16169
Our Recommendation
Buy BNF above 16600 Stop Loss 16500 Target: 16900.
Sell BNF below 16000 Stop Loss 16100 Target: 15700.
3. 28th Oct’14 Equity Bazaar
Stock of the Day
Asian Paint View:
Asian Paint prices are treading in consolidation formation after up move from 622 to 647 levels.
Pricing Pattern: On hourly chart we can see that Asian Paint prices are forming Ascending Triangle. Usually triangles are continuation pattern which would be confirmed after break the out in this case we would wait for the breakout on either direction. Upper range remains at 655 and lower range is at 645 levels.
Moving Average: On hourly chart prices are treading above 50 SMA (645) and 100 SMA (644) levels, this levels could act as immediate support.
RSI: RSI is below 50 levels, suggesting the trend may reverse to down but more confirmation will come from today’s price action.
Conclusion: In short term, if prices will sustain above 655 levels then rally could continue till 675 levels while break below 645 levels, lower drift could continue towards 625 levels.
Resistance: R1 655 R2 663 R3 674
Pivot : PL 651
Support : S1 644 S2 639 S3 628
Our Recommendation
Buy Asian Paint above 655 Stop Loss 645 Target: 675
Sell Asian Paint below 645 Stop Loss 655 Target: 625
4. 28th Oct’14 Equity Bazaar
Derivative Analysis FIIS Data: FII’s are net Rs 49.14 Cr Buyers on 27th October 2014 and Dll’s are the net Rs 9.55 Cr Buyers on 27th October 2014. Option Data: 8100 CE has the highest OI with 74 lakhs and 8200 CE has the second highest OI with 56 lakhs and 7900 PE has the highest OI with 60 lakhs and 8000 PE has the second highest OI with 51 lakhs. Open Interest: The above options data shows that nifty has strong support at 7900 and has resistance at 8100. The change in level will take place once when NIFTY prices breaks 8000 mark. Intraday Option Strategy: (A) Buy Nifty 8000 calls and Sell Nifty 8100 puts if buy level is breached. (B) Sell Nifty 7900 calls and Buy Nifty 8000 puts if sell level is breached.
5. 28th Oct’14 Equity Bazaar
Symbol S3 S2 S1 P R1 R2 R3 Trend Action
ACC 1413.65 1440.7 1450.4 1467.75 1477.45 1494.8 1521.85 Down Sell
AMBUJACEM 209.88 214.98 218.17 220.0833 223.27 225.18 230.28 UP Buy
ASIANPAINT 628.38 639.98 644.37 651.5833 655.97 663.18 674.78 Down Sell
AXISBANK 408.17 416.77 421.78 425.3667 430.38 433.97 442.57 UP Buy
BAJAJ-AUTO 2435.8 2478.65 2498.05 2521.5 2540.9 2564.35 2607.2 Down Sell
BANKBARODA 841.95 871.55 888.6 901.15 918.2 930.75 960.35 UP Buy
BHEL 223.97 236.62 244.63 249.2667 257.28 261.92 274.57 UP Buy
BPCL 652.1 669.45 677.8 686.8 695.15 704.15 721.5 Down Sell
BHARTIARTL 402.55 408.35 411.45 414.15 417.25 419.95 425.75 UP Buy
CAIRN 253.58 267.38 272.37 281.1833 286.17 294.98 308.78 Down Sell
CIPLA 604.43 615.43 621.77 626.4333 632.77 637.43 648.43 UP Buy
COALINDIA 331.53 343.03 349.77 354.5333 361.27 366.03 377.53 UP Buy
DLF 97.83 104.83 107.67 111.8333 114.67 118.83 125.83 Down Sell
DRREDDY 2893.47 3008.57 3057.18 3123.667 3172.28 3238.77 3353.87 Down Sell
GAIL 458.22 472.72 479.63 487.2167 494.13 501.72 516.22 Sideway No Action
GRASIM 3301.47 3352.22 3373.93 3402.967 3424.68 3453.72 3504.47 Down Sell
HCLTECH 1405.25 1456.25 1476.5 1507.25 1527.5 1558.25 1609.25 Down Sell
HDFCBANK 873.27 886.42 891.83 899.5667 904.98 912.72 925.87 Down Sell
HEROMOTOCO 2959.77 3025.72 3054.33 3091.667 3120.28 3157.62 3223.57 Down Sell
HINDALCO 138.57 143.52 145.43 148.4667 150.38 153.42 158.37 Down Sell
HINDUNILVR 632.9 683.45 701.95 734 752.5 784.55 835.1 Down Sell
HDFC 977.65 1011.45 1024.1 1045.25 1057.9 1079.05 1112.85 Down Sell
ITC 342.85 346.25 347.9 349.65 351.3 353.05 356.45 Down Sell
ICICIBANK 1535.65 1555.95 1564.5 1576.25 1584.8 1596.55 1616.85 Down Sell
IDFC 137.72 141.47 142.83 145.2167 146.58 148.97 152.72 Down Sell
INDUSINDBK 665.87 682.47 689.63 699.0667 706.23 715.67 732.27 Down Sell
INFY 3676.15 3743.95 3773.5 3811.75 3841.3 3879.55 3947.35 Down Sell
JINDALSTEL 137.87 146.32 149.43 154.7667 157.88 163.22 171.67 Down Sell
KOTAKBANK 1027.17 1053.87 1069.43 1080.567 1096.13 1107.27 1133.97 UP Buy
LT 1529.8 1549.75 1558.55 1569.7 1578.5 1589.65 1609.6 Down Sell
LUPIN 1354.65 1372.55 1382.9 1390.45 1400.8 1408.35 1426.25 UP Buy
M&M 1190.3 1223.4 1240.1 1256.5 1273.2 1289.6 1322.7 Sideway No Action
MARUTI 2986.07 3070.57 3120.13 3155.067 3204.63 3239.57 3324.07 UP Buy
NMDC 155.7 159.2 161.4 162.7 164.9 166.2 169.7 UP Buy
NTPC 139.68 143.08 144.47 146.4833 147.87 149.88 153.28 Down Sell
ONGC 373.28 385.68 390.17 398.0833 402.57 410.48 422.88 Down Sell
POWERGRID 132.03 137.28 139.67 142.5333 144.92 147.78 153.03 Down Sell
PNB 893.62 914.12 923.33 934.6167 943.83 955.12 975.62 Down Sell
RELIANCE 893.07 920.22 930.78 947.3667 957.93 974.52 1001.67 Down Sell
SSLT 236 243.05 246.05 250.1 253.1 257.15 264.2 Down Sell
SBIN 2521.77 2560.67 2579.23 2599.567 2618.13 2638.47 2677.37 Sideway No Action
SUNPHARMA 757.82 780.17 792.68 802.5167 815.03 824.87 847.22 UP Buy
TCS 2324.43 2399.18 2428.17 2473.933 2502.92 2548.68 2623.43 Down Sell
TATAMOTORS 476.48 492.23 497.97 507.9833 513.72 523.73 539.48 Down Sell
TATAPOWER 84.43 86.38 87.42 88.33333 89.37 90.28 92.23 UP Buy
TATASTEEL 428.28 441.03 445.77 453.7833 458.52 466.53 479.28 Down Sell
TECHM 2239.62 2289.27 2307.83 2338.917 2357.48 2388.57 2438.22 Down Sell
ULTRACEMCO 2330.87 2380.57 2405.58 2430.267 2455.28 2479.97 2529.67 Sideway No Action
WIPRO 530.78 542.13 548.47 553.4833 559.82 564.83 576.18 UP Buy
ZEEL 295.35 313.25 321.8 331.15 339.7 349.05 366.95 Down Sell
7. 28th Oct’14 Equity Bazaar Disclaimer
This is solely for information of clients of Choice India and does not construe to be an investment advice. It is also not intended as an offer or solicitation for the purchase and sale of any financial instruments. Any action taken by you on the basis of the information contained herein is your responsibility alone and Choice India its subsidiaries or its employees or associates will not be liable in any manner for the consequences of such action taken by you. We have exercised due diligence in checking the correctness and authenticity of the information contained in this recommendation, but Choice India or any of its subsidiaries or associates or employees shall not be in any way responsible for any loss or damage that may arise to any person from any inadvertent error in the information contained in this recommendation or any action taken on basis of this information. Technical analysis studies market psychology, price patterns and volume levels. It is used to forecast future price and market movements. Technical analysis is complementary to fundamental analysis and news sources. The recommendations issued herewith might be contrary to recommendations issued by Choice India in the company research undertaken as the recommendations stated in this report is derived purely from technical analysis. Choice India has based this document on information obtained from sources it believes to be reliable but which it has not independently verified; Choice India makes no guarantee, representation or warranty and accepts no responsibility or liability as to its accuracy or completeness. The opinions contained within the report are based upon publicly available information at the time of publication and are subject to change without notice. The information and any disclosures provided herein are in summary form and have been prepared for informational purposes. The recommendations and suggested price levels are intended purely for trading purposes. The recommendations are valid for the day of the report however trading trends and volumes might vary substantially on an intraday basis and the recommendations may be subject to change. The information and any disclosures provided herein may be considered confidential. Any use, distribution, modification, copying, forwarding or disclosure by any person is strictly prohibited. The information and any disclosures provided herein do not constitute a solicitation or offer to purchase or sell any security or other financial product or instrument. The current performance may be unaudited. Past performance does not guarantee future returns. There can be no assurance that investments will achieve any targeted rates of return, and there is no guarantee against the loss of your entire investment.
POTENTIAL CONFLICT OF INTEREST DISCLOSURE (as on date of report) Disclosure of interest statement – • Analyst interest of the stock /Instrument(s): - No. • Firm interest of the stock / Instrument (s): - No.