1. 28th Nov’14 Equity Bazaar
NIFTY
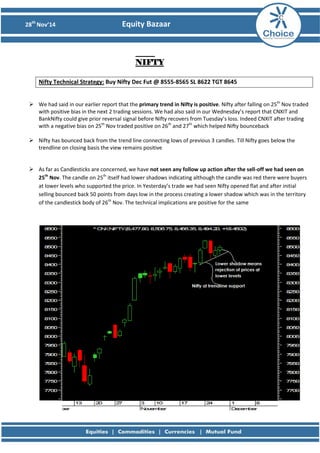
Nifty Technical Strategy: Buy Nifty Dec Fut @ 8555-8565 SL 8622 TGT 8645
We had said in our earlier report that the primary trend in Nifty is positive. Nifty after falling on 25th Nov traded with positive bias in the next 2 trading sessions. We had also said in our Wednesday’s report that CNXIT and BankNifty could give prior reversal signal before Nifty recovers from Tuesday’s loss. Indeed CNXIT after trading with a negative bias on 25th Nov traded positive on 26th and 27th which helped Nifty bounceback
Nifty has bounced back from the trend line connecting lows of previous 3 candles. Till Nifty goes below the trendline on closing basis the view remains positive
As far as Candlesticks are concerned, we have not seen any follow up action after the sell-off we had seen on 25th Nov. The candle on 25th itself had lower shadows indicating although the candle was red there were buyers at lower levels who supported the price. In Yesterday’s trade we had seen Nifty opened flat and after initial selling bounced back 50 points from days low in the process creating a lower shadow which was in the territory of the candlestick body of 26th Nov. The technical implications are positive for the same
2. 28th Nov’14 Equity Bazaar
Bank Nifty
Bank Nifty Technical Strategy:Buy BankNifty Dec Fut @ 18070-18090 SL 17940 TGT 18300
BankNifty after trading with negative bias in first half rallied in second half to close at days high. It bounced back more than 100 points from day’s low. Within BankNifty the heavy weight ICICI was up more than a 1%
We had said in our yesterday’s Technical report, that holding 17880 would be positive. BankNifty bounced back from close to these levels. BankNifty had made an “Inverted Hammer” on Wednesdays chart. In Yesterday’s trade we had seen a Candle with lower shadows. The implications are positive on account of this technical setup
Yesterdays low and day before yesterday’s low were also similar at 17890 levels. The implications are positive
3. 28th Nov’14 Equity Bazaar
Stock of the Day
ABNL Technical Strategy:Buy ABNL Dec Fut @ 1760-1762 SL 1748 TGT 1782
ABNL had made a “Piercing line Candle” Pattern in yesterday’s trade.
We have seen Volume based buying in yesterdays trade.
Stock is trading close to its’s previous resistance which is now support and it is positive as per “Theory of Polarity”.
We believe the stock has the potential to move to above 1800 levels positionally
4. 28th Nov’14 Equity Bazaar
Future & Option Analysis
FNO Highlights
The highest Put base is at the 8000 strike with 31 lakh shares while the highest Call base is at the 8500 strike with 51 lakh shares.
FIIs bought Rs. 390 crore while DIIs bought Rs.337 crore in the cash segment.
FII bought Rs2187crore in index futures and sold Rs706crore in Stock futures.
India VIX fell 1.86% and settled at 12.74. Nifty future started with 53 points premium for the December series
7. 28th Nov’14 Equity Bazaar
Disclaimer
This is solely for information of clients of Choice Broking and does not construe to be an investment advice. It is also not intended as an offer or solicitation for the purchase and sale of any financial instruments. Any action taken by you on the basis of the information contained herein is your responsibility alone and Choice Broking its subsidiaries or its employees or associates will not be liable in any manner for the consequences of such action taken by you. We have exercised due diligence in checking the correctness and authenticity of the information contained in this recommendation, but Choice Broking or any of its subsidiaries or associates or employees shall not be in any way responsible for any loss or damage that may arise to any person from any inadvertent error in the information contained in this recommendation or any action taken on basis of this information. Technical analysis studies market psychology, price patterns and volume levels. It is used to forecast future price and market movements. Technical analysis is complementary to fundamental analysis and news sources. The recommendations issued herewith might be contrary to recommendations issued by Choice Broking in the company research undertaken as the recommendations stated in this report is derived purely from technical analysis. Choice Broking has based this document on information obtained from sources it believes to be reliable but which it has not independently verified; Choice Broking makes no guarantee, representation or warranty and accepts no responsibility or liability as to its accuracy or completeness. The opinions contained within the report are based upon publicly available information at the time of publication and are subject to change without notice. The information and any disclosures provided herein are in summary form and have been prepared for informational purposes. The recommendations and suggested price levels are intended purely for trading purposes. The recommendations are valid for the day of the report however trading trends and volumes might vary substantially on an intraday basis and the recommendations may be subject to change. The information and any disclosures provided herein may be considered confidential. Any use, distribution, modification, copying, forwarding or disclosure by any person is strictly prohibited. The information and any disclosures provided herein do not constitute a solicitation or offer to purchase or sell any security or other financial product or instrument. The current performance may be unaudited. Past performance does not guarantee future returns. There can be no assurance that investments will achieve any targeted rates of return, and there is no guarantee against the loss of your entire investment. POTENTIAL CONFLICT OF INTEREST DISCLOSURE (as on date of report) Disclosure of interest statement – • Analyst interest of the stock /Instrument(s): - No. • Firm interest of the stock / Instrument (s): - No.