1. 20th Oct’ 14 Currency Highlights
USDINR
USDINR Technical View:
After intermediate uptrend USDINR is on the verge to reverse its trend and today’s price action will be very important one.
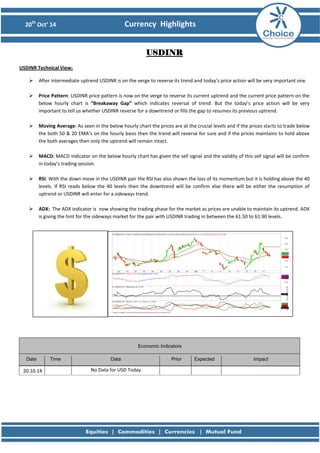
Price Pattern: USDINR price pattern is now on the verge to reverse its current uptrend and the current price pattern on the below hourly chart is “Breakaway Gap” which indicates reversal of trend. But the today’s price action will be very important to tell us whether USDINR reverse for a downtrend or fills the gap to resumes its previous uptrend.
Moving Average: As seen in the below hourly chart the prices are at the crucial levels and if the prices starts to trade below the both 50 & 20 EMA’s on the hourly basis then the trend will reverse for sure and if the prices maintains to hold above the both averages then only the uptrend will remain intact.
MACD: MACD indicator on the below hourly chart has given the sell signal and the validity of this sell signal will be confirm in today’s trading session.
RSI: With the down move in the USDINR pair the RSI has also shown the loss of its momentum but it is holding above the 40 levels. If RSI reads below the 40 levels then the downtrend will be confirm else there will be either the resumption of uptrend or USDINR will enter for a sideways trend.
ADX: The ADX indicator is now showing the trading phase for the market as prices are unable to maintain its uptrend. ADX is giving the hint for the sideways market for the pair with USDINR trading in between the 61.50 to 61.90 levels.
Economic Indicators Date Time Data Prior Expected Impact
20.10.14
No Data for USD Today
2. 20th Oct’ 14 Currency Highlights
EURINR
EURINR Technical View:
EURINR pair is showing the strength in its trend but today’s price action will confirm the validity for the uptrend.
Price Pattern: EURINR uptrend is also showing the early weakness but the prices are trading above the “Breakaway Gap” levels. As the pair in the friday’s trading session trade in a sideways fashion due to weakness in USDINR pair. The important level to watch is 78.70 levels whether the pair starts to trade below it or maintain to hold this support.
Moving Average: The EURINR pair however has maintains to hold above the both 50 & 20 EMA’s on the hourly basis which is only the technical reason for the pair to remain bullish. Today’s price action will tell us whether the pair starts to trade below the averages or maintains to trade and close above it.
MACD: The indicator has given a sell signal with prices trade for a sideways trend in the friday’s trading session. Again the validity of this sell signal will be tested in today’s trading session or it will reverse to a buy signal confirming the uptrend in EURINR pair.
RSI: After the short term uptrend the RSI has shown the loss of momentum but still reading values above the 50 levels. The last support for the EURINR uptrend will be RSI staying above the 40 levels.
ADX: ADX indicator is now reading its values above the 20 levels and near to 25 levels suggesting for the trending market for the pair. ADX indicator next clues can be drawn from the today’s price action.
Economic Indicators Date Time Data Prior Expected Impact
20.10.14
11:30 AM German PPI m/m
-0.1%
0.1%
Actual > Expected=Good for EUR
20.10.14
01:30 PM Current Account
18.7B
21.3B
Actual > Expected=Good for EUR
20.10.14
03:30 PM German Buba Monthly Report
More Hawkish=Good for EUR
3. 20th Oct’ 14 Currency Highlights
GBPINR
GBPINR Technical View:
Now GBPINR is also on the verge to reverse its intermediate trend to up or resume its previous downtrend.
Price Pattern: The price pattern for the GBPINR is showing the prices are trading at the important levels with reversal to either side. Today’s price action will confirm whether GBPINR reverse for uptrend or resumes its previous downtrend as prices in the friday’s trading session traded for a sideways market.
Moving Average: From the below hourly chart prices are trading very near to the 50 & 20 EMA’s suggesting the GBPINR is at the crucial levels. If the prices maintains to stay above both averages in the today’s trading session then the uptrend will confirm else the previous downtrend to remain valid.
MACD: The MACD indicator is also on the verge to reverse is buy signal and which will be the first technical indicator to hint towards the trend reversal for a downside.
RSI: Momentum indicator RSI is however still showing the strength for the pair. The only conclusion that can be drawn from the RSI indicator is that it reads above the 40 levels which is last support for the short term uptrend.
ADX: ADX is showing the trendless nature for the pair as its values as reading well below the 25 levels. Now only a definitive movement either side will make ADX to read higher values and to show the trending phase for the pair.
Economic Indicators Date Time Data Prior Expected Impact
20.10.14
04:31 AM Rightmove HPI m/m
0.9%
Actual > Expected=Good for GBP
4. 20th Oct’ 14 Currency Highlights
JPYINR
JPYINR Technical View:
The sideways trend in the above the currency pairs has also made JPYINR to change to its strong uptrend.
Price Pattern: The JPYINR price pattern is also on acting in-line with the above three pair’s price pattern with prices trading at the crucial levels. With the previous intraday downtrend has made the pair to come at the crucial level so the today’s price action will confirm whether JPYINR holds its previous uptrend or reverse for the downtrend.
Moving Average: Now since the prices are closed above the both 50 & 20 EMA’s on the below hourly chart has made pair to hold intermediate uptrend. Once if the prices trades below the 50 EMA’s on hourly basis then the downtrend for the pair will be confirm.
MACD: The MACD indicator has given the early sell signal hinting towards the reversal but the today’s prices action will confirm whether the sell signal remains valid or reverse for the uptrend.
RSI: RSI has shown the loss of momentum with values reversing from the over-brought levels. Now the last indication that can be drawn from the RSI is staying above the 40 levels which is the last support for the intermediate uptrend.
ADX: ADX indicator has started reading lower values but has maintains to stay above the 25 levels. If the ADX continues to falls then this will hint towards the trading phase for the pair.
Economic Indicators Date Time Data Prior Expected Impact
20.10.14
No Data for JPY Today
6. 20th Oct’ 14 Currency Highlights
Disclaimer
This is solely for information of clients of Choice India and does not construe to be an investment advice. It is also not intended as an offer or solicitation for the purchase and sale of any financial instruments. Any action taken by you on the basis of the information contained herein is your responsibility alone and Choice India its subsidiaries or its employees or associates will not be liable in any manner for the consequences of such action taken by you. We have exercised due diligence in checking the correctness and authenticity of the information contained in this recommendation, but Choice India or any of its subsidiaries or associates or employees shall not be in any way responsible for any loss or damage that may arise to any person from any inadvertent error in the information contained in this recommendation or any action taken on basis of this information. Technical analysis studies market psychology, price patterns and volume levels. It is used to forecast future price and market movements. Technical analysis is complementary to fundamental analysis and news sources. The recommendations issued herewith might be contrary to recommendations issued by Choice India in the company research undertaken as the recommendations stated in this report is derived purely from technical analysis. Choice India has based this document on information obtained from sources it believes to be reliable but which it has not independently verified; Choice India makes no guarantee, representation or warranty and accepts no responsibility or liability as to its accuracy or completeness. The opinions contained within the report are based upon publicly available information at the time of publication and are subject to change without notice. The information and any disclosures provided herein are in summary form and have been prepared for informational purposes. The recommendations and suggested price levels are intended purely for trading purposes. The recommendations are valid for the day of the report however trading trends and volumes might vary substantially on an intraday basis and the recommendations may be subject to change. The information and any disclosures provided herein may be considered confidential. Any use, distribution, modification, copying, forwarding or disclosure by any person is strictly prohibited. The information and any disclosures provided herein do not constitute a solicitation or offer to purchase or sell any security or other financial product or instrument. The current performance may be unaudited. Past performance does not guarantee future returns. There can be no assurance that investments will achieve any targeted rates of return, and there is no guarantee against the loss of your entire investment.
POTENTIAL CONFLICT OF INTEREST DISCLOSURE (as on date of report) Disclosure of interest statement – • Analyst interest of the stock /Instrument(s): - No. • Firm interest of the stock / Instrument (s): - No.