1. 26th Sept’ 14 Currency Highlights
USDINR
USDINR Technical View:
USDINR acted exactly as mentioned in the yesterday’s Currency Highlight report.
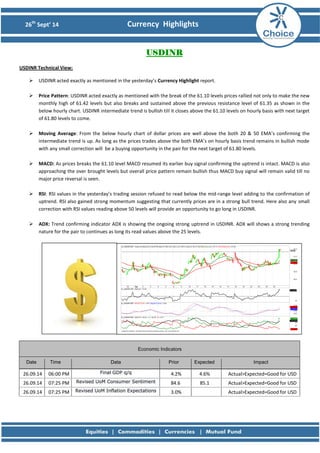
Price Pattern: USDINR acted exactly as mentioned with the break of the 61.10 levels prices rallied not only to make the new monthly high of 61.42 levels but also breaks and sustained above the previous resistance level of 61.35 as shown in the below hourly chart. USDINR intermediate trend is bullish till it closes above the 61.10 levels on hourly basis with next target of 61.80 levels to come.
Moving Average: From the below hourly chart of dollar prices are well above the both 20 & 50 EMA’s confirming the intermediate trend is up. As long as the prices trades above the both EMA’s on hourly basis trend remains in bullish mode with any small correction will be a buying opportunity in the pair for the next target of 61.80 levels.
MACD: As prices breaks the 61.10 level MACD resumed its earlier buy signal confirming the uptrend is intact. MACD is also approaching the over brought levels but overall price pattern remain bullish thus MACD buy signal will remain valid till no major price reversal is seen.
RSI: RSI values in the yesterday’s trading session refused to read below the mid-range level adding to the confirmation of uptrend. RSI also gained strong momentum suggesting that currently prices are in a strong bull trend. Here also any small correction with RSI values reading above 50 levels will provide an opportunity to go long in USDINR.
ADX: Trend confirming indicator ADX is showing the ongoing strong uptrend in USDINR. ADX will shows a strong trending nature for the pair to continues as long its read values above the 25 levels.
Economic Indicators Date Time Data Prior Expected Impact
26.09.14
06:00 PM Final GDP q/q
4.2%
4.6%
Actual>Expected=Good for USD
26.09.14
07:25 PM Revised UoM Consumer Sentiment
84.6
85.1
Actual>Expected=Good for USD
26.09.14
07:25 PM Revised UoM Inflation Expectations
3.0%
Actual>Expected=Good for USD
2. 26th Sept’ 14 Currency Highlights
EURINR
EURINR Technical View:
EURINR downtrend is still intact however prices yesterday get some support to reverse upwards from the rally in USDINR prices.
Price Pattern: Price pattern in EURINR is still in bearish mode with prices rallied in yesterday’s trading session due to the up move in dollar prices. But still the overall chart structure for EURINR looks weak till no major price reversal is formed.
Moving Average: EURINR prices are still in major downtrend as seen in the below hourly chart. Prices are well below the both trend decider EMA’s 20 & 50 suggesting the downtrend in EURINR continues till prices do not close successfully above the both EMA’s.
MACD: MACD indicator sell signal is about to reverse but it needs a strong confirmation form prices. Once if prices start trading & closing above yesterday’s high of 78.23 MACD will turn to buy signal. If prices today fail to sustain above the yesterday’s high MACD sell signal will be resume.
RSI: RSI has bottom out from oversold region but failed to cross mid-range level 50 adding to our view of bearishness continues in EURINR. Here RSI is also hinting to an important signal that if today USDINR sees weakness in intraday perspective EURINR will be the weakest currency.
ADX: ADX is now showing the trending nature for the pair. But here ADX is also hinting to a trending move will come in prices of EURINR with respect to either breaking and closing above the yesterday’s high of 78.23 or the low of 77.64 levels.
Economic Indicators Date Time Data Prior Expected Impact
26.09.14
11:30 PM German Consumer Climate
8.6
8.5
Actual>Expected=Good for EUR
26.09.14
11:30 PM German Import Prices m/m
-0.4%
-0.2%
Actual>Expected=Good for EUR
3. 26th Sept’ 14 Currency Highlights
GBPINR
GBPINR Technical View:
GBPINR has formed a major sideways price pattern called “Rectangle” with either side breakout from the pattern will bring the strong trending movement in pound prices.
Moving Average: Prices of GBPINR continues to moves in very volatile fashion in yesterday’s trading session. As seen in the below hourly chart pound prices are trading both above and below 20 & 50 EMA’s giving sideways trend in GBINR.
Now only a breakout of either above 100.25 or below 99.50 will bring a trending movement in GBPINR.
MACD: MACD indicator is currently not giving any hint as prices remains sideways. As mentioned earlier with breakout of price pattern will only bring MACD to give a clear signal adding confirmation of trend.
RSI: The momentum indicator RSI has shown the gain of strength with prices rallying in yesterday’s trading session from low of 99.40. Here it will be very watchful to see if today RSI maintains to stay above the mid-range level 50 suggesting the upward breakout else sideways trend will be continue till prices do not close below 99.50 levels.
ADX: Trend indicator ADX is clearly showing the sideways range in pound chart. It is now very important to watch ADX values once starts reading above the 25 levels will bring a strong trending movement in GBPINR either side.
Economic Indicators Date Time Data Prior Expected Impact
26.09.14
No Data For GBP Today
4. 26th Sept’ 14 Currency Highlights
JPYINR
JPYINR Technical View:
JPYINR prices are still showing the continuation of downtrend. However it got some support for up move with rally in USDINR prices.
Moving Average: JPYINR prices rallied in the yesterday’s trading session but failed to close above the both 20 & 50 EMA’s. This shows how the both EMA’ are acting as the major trend decider for yen prices. Once prices starts trading & closed above the both EMA’S then it will bring major trend reversal for yen prices.
MACD: MACD indicator yesterday’s buy signal continues as prices rallied to intraday high of 56.26 levels. If prices today starts to trade above yesterday’s high then MACD buy signal will continue else any failure of prices to reverse will give MACD to generate a new sell signal.
RSI: RSI indicator has got the strength but its needs confirmation from prices. If today prices remains to stay above the yesterday’s high of 56.26 levels then RSI will maintain its mid-range level else it will starts to read below the mid-levels for the continuation of downtrend.
ADX: ADX indicator is still showing the trendless nature for the pair. But as per the ADX characteristics as its reading at lower values ADX will turn up to read higher values giving confirmation for the start of trending movement in JPYINR prices.
Economic Indicators Date Time Data Prior Expected Impact
26.09.14
05:00 AM Tokyo Core CPI y/y
2.7%
2.7%
Actual>Expected=Good for JPY
26.09.14
05:00 AM National Core CPI y/y
3.3%
3.2%
Actual>Expected=Good for JPY
6. 26th Sept’ 14 Currency Highlights
Disclaimer
This is solely for information of clients of Choice India and does not construe to be an investment advice. It is also not intended as an offer or solicitation for the purchase and sale of any financial instruments. Any action taken by you on the basis of the information contained herein is your responsibility alone and Choice India its subsidiaries or its employees or associates will not be liable in any manner for the consequences of such action taken by you. We have exercised due diligence in checking the correctness and authenticity of the information contained in this recommendation, but Choice India or any of its subsidiaries or associates or employees shall not be in any way responsible for any loss or damage that may arise to any person from any inadvertent error in the information contained in this recommendation or any action taken on basis of this information. Technical analysis studies market psychology, price patterns and volume levels. It is used to forecast future price and market movements. Technical analysis is complementary to fundamental analysis and news sources. The recommendations issued herewith might be contrary to recommendations issued by Choice India in the company research undertaken as the recommendations stated in this report is derived purely from technical analysis. Choice India has based this document on information obtained from sources it believes to be reliable but which it has not independently verified; Choice India makes no guarantee, representation or warranty and accepts no responsibility or liability as to its accuracy or completeness. The opinions contained within the report are based upon publicly available information at the time of publication and are subject to change without notice. The information and any disclosures provided herein are in summary form and have been prepared for informational purposes. The recommendations and suggested price levels are intended purely for trading purposes. The recommendations are valid for the day of the report however trading trends and volumes might vary substantially on an intraday basis and the recommendations may be subject to change. The information and any disclosures provided herein may be considered confidential. Any use, distribution, modification, copying, forwarding or disclosure by any person is strictly prohibited. The information and any disclosures provided herein do not constitute a solicitation or offer to purchase or sell any security or other financial product or instrument. The current performance may be unaudited. Past performance does not guarantee future returns. There can be no assurance that investments will achieve any targeted rates of return, and there is no guarantee against the loss of your entire investment.
POTENTIAL CONFLICT OF INTEREST DISCLOSURE (as on date of report) Disclosure of interest statement – • Analyst interest of the stock /Instrument(s): - No. • Firm interest of the stock / Instrument (s): - No.