1. 10th Nov’14 Equity Bazaar
Nifty
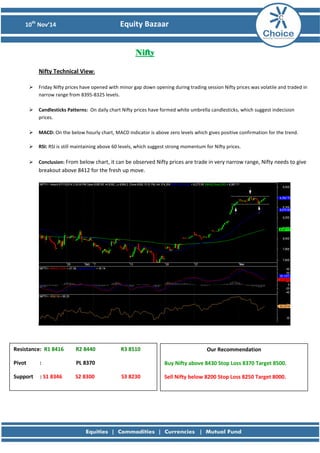
Nifty Technical View:
Friday Nifty prices have opened with minor gap down opening during trading session Nifty prices was volatile and traded in narrow range from 8395-8325 levels.
Candlesticks Patterns: On daily chart Nifty prices have formed white umbrella candlesticks, which suggest indecision prices.
MACD: On the below hourly chart, MACD indicator is above zero levels which gives positive confirmation for the trend.
RSI: RSI is still maintaining above 60 levels, which suggest strong momentum for Nifty prices.
Conclusion: From below chart, it can be observed Nifty prices are trade in very narrow range, Nifty needs to give breakout above 8412 for the fresh up move.
Resistance: R1 8416 R2 8440 R3 8510
Pivot : PL 8370
Support : S1 8346 S2 8300 S3 8230
Our Recommendation
Buy Nifty above 8430 Stop Loss 8370 Target 8500.
Sell Nifty below 8200 Stop Loss 8250 Target 8000.
2. 10th Nov’14 Equity Bazaar
Bank Nifty
Bank Nifty Technical View:
Bank Nifty prices have open at lower levels but not able to sustain the levels and moved towards higher levels.
MACD: MACD indicator buy signal will be valid only if prices trade above previous high.
RSI: Momentum indicator RSI has sustained above 60 levels with positive reversal which means strong in momentum for Bank Nifty prices.
Conclusion: Bank Nifty prices are moving in uptrend therefore trade above 17550 levels could suggest more upside.
Resistance: R1 17687 R2 17887 R3 17884
Pivot : PL 17490
Support : S1 17490 S2 17293 S3 17096
Our Recommendation
Buy BNF above 17550 Stop Loss 17500 Target: 17800.
Sell BNF below 17400 Stop Loss 17500 Target: 17000.
3. 10th Nov’14 Equity Bazaar
Stock of the Day
NTPC View:
NTPC Prices have given hourly closed below the horizontal line shown on the below chart.
Moving Average: We have seen NTPC prices are trading below 50 EMA (146.5) levels, mention level could act as immediate resistance.
MACD: On the below hourly chart, MACD sell signals continues has the prices will able to make new low in today’s trading session.
RSI: RSI has drifted down below 40 levels, which suggest the negative momentum to continue for the stock.
Conclusion: If NTPC will trade below 143.7 levels then prices would fall till 141 levels.
Resistance: R1 146 R2 147 R3 150
Pivot : PL 145
Support : S1 143 S2 142 S3 139
Our Recommendation
Sell NTPC below 143.5 Stop Loss 146 Target: 141
4. 10th Nov’14 Equity Bazaar
Derivative Analysis FIIS Data: FII’s are net Rs 2537.13 Cr Buyers on 7th November 2014 and Dll’s are the net Rs 192.2 Cr Sellers on 7th November 2014. Option Data: 8400 CE has the highest OI with 46 lakhs and 8500 CE has the second highest OI with 45 lakhs and 8000 PE has the highest OI with 58 lakhs and 8200 PE has the second highest OI with 47 lakhs. Open Interest: The above options data shows that nifty has strong support at 8000 and has resistance at 8500. The change in level will take place once when NIFTY prices breaks 8200 mark. Intraday Option Strategy: (A) Buy Nifty 8400 calls and Sell Nifty 8500 puts if buy level is breached. (B) Sell Nifty 8300 calls and Buy Nifty 8400 puts if sell level is breached.
7. 10th Nov’14 Equity Bazaar
Disclaimer
This is solely for information of clients of Choice Broking and does not construe to be an investment advice. It is also not intended as an offer or solicitation for the purchase and sale of any financial instruments. Any action taken by you on the basis of the information contained herein is your responsibility alone and Choice Broking its subsidiaries or its employees or associates will not be liable in any manner for the consequences of such action taken by you. We have exercised due diligence in checking the correctness and authenticity of the information contained in this recommendation, but Choice Broking or any of its subsidiaries or associates or employees shall not be in any way responsible for any loss or damage that may arise to any person from any inadvertent error in the information contained in this recommendation or any action taken on basis of this information. Technical analysis studies market psychology, price patterns and volume levels. It is used to forecast future price and market movements. Technical analysis is complementary to fundamental analysis and news sources. The recommendations issued herewith might be contrary to recommendations issued by Choice Broking in the company research undertaken as the recommendations stated in this report is derived purely from technical analysis. Choice Broking has based this document on information obtained from sources it believes to be reliable but which it has not independently verified; Choice Broking makes no guarantee, representation or warranty and accepts no responsibility or liability as to its accuracy or completeness. The opinions contained within the report are based upon publicly available information at the time of publication and are subject to change without notice. The information and any disclosures provided herein are in summary form and have been prepared for informational purposes. The recommendations and suggested price levels are intended purely for trading purposes. The recommendations are valid for the day of the report however trading trends and volumes might vary substantially on an intraday basis and the recommendations may be subject to change. The information and any disclosures provided herein may be considered confidential. Any use, distribution, modification, copying, forwarding or disclosure by any person is strictly prohibited. The information and any disclosures provided herein do not constitute a solicitation or offer to purchase or sell any security or other financial product or instrument. The current performance may be unaudited. Past performance does not guarantee future returns. There can be no assurance that investments will achieve any targeted rates of return, and there is no guarantee against the loss of your entire investment. POTENTIAL CONFLICT OF INTEREST DISCLOSURE (as on date of report) Disclosure of interest statement – • Analyst interest of the stock /Instrument(s): - No. • Firm interest of the stock / Instrument (s): - No.