1. 12th Nov’14 Equity Bazaar
Nifty
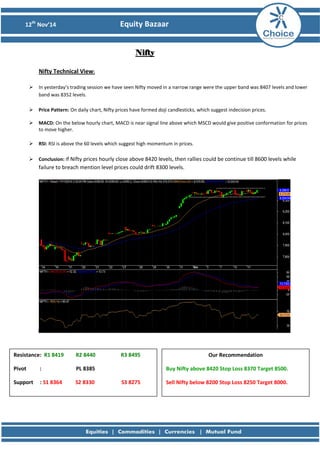
Nifty Technical View:
In yesterday’s trading session we have seen Nifty moved in a narrow range were the upper band was 8407 levels and lower band was 8352 levels.
Price Pattern: On daily chart, Nifty prices have formed doji candlesticks, which suggest indecision prices.
MACD: On the below hourly chart, MACD is near signal line above which MSCD would give positive conformation for prices to move higher.
RSI: RSI is above the 60 levels which suggest high momentum in prices.
Conclusion: If Nifty prices hourly close above 8420 levels, then rallies could be continue till 8600 levels while failure to breach mention level prices could drift 8300 levels.
Resistance: R1 8419 R2 8440 R3 8495
Pivot : PL 8385
Support : S1 8364 S2 8330 S3 8275
Our Recommendation
Buy Nifty above 8420 Stop Loss 8370 Target 8500.
Sell Nifty below 8200 Stop Loss 8250 Target 8000.
2. 12th Nov’14 Equity Bazaar
Bank Nifty
Bank Nifty Technical View:
Yesterday we have seen Bank Nifty prices were volatile and made new life time high.
Price Pattern: We have seen Bank Nifty prices are in consolidation formation. However, if prices sustain above the horizontal line then we could see new high of 17800 levels.
MACD: The MACD on the hourly charts has given cross over line which gives positive conformation for prices.
RSI: The momentum indicator, RSI is above 60 levels suggesting high momentum in prices.
Conclusion: If Bank Nifty will sustain above 17570 levels then we expect rally could continue till 17800 levels.
Resistance: R1 17628 R2 17709 R3 17951
Pivot : PL 17467
Support : S1 17386 S2 17225 S3 16983
Our Recommendation
Buy BNF above 17550 Stop Loss 17450 Target: 17800.
Sell BNF below 17300 Stop Loss 17400 Target: 17000.
3. 12th Nov’14 Equity Bazaar
Stock of the Day
Crompton Greaves View:
After short term consolidation we have seen Crompton Greaves has given down trend line breakout and sustain above the crucial resistance of 194 levels.
Moving Average: We have seen Crompton Greaves price is trading above 50 EMA (191) levels which would act as support.
ADX: ADX indicator reading above 25 levels, whereas +DI are greater than –DI which is positive sign for prices.
MACD: The MACD signal line has sustained above zero line which is positive sign for prices.
RSI: Momentum indicator RSI is above 60 levels which show the momentum is strong for stock.
Conclusion: If Crompton Greaves trade above 198 levels then prices could rally towards 204/210 levels.
Resistance: R1 198 R2 201 R3 207
Pivot : PL 195
Support : S1 192 S2 189 S3 183
Our Recommendation
Buy Crompgreav above 198 Stop Loss 193 Target: 204/208
4. 12th Nov’14 Equity Bazaar
Derivative Analysis FIIS Data: FII’s are net Rs 458.04 Cr Buyers on 11th November 2014 and Dll’s are the net Rs 516.98 Cr Sellers on 11th November 2014. Option Data: 8500 CE has the highest OI with 53 lakhs and 8400 CE has the second highest OI with 50 lakhs and 8000 PE has the highest OI with 57 lakhs and 8200 PE has the second highest OI with 50.7 lakhs. Open Interest: The above options data shows that nifty has strong support at 8000 and has resistance at 8500. The change in level will take place once when NIFTY prices breaks 8200 mark. Intraday Option Strategy: (A) Buy Nifty 8400 calls and Sell Nifty 8500 puts if buy level is breached. (B) Sell Nifty 8300 calls and Buy Nifty 8400 puts if sell level is breached.
7. 12th Nov’14 Equity Bazaar
Disclaimer
This is solely for information of clients of Choice Broking and does not construe to be an investment advice. It is also not intended as an offer or solicitation for the purchase and sale of any financial instruments. Any action taken by you on the basis of the information contained herein is your responsibility alone and Choice Broking its subsidiaries or its employees or associates will not be liable in any manner for the consequences of such action taken by you. We have exercised due diligence in checking the correctness and authenticity of the information contained in this recommendation, but Choice Broking or any of its subsidiaries or associates or employees shall not be in any way responsible for any loss or damage that may arise to any person from any inadvertent error in the information contained in this recommendation or any action taken on basis of this information. Technical analysis studies market psychology, price patterns and volume levels. It is used to forecast future price and market movements. Technical analysis is complementary to fundamental analysis and news sources. The recommendations issued herewith might be contrary to recommendations issued by Choice Broking in the company research undertaken as the recommendations stated in this report is derived purely from technical analysis. Choice Broking has based this document on information obtained from sources it believes to be reliable but which it has not independently verified; Choice Broking makes no guarantee, representation or warranty and accepts no responsibility or liability as to its accuracy or completeness. The opinions contained within the report are based upon publicly available information at the time of publication and are subject to change without notice. The information and any disclosures provided herein are in summary form and have been prepared for informational purposes. The recommendations and suggested price levels are intended purely for trading purposes. The recommendations are valid for the day of the report however trading trends and volumes might vary substantially on an intraday basis and the recommendations may be subject to change. The information and any disclosures provided herein may be considered confidential. Any use, distribution, modification, copying, forwarding or disclosure by any person is strictly prohibited. The information and any disclosures provided herein do not constitute a solicitation or offer to purchase or sell any security or other financial product or instrument. The current performance may be unaudited. Past performance does not guarantee future returns. There can be no assurance that investments will achieve any targeted rates of return, and there is no guarantee against the loss of your entire investment. POTENTIAL CONFLICT OF INTEREST DISCLOSURE (as on date of report) Disclosure of interest statement – • Analyst interest of the stock /Instrument(s): - No. • Firm interest of the stock / Instrument (s): - No.