1. 19th Nov’14 Currency Highlights
USDINR
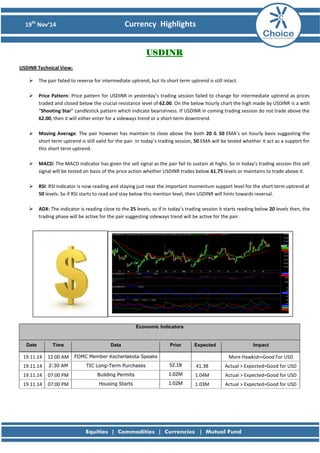
USDINR Technical View:
The pair failed to reverse for intermediate uptrend, but its short term uptrend is still intact.
Price Pattern: Price pattern for USDINR in yesterday’s trading session failed to change for intermediate uptrend as prices traded and closed below the crucial resistance level of 62.00. On the below hourly chart the high made by USDINR is a with “Shooting Star” candlestick pattern which indicate bearishness. If USDINR in coming trading session do not trade above the 62.00, then it will either enter for a sideways trend or a short term downtrend.
Moving Average: The pair however has maintain to close above the both 20 & 50 EMA’s on hourly basis suggesting the short term uptrend is still valid for the pair. In today’s trading session, 50 EMA will be tested whether it act as a support for this short term uptrend.
MACD: The MACD indicator has given the sell signal as the pair fail to sustain at highs. So in today’s trading session this sell signal will be tested on basis of the price action whether USDINR trades below 61.75 levels or maintains to trade above it.
RSI: RSI indicator is now reading and staying just near the important momentum support level for the short term uptrend at 50 levels. So if RSI starts to read and stay below this mention level, then USDINR will hints towards reversal.
ADX: The indicator is reading close to the 25 levels, so if in today’s trading session it starts reading below 20 levels then, the trading phase will be active for the pair suggesting sideways trend will be active for the pair .
Economic Indicators Date Time Data Prior Expected Impact
19.11.14
12:00 AM FOMC Member Kocherlakota Speaks
More Hawkish=Good For USD
19.11.14 2:30 AM TIC Long-Term Purchases 52.1B
41.3B
Actual > Expected=Good for USD
19.11.14
07:00 PM Building Permits 1.02M
1.04M
Actual > Expected=Good for USD
19.11.14
07:00 PM Housing Starts 1.02M
1.03M
Actual > Expected=Good for USD
2. 19th Nov’14 Currency Highlights
EURINR
EURINR Technical View:
The pair is in the short term uptrend, with 77.50 levels as the crucial support for this uptrend.
Price Pattern: The pair price pattern continues to remain bullish, as in the yesterday’s trading session EURINR was only the strongest currency. The pair will observe more upside if USDINR maintains its short term uptrend else the pair can reverse for a sideways trend if USDINR reverse for a short term downtrend.
Moving Average: The prices of EURINR continues to close above both the 20 & 50 EMA’s on hourly basis, suggesting the short uptrend is intact for the pair, with buying signal also remaining valid. Prices have taken strong support at 50EMA on hourly basis which is now the trend changer level for the pair.
MACD: The indicator is now on the verge to give a buy signal as the short term uptrend is intact, so it will be better that one can consider this signal as the prices will trade at new highs in today’s trading session.
RSI: Momentum indicator RSI has exactly taken support at the momentum changer level 50 suggesting the positive momentum is valid for the pair. If RSI maintains this level in today’s trading session, then the short term uptrend will soon convert to intermediate uptrend with pair to trade at new highs in coming trading session.
ADX: The ADX indicator has started to read below the 20 levels, suggesting that if it does not starts to read above 20 levels in today’s trading session then the pair will observe a sideways trend as the trading phase is active for the pair.
Economic Indicators Date Time Data Prior Expected Impact
19.11.14
02:30 PM Current Account
18.9B
21.3B
Actual > Expected=Good for EUR
3. 19th Nov’14 Currency Highlights
GBPINR
GBPINR Technical View:
GBPINR major downtrend still exits, as the pair is now consolidating in a narrow price range.
Price Pattern: GBPINR continues to remain in bearish mode as its observing strong selling from higher levels. In yesterday’s trading session the pair consolidated, so today’s price action will be important to watch to get a clear view on whether the pair will continue its downtrend or reverse for a short term uptrend.
Moving Average: From the moving average perspective, the 20 EMA is now the trend changing level for the pair. If price in today’s trading session starts trading above this, then the pair can rally for intraday and facing a strong resistance at 50 EMA.
MACD: MACD indicator is now the leading indicator, to give a buy signal for the pair. This buy signal will be tested in today’s trading session depending upon the price action else if MACD reverse to give a sell signal then, one can consider it as the major trend is still down.
RSI: The RSI indicator is showing how its gaining strength as it continues to read values above the over-sold region. In today’s trading session if RSI starts to read above the momentum changer level 50, then this will indicate towards the upward reversal for the pair.
ADX: ADX indicator continues to show trending phase for the pair as it reading above 20 levels. This trending phase will also be tested in today’s trading session, if GBPINR continues to consolidate in a narrow range making ADX to read at values below the 20 levels.
Economic Indicators Date Time Data Prior Expected Impact
19.11.14
03:00 PM MPC Member Forbes Speaks
More Hawkish=Good For GBP
19.11.14
03:00 PM MPC Asset Purchase Facility Votes
0-0-9
0-0-9
Actual > Expected=Good for GBP
19.11.14
03:00 PM MPC Official Bank Rate Votes
2-0-7
2-0-7
Actual > Expected=Good for GBP
4. 19th Nov’14 Currency Highlights
JPYINR
JPYINR Technical View:
JPYINR like, GBPINR continues to remain in major downtrend.
Price Pattern: The pair price pattern continues to remain in a strong downtrend and showing no sign of reversal. So our suggestion to trader will be to avoid trading in the pair till there is no confirm and definite price reversal pattern develops for the pair.
Moving Average: JPYINR continues to trade and close below both the 20 & 50 averages, suggesting the major downtrend still exists for the pair. Only if prices trades & closes above the 20 EMA on hourly basis will only hint towards reversal.
MACD: Till there is no confirm and definite price reversal, it will be better to ignore any buy or sell signal from the indicator. But since prices are near trading near its major downtrend bottom, MACD indicator sell signal can also fail.
RSI: With the continuation downtrend, RSI is consistently failing to read and stay above the momentum changer level 50. Once RSI starts to read and stay above this level, then only the pair will ready for a genuine upward reversal.
ADX: Since JPYINR is consolidating in a narrow range, ADX is reading values just above the 20 levels. If in the today’s trading session if ADX starts to read below this level then, pair will continue its sideways trend till upward reversal.
Economic Indicators Date Time Data Prior Expected Impact
19.11.14
10:00 AM Monetary Policy Statement
More Hawkish=Good For JPY
19.11.14
10:00 AM All Industries Activity m/m
-0.1%
1.2%
Actual > Expected=Good for JPY
19.11.14
10:00 AM BOJ Press Conference
More Hawkish=Good For JPY
6. 19th Nov’14 Currency Highlights
Disclaimer
This is solely for information of clients of Choice Broking and does not construe to be an investment advice. It is also not intended as an offer or solicitation for the purchase and sale of any financial instruments. Any action taken by you on the basis of the information contained herein is your responsibility alone and Choice Broking its subsidiaries or its employees or associates will not be liable in any manner for the consequences of such action taken by you. We have exercised due diligence in checking the correctness and authenticity of the information contained in this recommendation, but Choice Broking or any of its subsidiaries or associates or employees shall not be in any way responsible for any loss or damage that may arise to any person from any inadvertent error in the information contained in this recommendation or any action taken on basis of this information. Technical analysis studies market psychology, price patterns and volume levels. It is used to forecast future price and market movements. Technical analysis is complementary to fundamental analysis and news sources. The recommendations issued here with might be contrary to recommendations issued by Choice Broking in the company research undertaken as the recommendations stated in this report is derived purely from technical analysis. Choice Broking has based this document on information obtained from sources it believes to be reliable but which it has not independently verified; Choice Broking makes no guarantee, representation or warranty and accepts no responsibility or liability as to its accuracy or completeness. The opinions contained within the report are based upon publicly available information at the time of publication and are subject to change without notice. The information and any disclosures provided herein are in summary form and have been prepared for informational purposes. The recommendations and suggested price levels are intended purely for trading purposes. The recommendations are valid for the day of the report however trading trends and volumes might vary substantially on an intraday basis and the recommendations may be subject to change. The information and any disclosures provided herein may be considered confidential. Any use, distribution, modification, copying, forwarding or disclosure by any person is strictly prohibited. The information and any disclosures provided herein do not constitute a solicitation or offer to purchase or sell any security or other financial product or instrument. The current performance may be unaudited. Past performance does not guarantee future returns. There can be no assurance that investments will achieve any targeted rates of return, and there is no guarantee against the loss of your entire investment.
POTENTIAL CONFLICT OF INTEREST DISCLOSURE (as on date of report) Disclosure of interest statement – • Analyst interest of the stock /Instrument(s): - No. • Firm interest of the stock / Instrument (s): - No.