1. 11th Nov’14 Equity Bazaar
Nifty
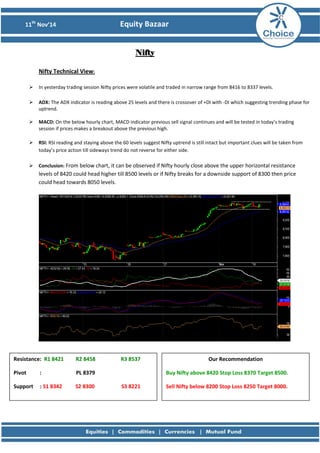
Nifty Technical View:
In yesterday trading session Nifty prices were volatile and traded in narrow range from 8416 to 8337 levels.
ADX: The ADX indicator is reading above 25 levels and there is crossover of +DI with -DI which suggesting trending phase for uptrend.
MACD: On the below hourly chart, MACD indicator previous sell signal continues and will be tested in today’s trading session if prices makes a breakout above the previous high.
RSI: RSI reading and staying above the 60 levels suggest Nifty uptrend is still intact but important clues will be taken from today’s price action till sideways trend do not reverse for either side.
Conclusion: From below chart, it can be observed if Nifty hourly close above the upper horizontal resistance levels of 8420 could head higher till 8500 levels or if Nifty breaks for a downside support of 8300 then price could head towards 8050 levels.
Resistance: R1 8421 R2 8458 R3 8537
Pivot : PL 8379
Support : S1 8342 S2 8300 S3 8221
Our Recommendation
Buy Nifty above 8420 Stop Loss 8370 Target 8500.
Sell Nifty below 8200 Stop Loss 8250 Target 8000.
2. 11th Nov’14 Equity Bazaar
Bank Nifty
Bank Nifty Technical View:
Bank Nifty prices have open at higher levels but not able to sustain and drifted lower levels.
Price Pattern: We remain cautious as Bank Nifty prices is trading near the crucial support of uptrend line drawn in the below hourly chart.
ADX: With the sideways trend in the Bank Nifty prices, the ADX is reading lower values from its higher levels but since it’s at 25 levels suggesting the trending phase still exists.
MACD: It will be better to ignore any buy or sell signal generated by the MACD indicator as there is a sideways trend. MACD indicator buy signal will be valid only if prices trade above previous high.
RSI: The momentum indicator, RSI also remains in the 60-40 range which itself suggest no clear direction of the trend.
Conclusion: If Hourly close below the uptrend line would drift prices towards 17179 levels, if it closes above the 17500 level could head prices to 17800 levels.
Resistance: R1 17680 R2 17878 R3 17940
Pivot : PL 17490
Support : S1 17460 S2 17270 S3 17050
Our Recommendation
Buy BNF above 17550 Stop Loss 17450 Target: 17800.
Sell BNF below 17300 Stop Loss 17400 Target: 17000.
3. 11th Nov’14 Equity Bazaar
Stock of the Day
HAVELLS View:
Havells prices have given hourly close above the horizontal line shown on the below chart.
Moving Average: We have seen Havells price is trading above 50 EMA (295) levels, mention level could act as immediate support.
ADX: ADX indicator continues to show the trending phase for the stock has its values are reading above 25 levels.
MACD: The MACD on the hourly charts has traded near its previous high (12days SMA trades above 26 days SMA) with large positive histogram which is a buying signal.
RSI: RSI is above 60 levels which show the momentum is strong for stock.
Conclusion: If Havells trade above 307 levels then prices could rise to 315/330 levels.
Resistance: R1 311 R2 318 R3 338
Pivot : PL 298
Support : S1 297 S2 278 S3 258
Our Recommendation
Buy HAVELLS above 305 Stop Loss 297 Target: 315/330
4. 11th Nov’14 Equity Bazaar
Derivative Analysis FIIS Data: FII’s are net Rs 355.3 Cr Buyers on 10th November 2014 and Dll’s are the net Rs 314.93 Cr Sellers on 10th November 2014. Option Data: 8500 CE has the highest OI with 50 lakhs and 8400 CE has the second highest OI with 43 lakhs and 8000 PE has the highest OI with 57 lakhs and 8200 PE has the second highest OI with 48 lakhs. Open Interest: The above options data shows that nifty has strong support at 8000 and has resistance at 8500. The change in level will take place once when NIFTY prices breaks 8200 mark. Intraday Option Strategy: (A) Buy Nifty 8400 calls and Sell Nifty 8500 puts if buy level is breached. (B) Sell Nifty 8300 calls and Buy Nifty 8400 puts if sell level is breached.
7. 11th Nov’14 Equity Bazaar
Disclaimer
This is solely for information of clients of Choice Broking and does not construe to be an investment advice. It is also not intended as an offer or solicitation for the purchase and sale of any financial instruments. Any action taken by you on the basis of the information contained herein is your responsibility alone and Choice Broking its subsidiaries or its employees or associates will not be liable in any manner for the consequences of such action taken by you. We have exercised due diligence in checking the correctness and authenticity of the information contained in this recommendation, but Choice Broking or any of its subsidiaries or associates or employees shall not be in any way responsible for any loss or damage that may arise to any person from any inadvertent error in the information contained in this recommendation or any action taken on basis of this information. Technical analysis studies market psychology, price patterns and volume levels. It is used to forecast future price and market movements. Technical analysis is complementary to fundamental analysis and news sources. The recommendations issued herewith might be contrary to recommendations issued by Choice Broking in the company research undertaken as the recommendations stated in this report is derived purely from technical analysis. Choice Broking has based this document on information obtained from sources it believes to be reliable but which it has not independently verified; Choice Broking makes no guarantee, representation or warranty and accepts no responsibility or liability as to its accuracy or completeness. The opinions contained within the report are based upon publicly available information at the time of publication and are subject to change without notice. The information and any disclosures provided herein are in summary form and have been prepared for informational purposes. The recommendations and suggested price levels are intended purely for trading purposes. The recommendations are valid for the day of the report however trading trends and volumes might vary substantially on an intraday basis and the recommendations may be subject to change. The information and any disclosures provided herein may be considered confidential. Any use, distribution, modification, copying, forwarding or disclosure by any person is strictly prohibited. The information and any disclosures provided herein do not constitute a solicitation or offer to purchase or sell any security or other financial product or instrument. The current performance may be unaudited. Past performance does not guarantee future returns. There can be no assurance that investments will achieve any targeted rates of return, and there is no guarantee against the loss of your entire investment. POTENTIAL CONFLICT OF INTEREST DISCLOSURE (as on date of report) Disclosure of interest statement – • Analyst interest of the stock /Instrument(s): - No. • Firm interest of the stock / Instrument (s): - No.