Nifty, Bank Nifty and stock technical analysis and recommendations
1. 1st Oct’14 Equity Bazaar
Nifty
Nifty Technical View:
Yesterday, Nifty remained within a broad range throughout the first half; but, posts the midsession; we witnessed tremendous volatility in the market. As a result, the index recovered from the intraday high and closed with very nominal gain.
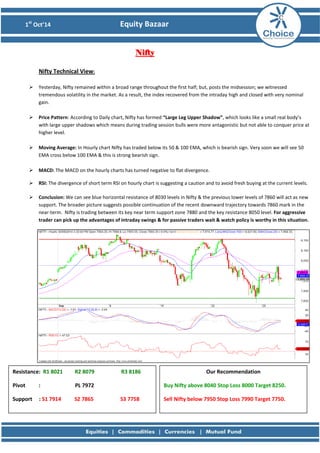
Price Pattern: According to Daily chart, Nifty has formed “Large Leg Upper Shadow”, which looks like a small real body’s with large upper shadows which means during trading session bulls were more antagonistic but not able to conquer price at higher level.
Moving Average: In Hourly chart Nifty has traded below its 50 & 100 EMA, which is bearish sign. Very soon we will see 50 EMA cross below 100 EMA & this is strong bearish sign.
MACD: The MACD on the hourly charts has turned negative to flat divergence.
RSI: The divergence of short term RSI on hourly chart is suggesting a caution and to avoid fresh buying at the current levels.
Conclusion: We can see blue horizontal resistance of 8030 levels in Nifty & the previous lower levels of 7860 will act as new support. The broader picture suggests possible continuation of the recent downward trajectory towards 7860 mark in the near-term. Nifty is trading between its key near term support zone 7880 and the key resistance 8050 level. For aggressive trader can pick up the advantages of intraday swings & for passive traders wait & watch policy is worthy in this situation.
Resistance: R1 8021 R2 8079 R3 8186
Pivot : PL 7972
Support : S1 7914 S2 7865 S3 7758
Our Recommendation
Buy Nifty above 8040 Stop Loss 8000 Target 8250.
Sell Nifty below 7950 Stop Loss 7990 Target 7750.
2. 1st Oct’14 Equity Bazaar
Bank Nifty
Bank Nifty Technical View:
After given gap down opening, Bank Nifty prices bounced and tried to breach the previous day’s high & retesting its major resistance of 15671 (100 hr EMA) levels but Bank Nifty failed to break the mention resistance level suggesting bears are in the power.
Price Pattern: According to Daily chart, Bank Nifty also formed “Large Leg Upper Shadow”, which means during trading session bulls were more antagonistic but not able to conquer price at higher level.
Moving Average: In hourly chart, The Bank Nifty is trading below the 50 EMA & 100 EMA. The 100 hr EMA has been acting as instant resistance.
MACD: The hourly MACD has gone into the sell mode
RSI: The RSI is near to its normal range and is signaling a continuation of slow downtrend.
Conclusion: Bank Nifty could trade in large range. The strong resistance is at 16288 levels as shown by red horizontal line & lower support of 15200 levels as shown by the green horizontal line. The charts suggest that downward rally can continue but the bearish flags is appearing so it’s better to sell on rise for belligerent trader elite awake the leads of intraday smacks & for flaccid traders wait & watch policy is good in this situation.
Resistance: R1 15546 R2 15701 R3 15961
Pivot : PL 15441
Support : S1 15286 S2 15181 S3 14921
Our Recommendation
Buy BNF above 15650 Stop Loss 15550 Target: 15900.
Sell BNF below 15350 Stop Loss 15450 Target: 15000.
3. 1st Oct’14 Equity Bazaar
Stock of the Day
Dhanlaxmi Bank View:
After a decent correction in Dhanlaxmi Bank stock is in short term uptrend and closed above it’s 50 hour EMA.
Chart Pattern: On hourly chart, the pair now seems to be forming a “Bullish Flag Pattern” which marks consolidation in a narrow range before sharp up move. Hence, from current levels downside seems limited till Rs.42 levels strong support.
Moving Average: In Hourly chart Dhanlaxmi Bank has traded in between narrow range of its 50 & 100 EMA, soon we can see 50 EMA cross above 100 EMA which is strong bullish sign.
MACD: The MACD on the hourly charts has turned into strong positive divergence (12days sma trades above 26 days sma) with large positive histograms sign as strong bullishness.
RSI: Relative Strength Index (RSI) moving above 50 levels, the pair now seems to have entered into a near-term bullish zone.
Conclusion: The charts suggest that Dhanlaxmi Bank trades in optimistic direction consequently spill can be used as buying opportunities to test sophisticated levels for the day. For short term there is a possibility of running upward rally and the next resistance would be watch around Rs.48 level.
Resistance : R1 44 R2 44.5 R3 45.5
Pivot : PL43.5
Support : S1 43 S2 42.5 S3 41.5
Our Recommendation
Buy Dhanlaxmi Bank at 44 Stop Loss 42.5 Target: 48
4. 1st Oct’14 Equity Bazaar
Derivative Analysis FIIS Data: FII’s are the net Seller on 30th September 2014 is Rs 485.96 Cr and Dll’s are the net Buyer on 30th September 2014 is Rs 201.24 Cr. Option Data: 8200 CE has the highest OI with 56 lakhs and 8100 CE has the second highest OI with 46 lakhs and 7800 PE has the highest OI with 58 lakhs and 7900 PE has the second highest OI with 53 lakhs. Open Interest: The above options data shows nifty has now a strong support at 7900 and resistance at 8100 the trend change level as per option data is 8000. Intraday Option Strategy: (A) Buy Nifty 7900 calls and Sell Nifty 8200 puts if buy level is breached. (B) Sell Nifty 8200 calls and Buy Nifty 7800 puts if sell level is breached.
7. 1st Oct’14 Equity Bazaar
Disclaimer
This is solely for information of clients of Choice India and does not construe to be an investment advice. It is also not intended as an offer or solicitation for the purchase and sale of any financial instruments. Any action taken by you on the basis of the information contained herein is your responsibility alone and Choice India its subsidiaries or its employees or associates will not be liable in any manner for the consequences of such action taken by you. We have exercised due diligence in checking the correctness and authenticity of the information contained in this recommendation, but Choice India or any of its subsidiaries or associates or employees shall not be in any way responsible for any loss or damage that may arise to any person from any inadvertent error in the information contained in this recommendation or any action taken on basis of this information. Technical analysis studies market psychology, price patterns and volume levels. It is used to forecast future price and market movements. Technical analysis is complementary to fundamental analysis and news sources. The recommendations issued herewith might be contrary to recommendations issued by Choice India in the company research undertaken as the recommendations stated in this report is derived purely from technical analysis. Choice India has based this document on information obtained from sources it believes to be reliable but which it has not independently verified; Choice India makes no guarantee, representation or warranty and accepts no responsibility or liability as to its accuracy or completeness. The opinions contained within the report are based upon publicly available information at the time of publication and are subject to change without notice. The information and any disclosures provided herein are in summary form and have been prepared for informational purposes. The recommendations and suggested price levels are intended purely for trading purposes. The recommendations are valid for the day of the report however trading trends and volumes might vary substantially on an intraday basis and the recommendations may be subject to change. The information and any disclosures provided herein may be considered confidential. Any use, distribution, modification, copying, forwarding or disclosure by any person is strictly prohibited. The information and any disclosures provided herein do not constitute a solicitation or offer to purchase or sell any security or other financial product or instrument. The current performance may be unaudited. Past performance does not guarantee future returns. There can be no assurance that investments will achieve any targeted rates of return, and there is no guarantee against the loss of your entire investment.
POTENTIAL CONFLICT OF INTEREST DISCLOSURE (as on date of report) Disclosure of interest statement – • Analyst interest of the stock /Instrument(s): - No. • Firm interest of the stock / Instrument (s): - No.