1. 7th Nov’14 Equity Bazaar
Nifty
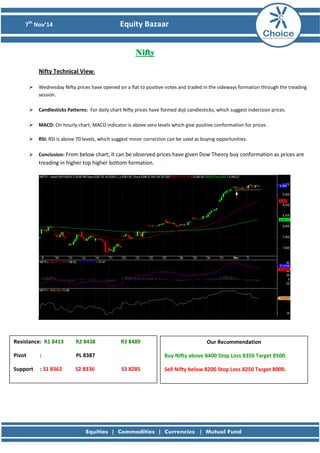
Nifty Technical View:
Wednesday Nifty prices have opened on a flat to positive notes and traded in the sideways formation through the treading session.
Candlesticks Patterns: For daily chart Nifty prices have formed doji candlesticks, which suggest indecision prices.
MACD: On hourly chart, MACD indicator is above zero levels which give positive conformation for prices.
RSI: RSI is above 70 levels, which suggest minor correction can be used as buying opportunities.
Conclusion: From below chart, it can be observed prices have given Dow Theory buy conformation as prices are treading in higher top higher bottom formation.
Resistance: R1 8413 R2 8438 R3 8489
Pivot : PL 8387
Support : S1 8362 S2 8336 S3 8285
Our Recommendation
Buy Nifty above 8400 Stop Loss 8350 Target 8500.
Sell Nifty below 8200 Stop Loss 8250 Target 8000.
2. 7th Nov’14 Equity Bazaar
Bank Nifty
Bank Nifty Technical View:
Bank Nifty prices following up move and formed large bullish candlesticks on daily chart which shows uptrend is still intact.
MACD: MACD has taken support of the signal line and moved higher which gives positive conformation for prices.
RSI: Momentum indicator RSI is overbought zone which suggest strong in momentum for Bank Nifty prices.
Conclusion: Bank Nifty prices are moving in uptrend therefore trade above 17550 levels could suggest more upside.
Resistance: R1 17761 R2 18032 R3 18142
Pivot : PL 17490
Support : S1 17435 S2 17164 S3 16838
Our Recommendation
Buy BNF above 17500 Stop Loss 17400 Target: 17800.
Sell BNF below 17400 Stop Loss 17500 Target: 17000.
3. 7th Nov’14 Equity Bazaar
Stock of the Day
AmbujaCements View:
Prices have given hourly closed below the uptrend line shown on the below chart.
Moving Average: We have seen Ambuja Cements prices are treading below 50 EMA (224) levels, mention level could act as immediate resistance.
MACD: On hourly charts MACD has formed negative divergence which has been confirmed by the prices by giving close below the mentioned trend line.
RSI: RSI is near 40 levels, below which prices could face weakness in momentum.
Conclusion: If Ambuja Cements will trade below 221 levels then prices could be fall till 217/212 levels.
Resistance: R1 226 R2 230 R3 237
Pivot : PL 224
Support : S1 220 S2 217 S3 210
Our Recommendation
Sell AMBUJACEM below 220 Stop Loss 225 Target: 215
4. 7th Nov’14 Equity Bazaar
Derivative Analysis FIIS Data: FII’s are net Rs 1030.85 Cr Buyers on 5th November 2014 and Dll’s are the net Rs 1204.63 Cr Sellers on 5th November 2014. Option Data: 8500 CE has the highest OI with 41 lakhs and 8400 CE has the second highest OI with 39 lakhs and 8000 PE has the highest OI with 55 lakhs and 8200 PE has the second highest OI with 44 lakhs. Open Interest: The above options data shows that nifty has strong support at 8000 and has resistance at 8500. The change in level will take place once when NIFTY prices breaks 8200 mark. Intraday Option Strategy: (A) Buy Nifty 8400 calls and Sell Nifty 8500 puts if buy level is breached. (B) Sell Nifty 8300 calls and Buy Nifty 8400 puts if sell level is breached.
7. 7th Nov’14 Equity Bazaar
Disclaimer
This is solely for information of clients of Choice Broking and does not construe to be an investment advice. It is also not intended as an offer or solicitation for the purchase and sale of any financial instruments. Any action taken by you on the basis of the information contained herein is your responsibility alone and Choice Broking its subsidiaries or its employees or associates will not be liable in any manner for the consequences of such action taken by you. We have exercised due diligence in checking the correctness and authenticity of the information contained in this recommendation, but Choice Broking or any of its subsidiaries or associates or employees shall not be in any way responsible for any loss or damage that may arise to any person from any inadvertent error in the information contained in this recommendation or any action taken on basis of this information. Technical analysis studies market psychology, price patterns and volume levels. It is used to forecast future price and market movements. Technical analysis is complementary to fundamental analysis and news sources. The recommendations issued herewith might be contrary to recommendations issued by Choice Broking in the company research undertaken as the recommendations stated in this report is derived purely from technical analysis. Choice Broking has based this document on information obtained from sources it believes to be reliable but which it has not independently verified; Choice Broking makes no guarantee, representation or warranty and accepts no responsibility or liability as to its accuracy or completeness. The opinions contained within the report are based upon publicly available information at the time of publication and are subject to change without notice. The information and any disclosures provided herein are in summary form and have been prepared for informational purposes. The recommendations and suggested price levels are intended purely for trading purposes. The recommendations are valid for the day of the report however trading trends and volumes might vary substantially on an intraday basis and the recommendations may be subject to change. The information and any disclosures provided herein may be considered confidential. Any use, distribution, modification, copying, forwarding or disclosure by any person is strictly prohibited. The information and any disclosures provided herein do not constitute a solicitation or offer to purchase or sell any security or other financial product or instrument. The current performance may be unaudited. Past performance does not guarantee future returns. There can be no assurance that investments will achieve any targeted rates of return, and there is no guarantee against the loss of your entire investment. POTENTIAL CONFLICT OF INTEREST DISCLOSURE (as on date of report) Disclosure of interest statement – • Analyst interest of the stock /Instrument(s): - No. • Firm interest of the stock / Instrument (s): - No.