Equity bazaar
•
0 likes•53 views

The document provides a technical analysis of the Nifty, Bank Nifty, and ABB stock from September 18th, 2014. It finds that the Nifty and Bank Nifty are in a downward trend based on indicators like the moving averages, MACD, and RSI. It recommends selling the Nifty below 7950 and the Bank Nifty below 15780. The analysis finds ABB to be in an upward trend based on positive divergences in the MACD and rising volume and recommends buying above 1236.

Recommended
More Related Content
What's hot
What's hot (20)
Viewers also liked
Viewers also liked (14)
Similar to Equity bazaar
Similar to Equity bazaar (20)
Equity bazaar
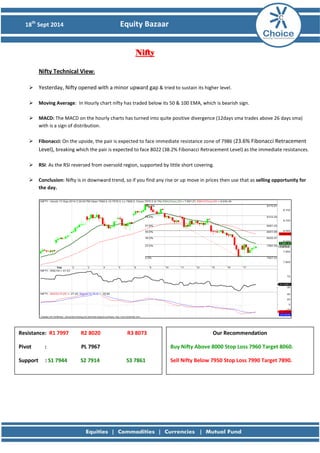
- 1. 18th Sept 2014 Equity Bazaar Nifty Nifty Technical View: Yesterday, Nifty opened with a minor upward gap & tried to sustain its higher level. Moving Average: In Hourly chart nifty has traded below its 50 & 100 EMA, which is bearish sign. MACD: The MACD on the hourly charts has turned into quite positive divergence (12days sma trades above 26 days sma) with is a sign of distribution. Fibonacci: On the upside, the pair is expected to face immediate resistance zone of 7986 (23.6% Fibonacci Retracement Level), breaking which the pair is expected to face 8022 (38.2% Fibonacci Retracement Level) as the immediate resistances. RSI: As the RSI reversed from oversold region, supported by little short covering. Conclusion: Nifty is in downward trend, so if you find any rise or up move in prices then use that as selling opportunity for the day. Resistance: R1 7997 R2 8020 R3 8073 Pivot : PL 7967 Support : S1 7944 S2 7914 S3 7861 Our Recommendation Buy Nifty Above 8000 Stop Loss 7960 Target 8060. Sell Nifty Below 7950 Stop Loss 7990 Target 7890.
- 2. 18th Sept 2014 Equity Bazaar Bank Nifty Bank Nifty Technical View: Yesterday, Bank Nifty opened with a minor upward gap & tried to sustain its higher level. Price Pattern: Once again we can say that there is a positive correlation between Nifty & Bank Nifty. According to hourly chart, Bank Nifty gave gap up opening & it moved up in a small range throughout the day which looks like that Bank Nifty is forming a bearish flag pattern. Moving Average: In Hourly chart Bank Nifty has traded below its 50 & 100 EMA & 50 EMA cross below 100 EMA & which is again a bearish sign. MACD: The MACD on the hourly charts turn to in strong negative divergence (12days sma trades below 26 days sma) with negative histogram which act as selling signal. Fibonacci: On the upside, the pair is expected to face immediate resistance zone of 7986 (23.6% Fibonacci Retracement Level), breaking which the pair is expected to face 8022 (38.2% Fibonacci Retracement Level) as the immediate resistances. RSI: Oscillator RSI is in downward direction and is trading near 25.48 levels, which is considered as an oversold area. Conclusion: Below charts suggest that the downward rally can continue but the bearish flags is appearing so it’s better to sell on rise. Resistance : R1 15917 R2 15996 R3 16134 Pivot : PL 15858 Support : S1 15779 S2 15720 S3 15582 Our Recommendation Buy BNF Above 15900 Stop Loss 15820 Target 16100 Sell BNF Below 15780 Stop Loss 15860 Target 15580
- 3. 18th Sept 2014 Equity Bazaar Stock of the Day ABB Technical View: ABB ended the day with bullish candle & giving close at its all-time high. Though such a steep rise is definitely a matter of concern which could result in retracement but still we prefer staying with the bullish trend. Price Pattern: In this script we have seen large real bodies of white candlesticks which clearly means buyers are demanded more & more share whatever prices increases. Moving Average: In Hourly chart ABB has traded above its 50 & 100 EMA which is bullish sign. MACD: The MACD on the hourly charts trading in strong positive divergence (12days sma trades above 26 days sma) with large positive histogram which act as strong buying signal. Volume: Stock is currently consolidating around this level along with increase in volume which indicates more of buying can be done. RSI: Relative Strength Index (RSI) moving above 70, the pair now seems to have entered into a near-term overbought territory. Conclusion: The pair might remain in overbought conditions for an extended period and continue appreciating towards the levels of 1400 in near-term. Resistance : R1 1260 R2 1296 R3 1386 Pivot : PL 1206 Support : S1 1170 S2 1116 S3 1026 Our Recommendation Buy ABB Above 1236 Stop Loss 1125 Target 1400
- 4. 18th Sept 2014 Equity Bazaar Derivative Analysis FIIS Data: FII’s are the net buyers on 17 September 2014 is Rs 136.08 Lakhs and Dll’s are the net sellers on 17 September 2014 is Rs 169.19 Lakhs. Option Data: 8200 CE has the highest OI with 80 lakhs and 8100 CE has the second highest OI with 60 lakhs and 8000 PE has the highest OI with 69 lakhs and 7900 PE has the second highest OI with 59 lakhs. Open Interest: The above options data shows nifty has now a strong support at 8000 and resistance at 8200 the trend change level as per option data is 8100. Intraday Option Strategy: (A) Buy Nifty 8100 calls and Sell Nifty 8000 puts if buy level is breached (B) Sell Nifty 8100 calls and Buy Nifty 8000 puts if sell level is breached
- 5. 18th Sept 2014 Equity Bazaar SymbolR1R2R3R4PivotS1S2S3S4TrendActionACC 1,512 1,541 1,589 1,637 1,493 1,464 1,445 1,397 1,349 DownSellAmbuja Cements211 216 223 231 208 204 201 193 186 DownSellAsian Paints 660 672 693 714 651 639 630 609 588 DownSellAxis Bank409.7 420.2 436.8 453.5 404 393.0 386.9 370.2 353.6 DownSellBajaj Auto 2,340.6 2,378.6 2,440.2 2,501.8 2,317 2,279.0 2,255.4 2,193.8 2,132.2 DownSellBank of Baroda949.4 975.6 1,017.7 1,059.8 933 907.3 891.4 849.3 807.2 DownSellBHEL220.8 225.7 233.6 241.5 218 212.9 209.9 202.0 194.1 DownSellBPCL676.5 703.0 744.5 786.0 662 635.0 620.0 578.5 537.0 DownSellBharti Airtel416.8 421.2 429.3 437.4 413 408.7 405.0 396.9 388.8 UPBuyCairn 325.9 332.0 341.6 351.3 322 316.2 312.7 303.0 293.4 DownSellCipla 634.5 649.3 674.2 699.2 624 609.5 599.4 574.4 549.5 UPBuy Coal India 350.6 356.8 367.0 377.2 347 340.4 336.4 326.2 316.0 DownSellDLF 175.28 182.07 192.97 203.87 171.17 164.38 160.27 149.37 138.47 DownSellDr. Reddy's Lab3,034.13 3,058.52 3,108.47 3,158.42 3,008.57 2,984.18 2,958.62 2,908.67 2,858.72 UPBuyGAIL 458.80 469.05 487.15 505.25 450.95 440.70 432.85 414.75 396.65 UPBuy Grasim 3,616.73 3,667.12 3,764.62 3,862.12 3,569.62 3,519.23 3,472.12 3,374.62 3,277.12 DownSellHCL Tech1,630.60 1,655.65 1,698.55 1,741.45 1,612.75 1,587.70 1,569.85 1,526.95 1,484.05 UPBuyHDFC Bank 859.37 867.73 881.78 895.83 853.68 845.32 839.63 825.58 811.53 UPBuyHero MotoCorp 2,816.78 2,843.07 2,888.72 2,934.37 2,797.42 2,771.13 2,751.77 2,706.12 2,660.47 UPBuyHindalco164.20 168.05 174.00 179.95 162.10 158.25 156.15 150.20 144.25 DownSellHindustan Unilever760.95 765.90 776.95 788.00 754.85 749.90 743.80 732.75 721.70 DownSellHDFC1,034.75 1,051.70 1,079.65 1,107.60 1,023.75 1,006.80 995.80 967.85 939.90 DownSellI T C 355.63 358.12 363.42 368.72 352.82 350.33 347.52 342.22 336.92 DownSellICICI Bank 1,548.05 1,570.35 1,605.85 1,641.35 1,534.85 1,512.55 1,499.35 1,463.85 1,428.35 DownSellIDFC147.37 150.83 156.38 161.93 145.28 141.82 139.73 134.18 128.63 DownSellIndusInd Bank633.30 648.10 673.55 699.00 622.65 607.85 597.20 571.75 546.30 DownSellInfosys 3,686.63 3,722.02 3,788.92 3,855.82 3,655.12 3,619.73 3,588.22 3,521.32 3,454.42 UPBuyJSPL225.80 233.30 245.20 257.10 221.40 213.90 209.50 197.60 185.70 DownSellKotak Mahindra Bank1,046.38 1,065.32 1,095.37 1,125.42 1,035.27 1,016.33 1,005.22 975.17 945.12 UPBuy LT1,553.35 1,591.05 1,651.40 1,711.75 1,530.70 1,493.00 1,470.35 1,410.00 1,349.65 DownSellLupin1,418.70 1,476.50 1,568.65 1,660.80 1,384.35 1,326.55 1,292.20 1,200.05 1,107.90 UPSellM&M1,380.47 1,388.58 1,406.63 1,424.68 1,370.53 1,362.42 1,352.48 1,334.43 1,316.38 SidewaysNo actionMaruti Suzuki2,976.77 3,003.18 3,052.48 3,101.78 2,953.88 2,927.47 2,904.58 2,855.28 2,805.98 DownSellNMDC179.90 186.30 197.00 207.70 175.60 169.20 164.90 154.20 143.50 DownSellNTPC135.17 138.18 142.88 147.58 133.48 130.47 128.78 124.08 119.38 DownSellONGC418.77 428.78 444.58 460.38 412.98 402.97 397.18 381.38 365.58 DownSellPower Grid137.67 139.38 142.68 145.98 136.08 134.37 132.78 129.48 126.18 DownSellPNB994.90 1,025.70 1,075.45 1,125.20 975.95 945.15 926.20 876.45 826.70 DownSellReliance996.87 1,014.33 1,041.98 1,069.63 986.68 969.22 959.03 931.38 903.73 DownSellSesa Sterlite 287.93 290.82 297.62 304.42 284.02 281.13 277.22 270.42 263.62 DownSellSBIN2,621.40 2,679.70 2,773.70 2,867.70 2,585.70 2,527.40 2,491.70 2,397.70 2,303.70 DownSellSun Pharma807.90 817.55 834.00 850.45 801.10 791.45 784.65 768.20 751.75 DownSellTCS2,569.23 2,587.62 2,618.62 2,649.62 2,556.62 2,538.23 2,525.62 2,494.62 2,463.62 UPBuyTata Motors508.78 517.82 533.92 550.02 501.72 492.68 485.62 469.52 453.42 DownSellTata Power87.88 92.22 99.22 106.22 85.22 80.88 78.22 71.22 64.22 DownSellTata Steel503.78 517.42 539.67 561.92 495.17 481.53 472.92 450.67 428.42 DownSellTech Mahindra2,464.10 2,504.95 2,572.35 2,639.75 2,437.55 2,396.70 2,370.15 2,302.75 2,235.35 UPBuyUltraTech Cement 2,607.55 2,663.90 2,763.65 2,863.40 2,564.15 2,507.80 2,464.40 2,364.65 2,264.90 DownSellUnited Spirits2,399.77 2,431.28 2,490.08 2,548.88 2,372.48 2,340.97 2,313.68 2,254.88 2,196.08 DownSellWipro570.93 582.42 601.37 620.32 563.47 551.98 544.52 525.57 506.62 UPBuy
- 6. 18th Sept 2014 Equity Bazaar Amit Pawar (Research Associate) amit.pawar@choiceindia.com Rohan Shinde (Research Associate) rohan.shinde@choiceindia.com Deveya Gaglani (Research Advisor) deveya.gaglani@chocieindia.com For Private Circulation Only Website: www.choiceindia.com https://twitter.com/ChoiceBroking http://www.slideshare.net/choiceindiabroking https://www.youtube.com/user/ChoiceBroking https://plus.google.com/115293033595831069270/posts https://www.facebook.com/pages/Choice-Equity-Broking-Pvt-Ltd/352491718249644 https://www.linkedin.com/company/choice-international-limited?trk=parent_company_logo
- 7. 18th Sept 2014 Equity Bazaar Disclaimer This is solely for information of clients of Choice India and does not construe to be an investment advice. It is also not intended as an offer or solicitation for the purchase and sale of any financial instruments. Any action taken by you on the basis of the information contained herein is your responsibility alone and Choice India its subsidiaries or its employees or associates will not be liable in any manner for the consequences of such action taken by you. We have exercised due diligence in checking the correctness and authenticity of the information contained in this recommendation, but Choice India or any of its subsidiaries or associates or employees shall not be in any way responsible for any loss or damage that may arise to any person from any inadvertent error in the information contained in this recommendation or any action taken on basis of this information. Technical analysis studies market psychology, price patterns and volume levels. It is used to forecast future price and market movements. Technical analysis is complementary to fundamental analysis and news sources. The recommendations issued herewith might be contrary to recommendations issued by Choice India in the company research undertaken as the recommendations stated in this report is derived purely from technical analysis. Choice India has based this document on information obtained from sources it believes to be reliable but which it has not independently verified; Choice India makes no guarantee, representation or warranty and accepts no responsibility or liability as to its accuracy or completeness. The opinions contained within the report are based upon publicly available information at the time of publication and are subject to change without notice. The information and any disclosures provided herein are in summary form and have been prepared for informational purposes. The recommendations and suggested price levels are intended purely for trading purposes. The recommendations are valid for the day of the report however trading trends and volumes might vary substantially on an intraday basis and the recommendations may be subject to change. The information and any disclosures provided herein may be considered confidential. Any use, distribution, modification, copying, forwarding or disclosure by any person is strictly prohibited. The information and any disclosures provided herein do not constitute a solicitation or offer to purchase or sell any security or other financial product or instrument. The current performance may be unaudited. Past performance does not guarantee future returns. There can be no assurance that investments will achieve any targeted rates of return, and there is no guarantee against the loss of your entire investment. POTENTIAL CONFLICT OF INTEREST DISCLOSURE (as on date of report) Disclosure of interest statement – • Analyst interest of the stock /Instrument(s): - No. • Firm interest of the stock / Instrument (s): - No.